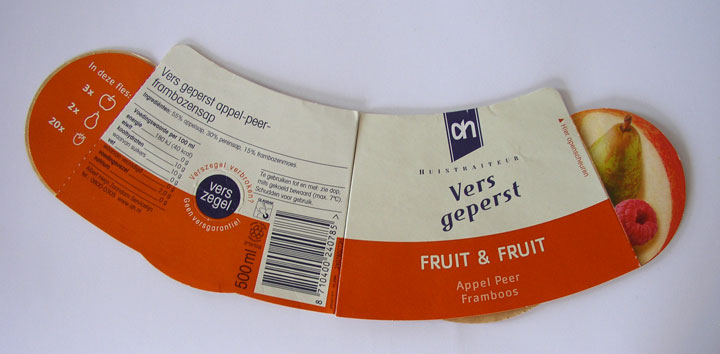
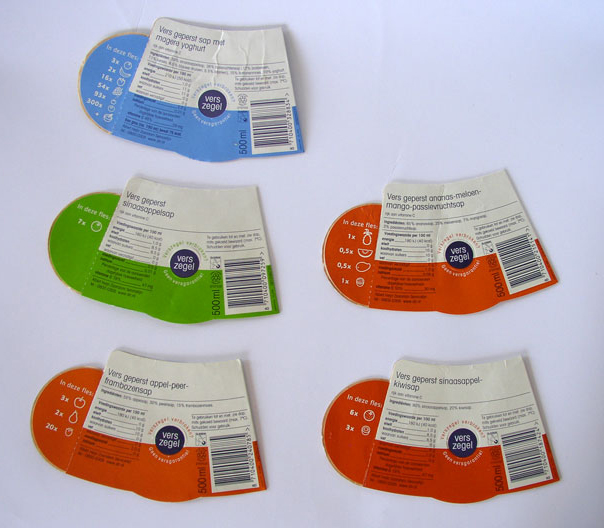
I don’t know if Albert Heijn grocery stores in the Netherlands still use this style of label for the juice, but I was instantly intrigued by the way they present the ingredients using cute little fruit icons on the back side of the labels. The front of the label also sports photographs of the main fruits. Without reading text, the icons on the back tell what quantity of which fruits are found in each juice. In addition to providing information, these graphics re-enforce marketing messages that the juice is 100% fruit. Lekker!
Month: May 2008
Building an Information Bridge
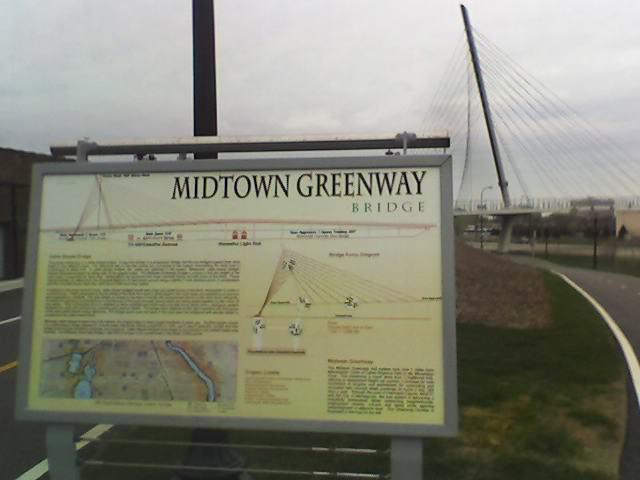 There’s a new bike/pedestrian bridge on the Midtown Greenway; and with it, a new sign that gives details about the bridge’s construction. (The mast of the cable bridge shown in background.) Specific data -angles of the cables- is highlighted in the graphic, as well as a map pin-pointing the location on the route across the city, and additional text about the construction. Just the kind of information a passer-by might be interested in for such a unique construction.
Such information gives meaning to our surroundings and encourages ownership.
Next step to further communicate? – include a visual tag so a passer-by can link directly to a website with more info via their camera phone.
Grocery Bag Life Cycle
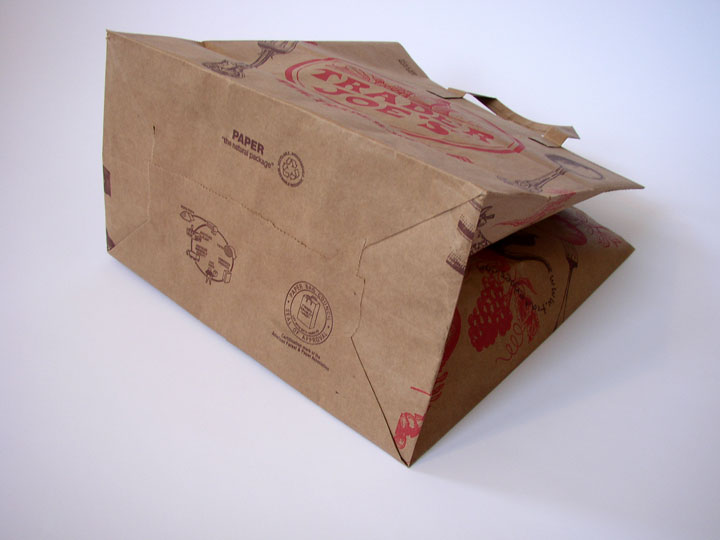
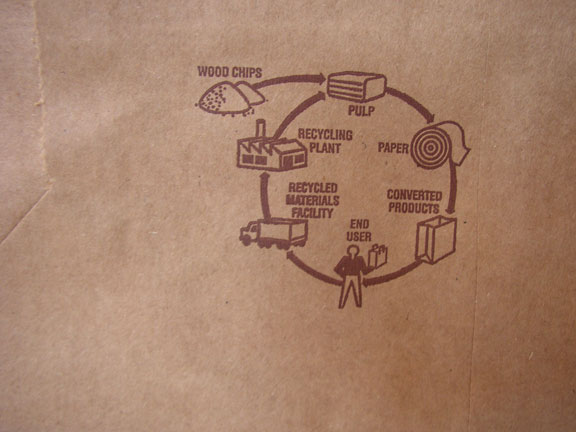
Lately, I’ve seen a few paper grocery bags that have a small graphic of the life cycle printed on the bottom. It’s not very descriptive, but it’s nice to see this small reminder about the larger impact of this simple, everyday item. It would even better to see more detailed information on distance traveled, where the wood chips come from, actual recycled content, etc.
The Beginning of the Blog
This catalog aims to feature existing designs and other forms of visual communication that inspire understanding about the big-picture impacts of the ordinary everyday. The examples posted are both found and self-generated.
Visual communication (often in the form of information graphics) can be a powerful tool to help people understand the big-picture impact of a product or service.
It’s my hope that this will serve as inspiration for visual display of product background stories.
