Economic Breakdown: Chocolate

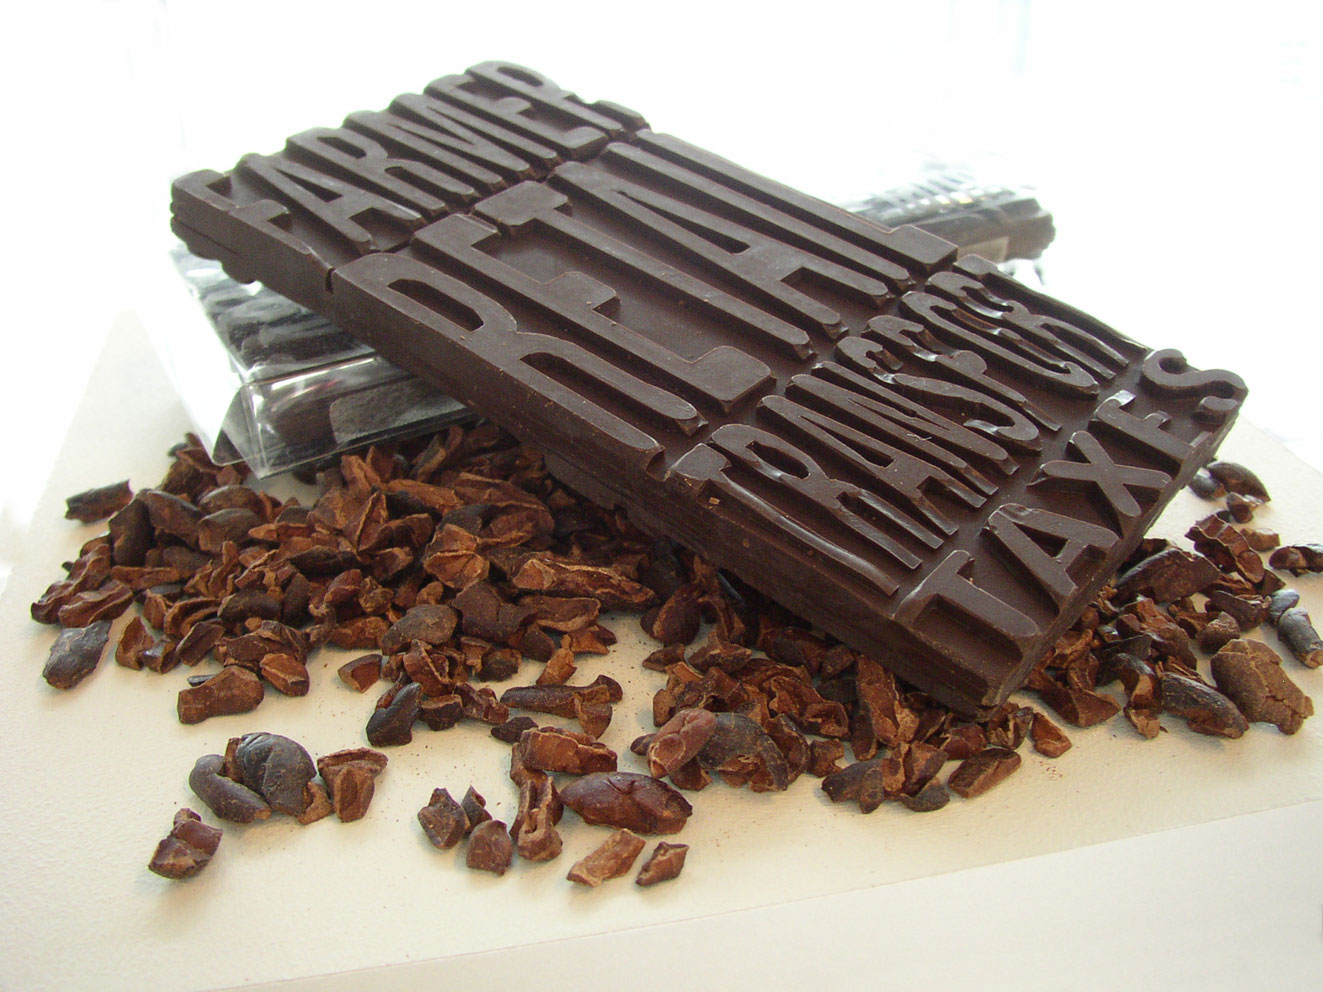
chocolate bar with its economics imprinted

The economics of this (fair trade) chocolate bar are molded into it. The consumer can readily see what percentage of the money they paid went to the farmer vs. transportation. On the reverse is another set of the same text; this time representing non-fair trade chocolate (the farmer gets only half as much as the fair trade example).

Part of a 2006 thesis project on communicating product backgrounds.

Electricity Loses Its Way Home

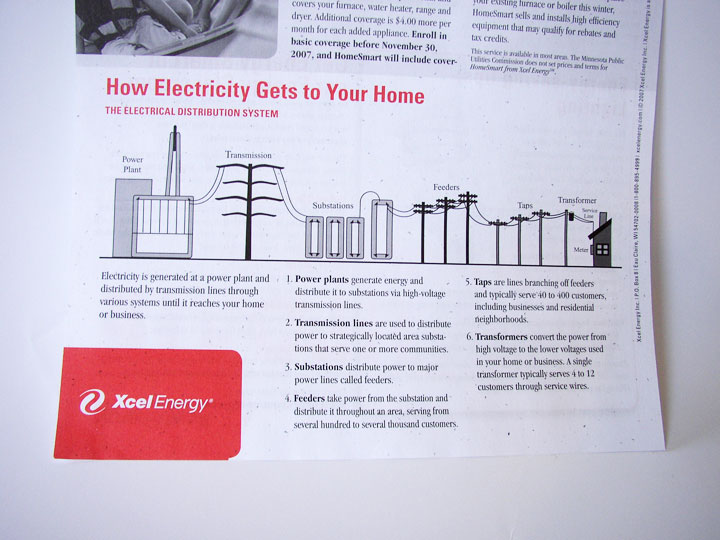
How Electricity Gets to Your Home

How Electricity Gets to Your Home. Context is everything. Without a direct connection with the interests of the intended audience, any information graphic – no matter how well-rendered – will fall flat.

This graphic came with a newsletter that my electric company sends out. But they missed the boat: What do I, as a consumer of electricity, care about “feeders” or “taps”? Though not a bad representation, this graphic feels more like it belongs in an introductory text book for engineers. If the graphic were to explain itself (such as why “taps” are important) and include interesting factoids, I would be glad for the mini education session.

Graphics like these, if splattered with relevant information, offer an interesting insight into the world of electric power. But it’s a fine line between providing superfluous information, and providing information that’s relevant an inspiring for a particular audience.

Timberland

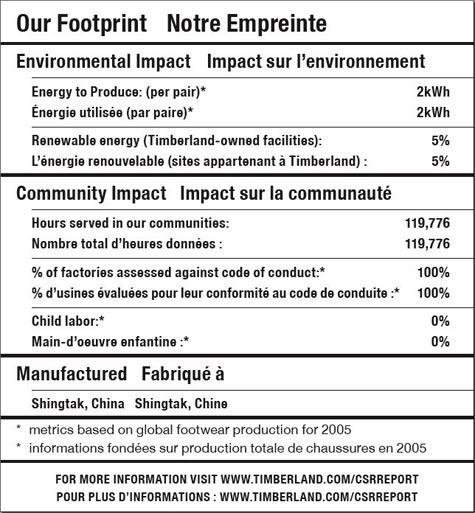
Timberland footprint label

This much-hailed label from Timberland was one of the first to label a product with details on the social and sustainability footprint of the product. It was a good start, but not nearly the level of detail that is possible – nor the level that consumers are clamoring for.

It’s a laudable first effort — in theory, at least. In real life, it’s not very helpful. Simply put: there’s less going on here than meets the eye. –Timberland Reveals Its “Nutritional” Footprint, Worldchanging

Though approachable because the label is created in the format of a nutrition label, beyond that, it’s not very visually satisfying. More depth and emotion could have been portrayed had they gone more into infographics.