Ba Baa Baacode

Baa code entry

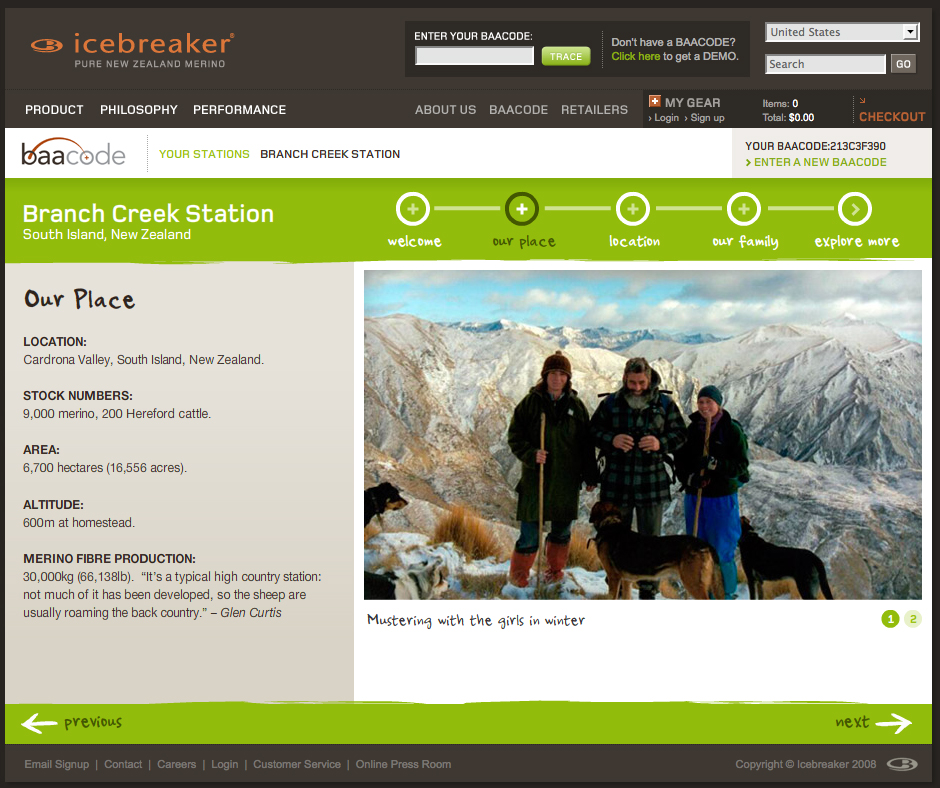
Consumers can track the back story of their Icebreaker product through a portal on the company’s homepage.

BaaCode micro site screengrab

Entering a ‘baacode’ reveals pictures and video clips of the people that raise the sheep and the place they roam.

The information for the sample code paints only a picture around the actual beast (sheep) that the wool fibers come from – not the full production cycle or other components of the clothing. But it’s a good start and an intriguing, at least partially interactive space.

It’s great to offer a sample code, but it would be even better to further incorporate the theme of transparency into the application by opening up the archives so that anyone perusing the website can see details behind all the products. (Only having viewed one sample location upon many visits, I’m also skeptical about how many different stories are actually covered in the online application).

The concept is ripe with potential to give the consumer cues to the product’s backstory at point-of-sale.

The world on your coffee cup

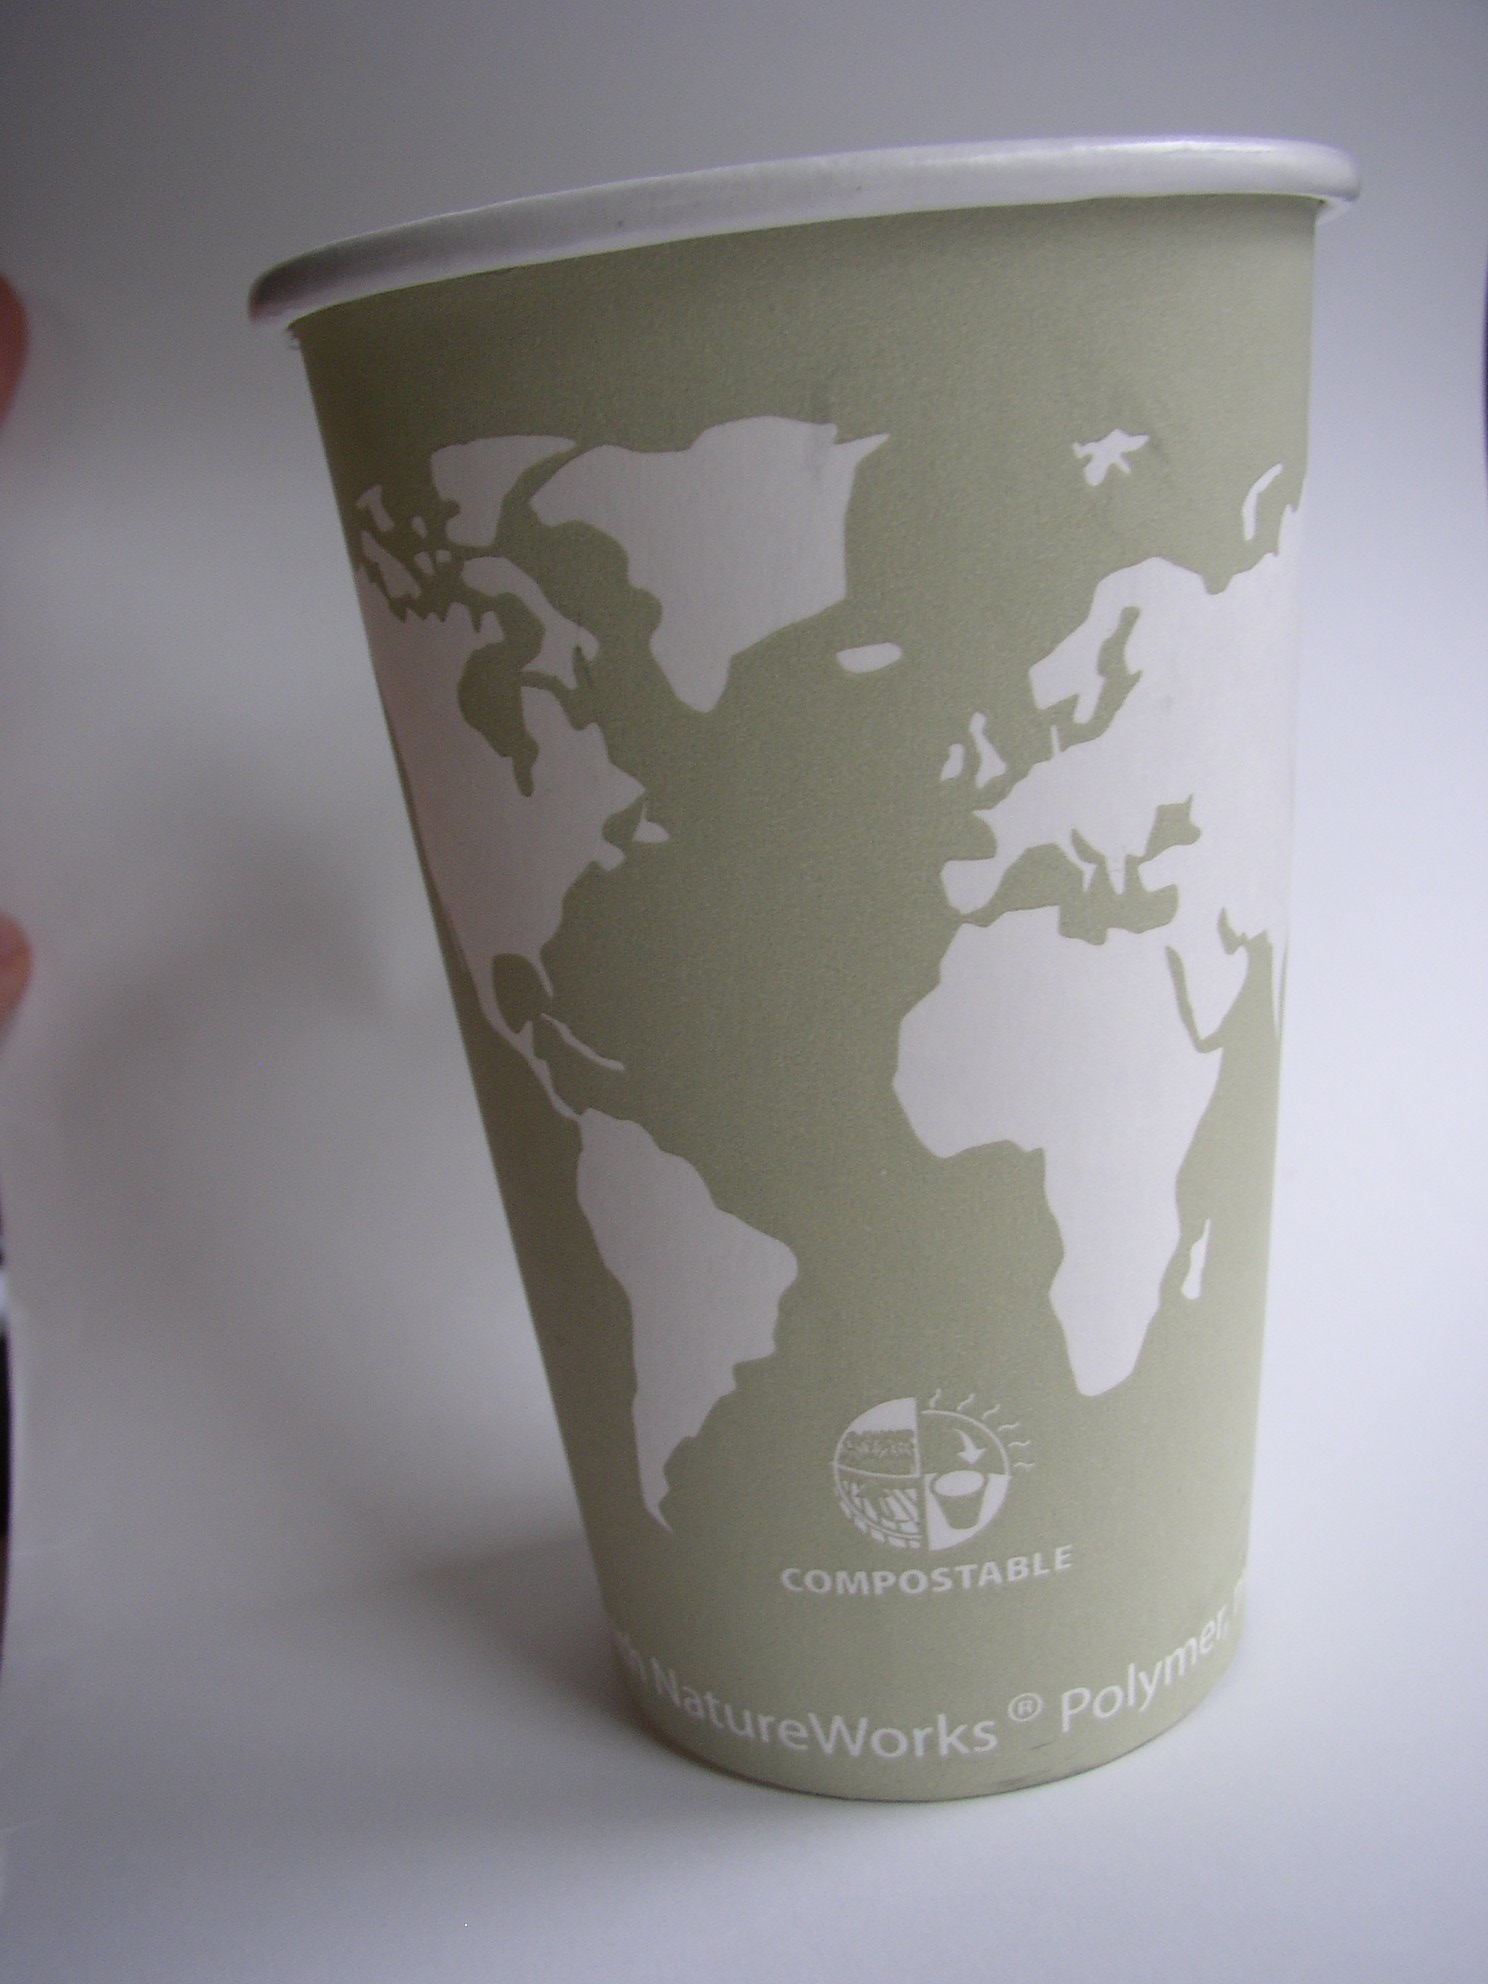
continents outlined on a coffee cupback side of world on coffee cup

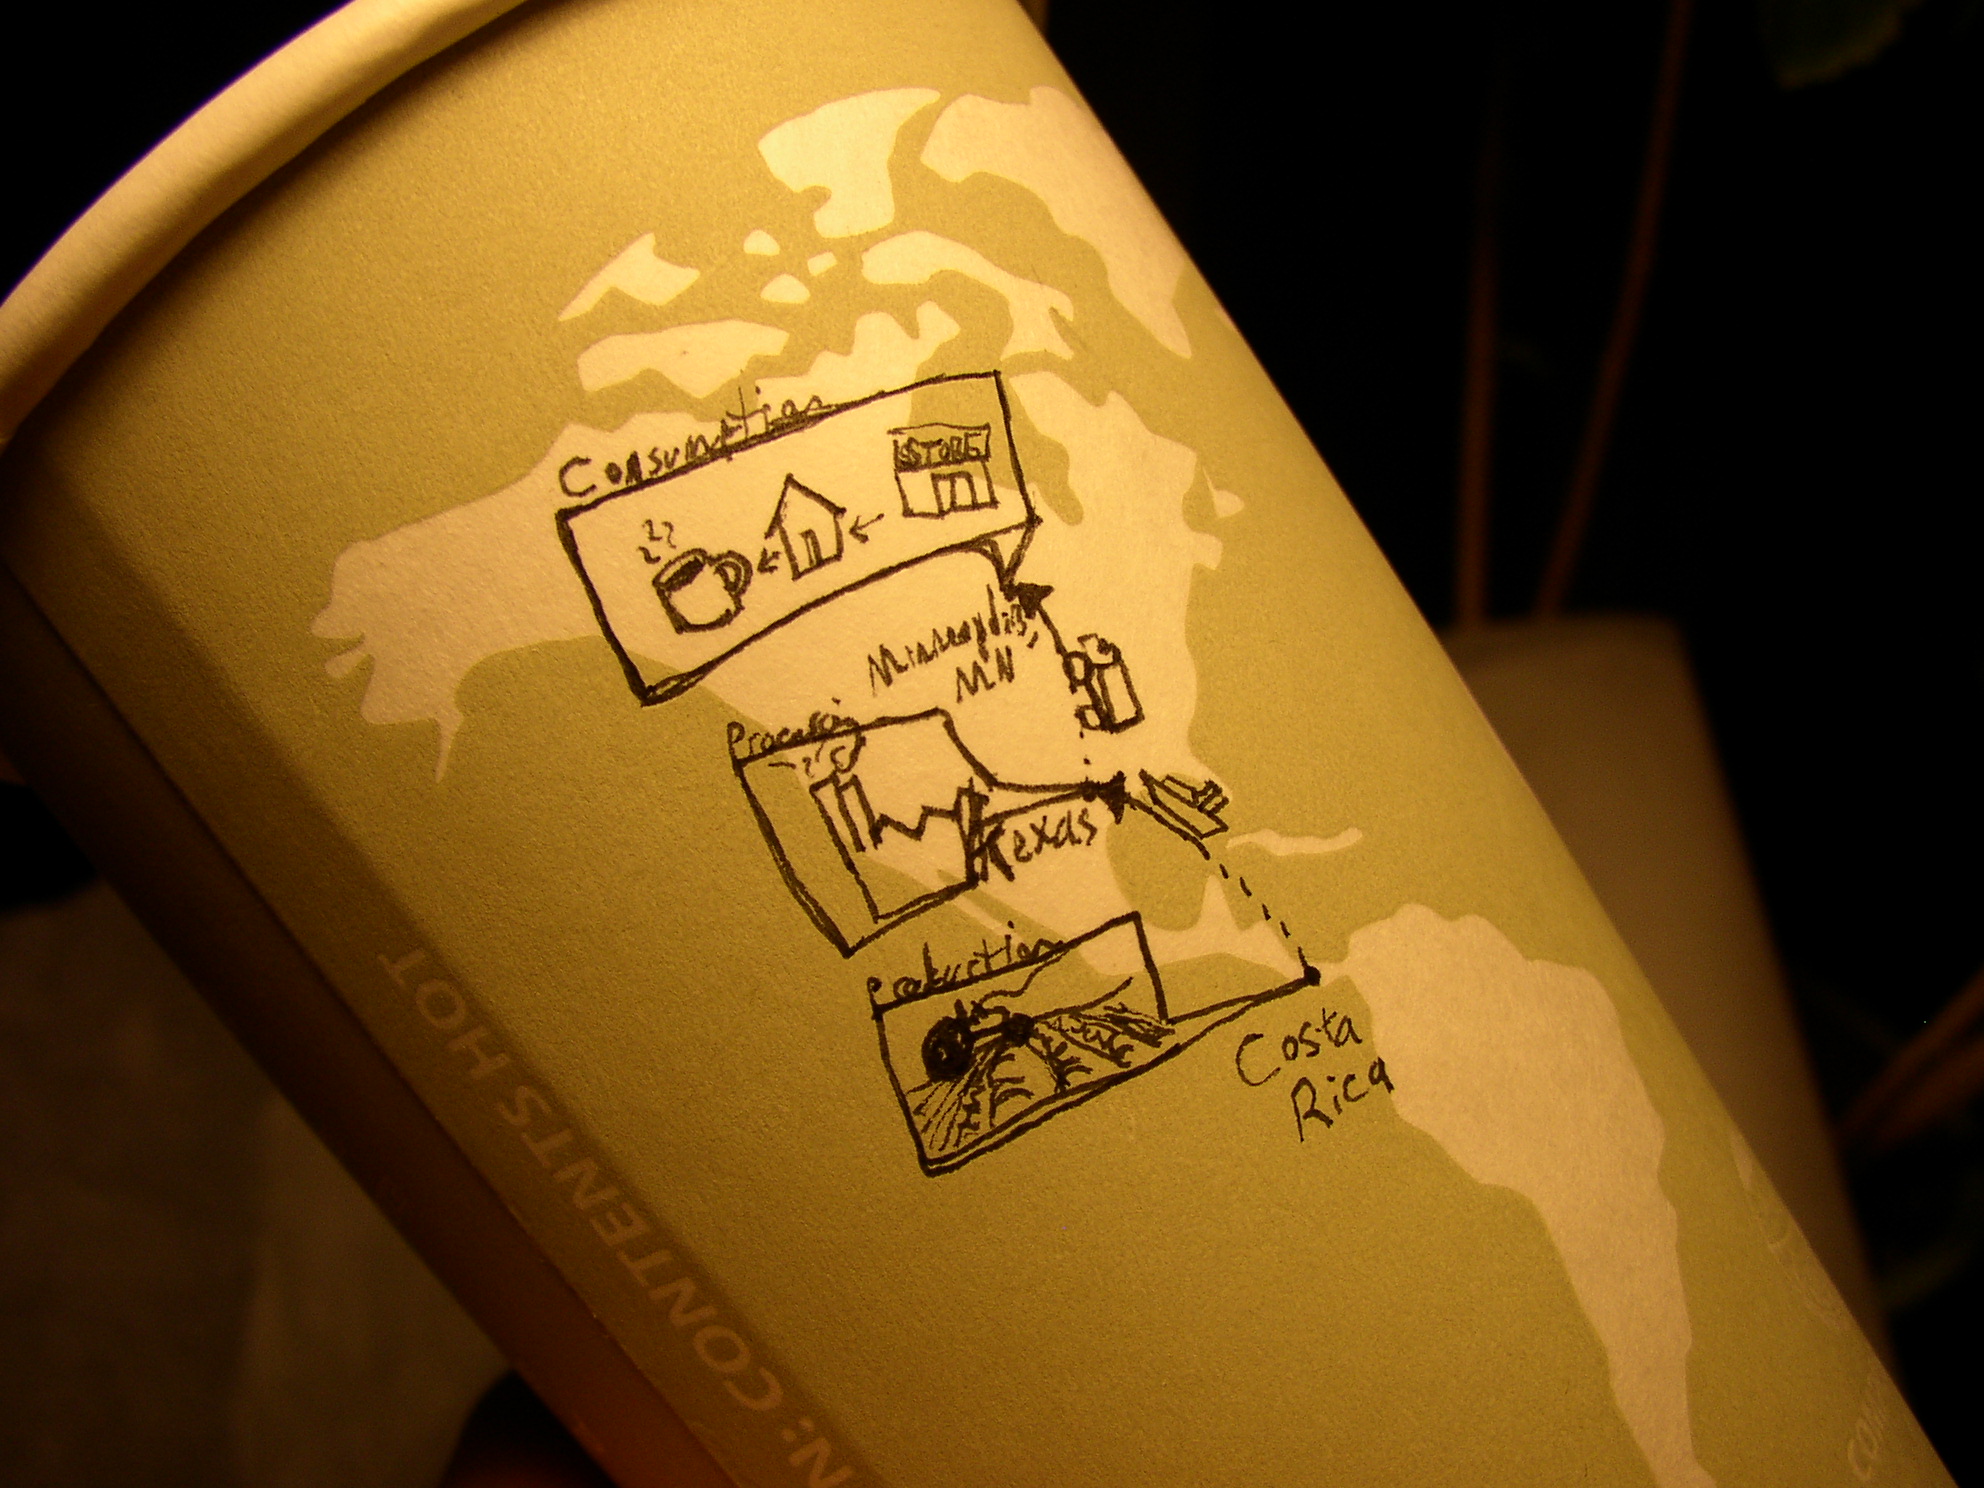
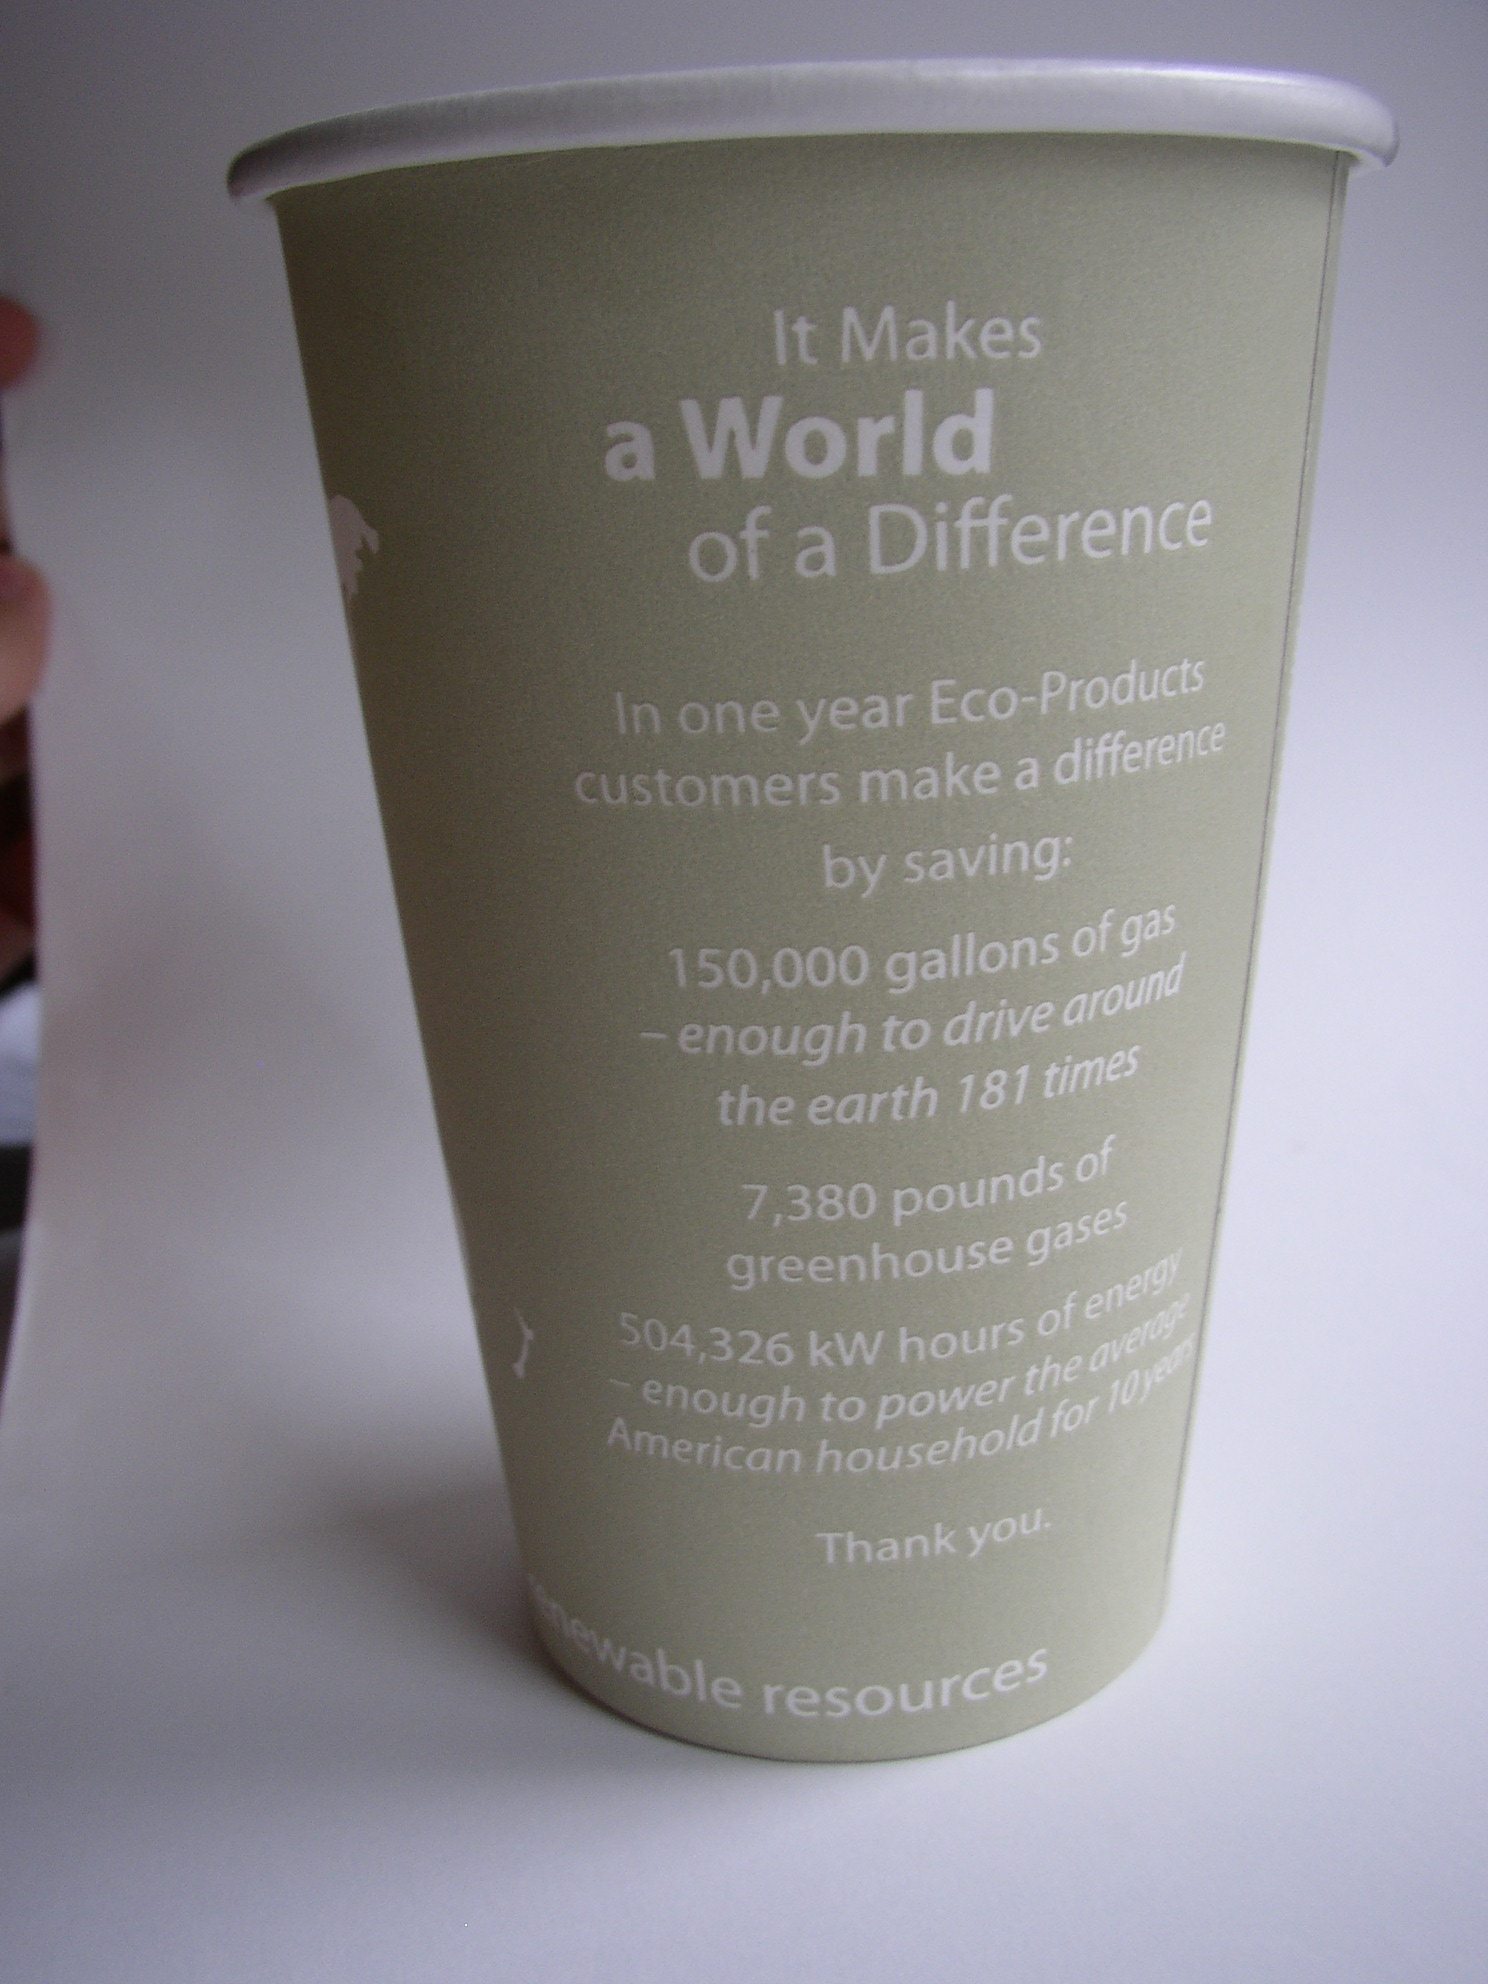
Details on the eco-efficiencies of the company that produced this cup are printed right on it. (Along with an intriguing blank world map: which could lend itself to some sketches to show where the coffee inside came from.)

I’m not sure that many take the time to read the details of eco-efficiencies on the back of the cup- no matter how intriguing they are. However, one thing that really helps is translation from data points into increments that the user can start to comprehend. For example, I’ve no idea what 150,000 gallons of gas means…but by telling me that it’s enough to drive around the earth 181  times, this makes the data more real to me.

By having the ‘world’ on the cup, this could be a unique opportunity to further compare some of the text-based data with the size of the world (for example: how about 181 lines around the cup?, or a sphere to represent what 7,380 pounds of gas would take up [though this may need to be on the scale of a  house rather than to the world])

The ‘compostable’ icon under the continents is a start to some nice information design in itself -though this could have been further simplified, or even tied into some of the text on the cup’s reverse.

Overall, lots of potential, but data is left separate from visuals: even when the visuals are ripe with potential.

Cup by Eco-Products Inc.

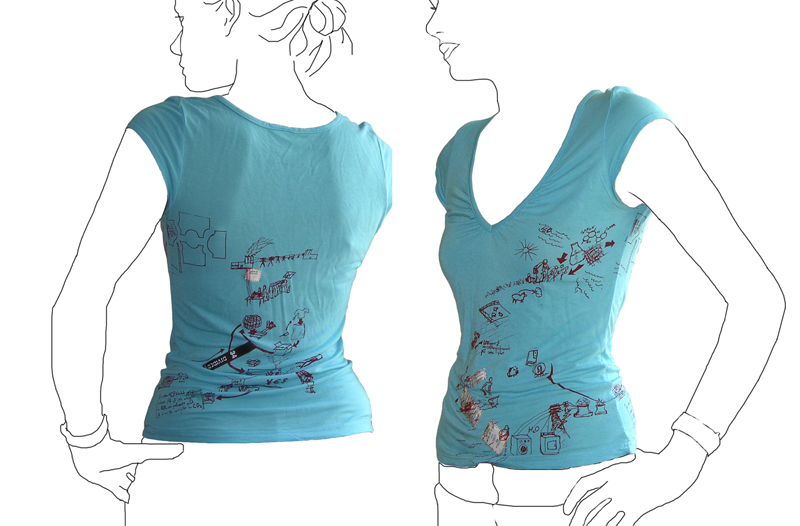
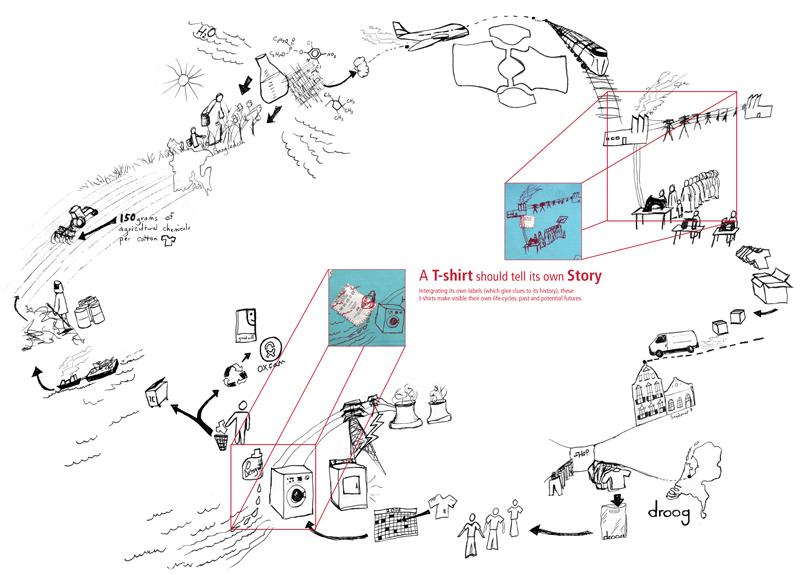
T shirt tells its own life cycle.

Tshirt printed with it\'s own life cycleLife cycle of a T-shirt: Droog Design

This t-shirt tells its own back story: the t-shirt tags are cut from the inside and stitched into the screenprint graphic of an imagined life of the product. The shirt was put into production in 2006 by Droog Design.

This is a more illustrative, conceptual version of a background story – less data based. The graphic is customized based on available information at the time (this includes where the cotton comes from, and where the t-shirt is sold). More quantitative figures on distance and carbon footprint could be input with the right data available.