Tracking water droplets: Playing raincloud.

An exhibit on Water at the Science Museum of Minnesota contains an interactive display that allowed people to ‘become’ a raincloud. By rubbing a ‘raincloud’ tool over a series of screens displaying a topographic map, the cloud rains drops of water onto the topo-map. Visitors can see how the drops of water run down the sides of a topographic map to slow and pool together in the valleys between mountains. Colliding together, the blue drops create rivers which meander through valleys until falling off the screen.
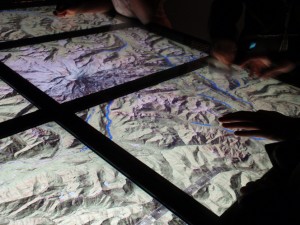
Interactive table created interaction for watersheds

As a fun way for visitors to interact with the exhibit, this project helps people understand how water flows (the fact being downhill- which I thought was obvious, but apparently there is an overwhelming number of people who are surprised when rivers turn to flow North instead of South, as on maps they must have an idea that gravity makes the water flow off the page.)

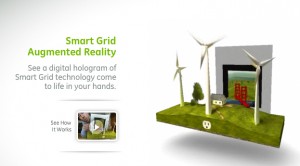
Reality, augmented. […sustainably?]

Merging analog and digital, this new tool allows users to use their webcam to make a simple printed page come to life. In 3 dimensions!
Augmented Reality: a virtually 3-d landscape unfolds via your computer's webcam.
Augmented Reality: a virtually 3-d landscape unfolds via your computer

An incredible display of technology, it’s not hard to imagine the communication possibilities for sustainability, communicating the background stories of products…or anything for that matter. However it’s not immediately clear how this technique is as exclusive to the future of sustainable communications as it would have us believe (the tool is introduced from within GE’s micro site promoting sustainable technologies like the smart grid and smart power meters). Though a extremely promising tool, a slight scent of greenwash clouds the air.
Watch the video, as presented by Adobe CTO, then try it for yourself.

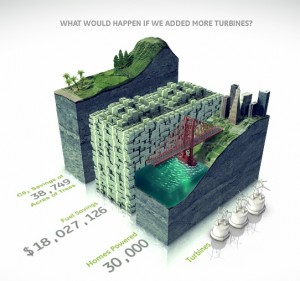
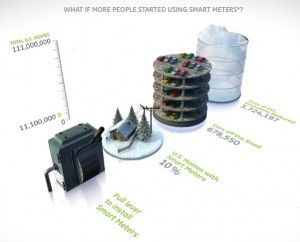
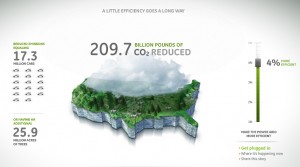
On the topic of eco-magination, there are some wonderfully communicative info-graphics throughout the micro site. However, overall the site is excessively flashy: lots of pretty pictures…but not much overall content.  It seems to have been created as a playground for cutting-edge graphics more than to support sustainability. (Though, one could argue that’s GE’s intent…) More easily accessible information to back up the claims that GE wants to communicate through such elaborate – and interactive- visuals would lend significantly more credibility to this site.
bar graphs bring information to life with visual virtual worlds
Bar graphs bring information to life with visual virtual worlds

Environmental and financial savings stack up in a bar graph.
GE infographic - Mapping CO2 Emissions

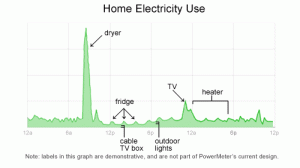
Home energy usage via Google

Google is in the development stages of a power meter that enables users to monitor real-time feedback on their household energy consumption. This kind of instantaneous feedback gets to the basic premise of why it’s important to show & tell background stories. This power meter is tool that enables the customer to make their own choices: in this case, the customer can make the connection between more energy usages= more $.

Google's plan to meter home energy consumption
Google's plan to meter home energy consumption.

Follow google’s developments on www.google.org/powermeter.

Perhaps this precision monitoring of the background of products also paves the way for technologies enabling people to generate their own power – and sell it back to utilities.