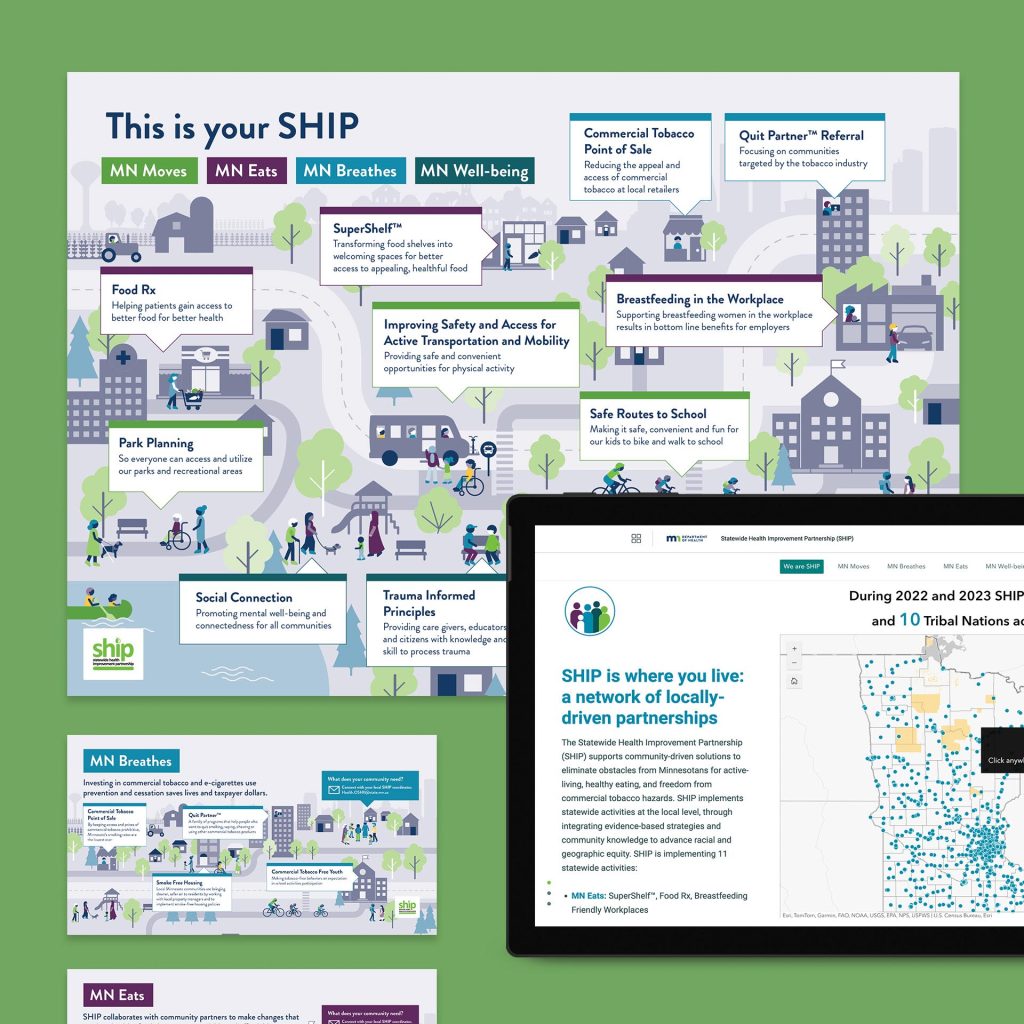
Showing how investment leads to measurable community benefits
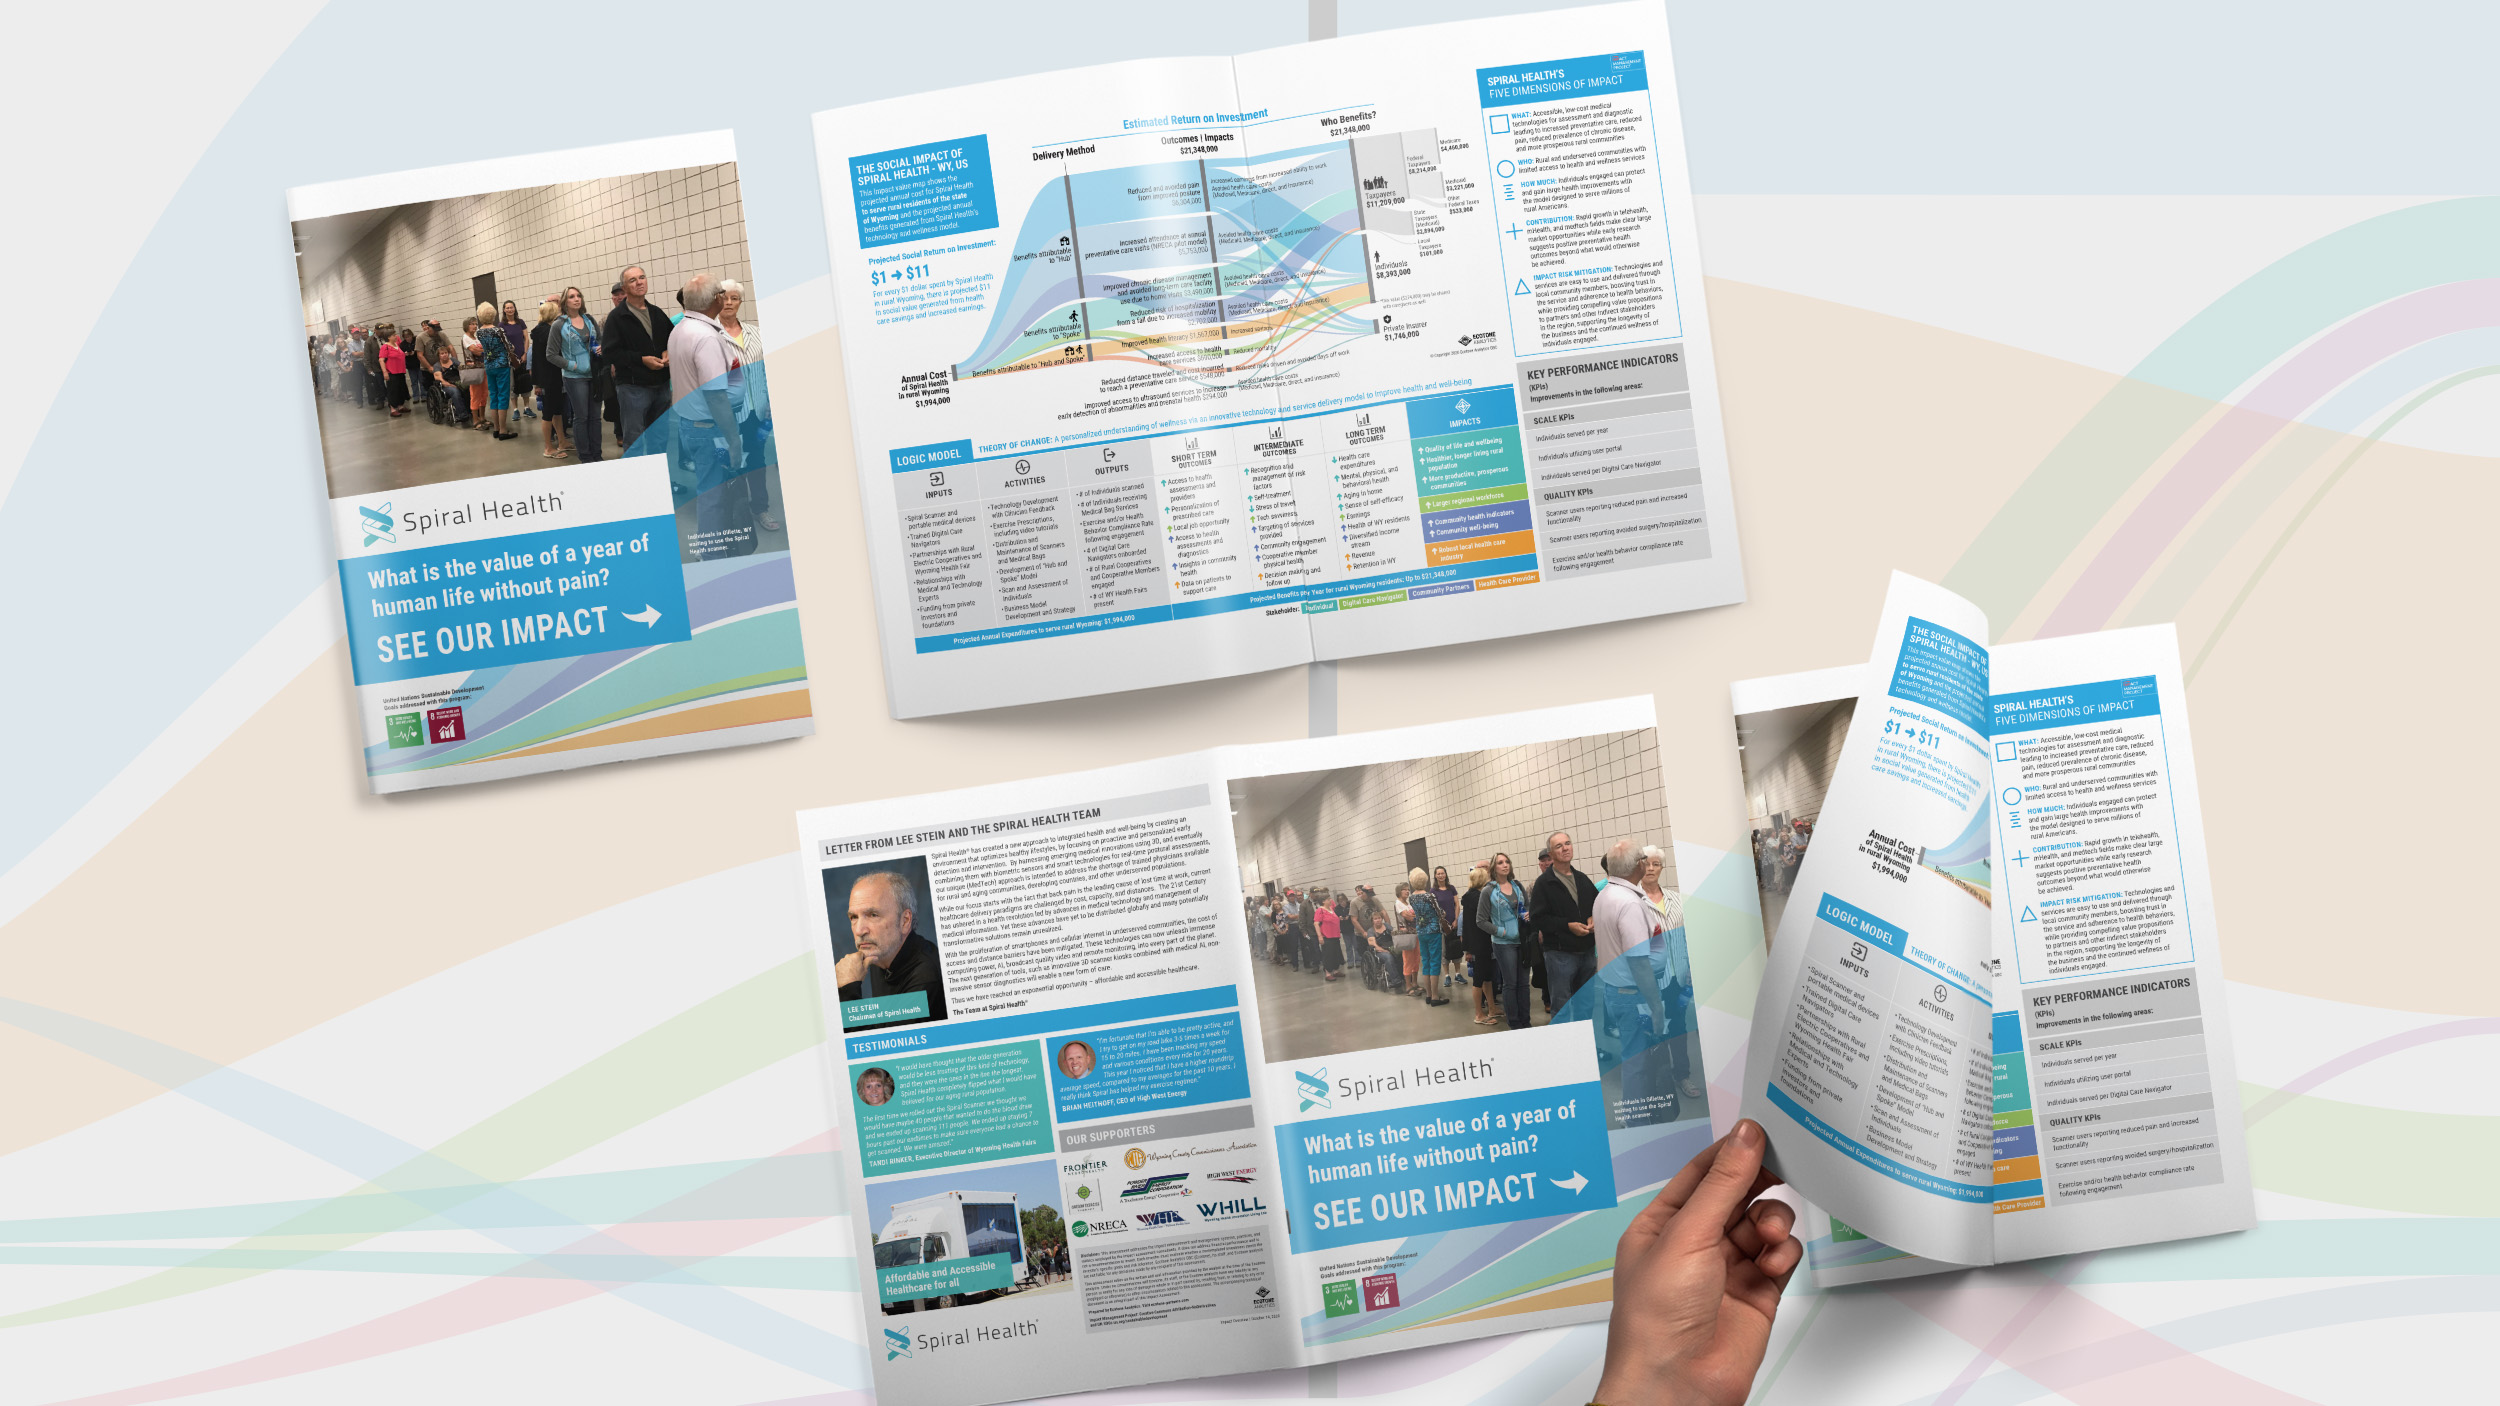
We’ve helped multiple organizations communicate their impacts with our partners at Ecotone Analytics. Each custom data visualization shows how initial investment dollars grow into a Social Return on Investment, benefiting program participants, their families, and institutions, as well as state, local, and federal governments.
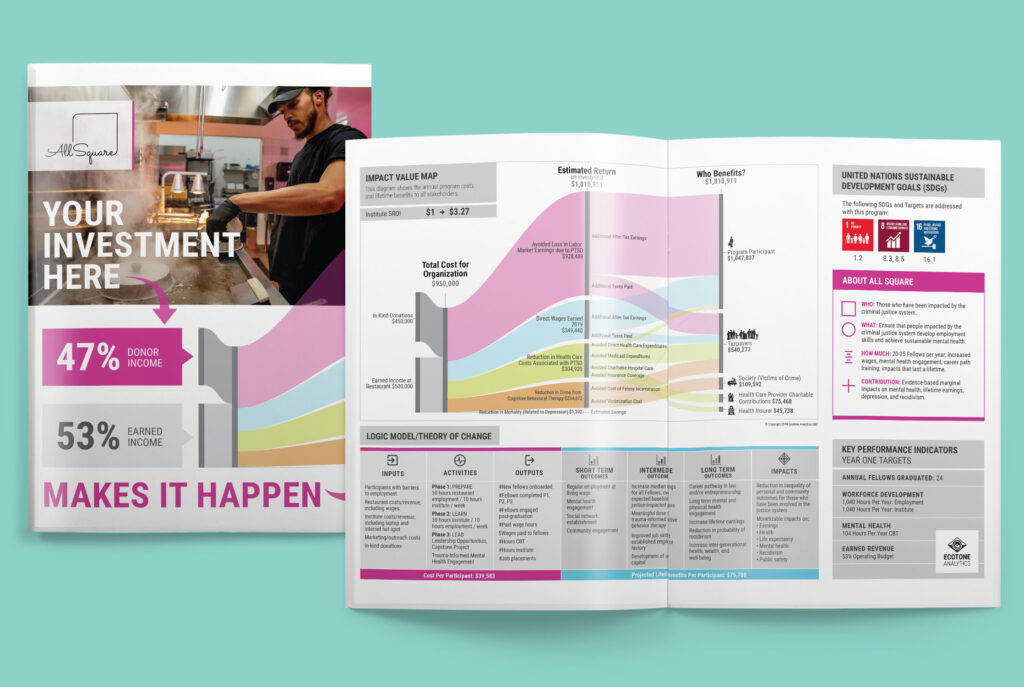
The reports visualize social return on investment, helping investors understand how each dollar is used to its fullest potential.
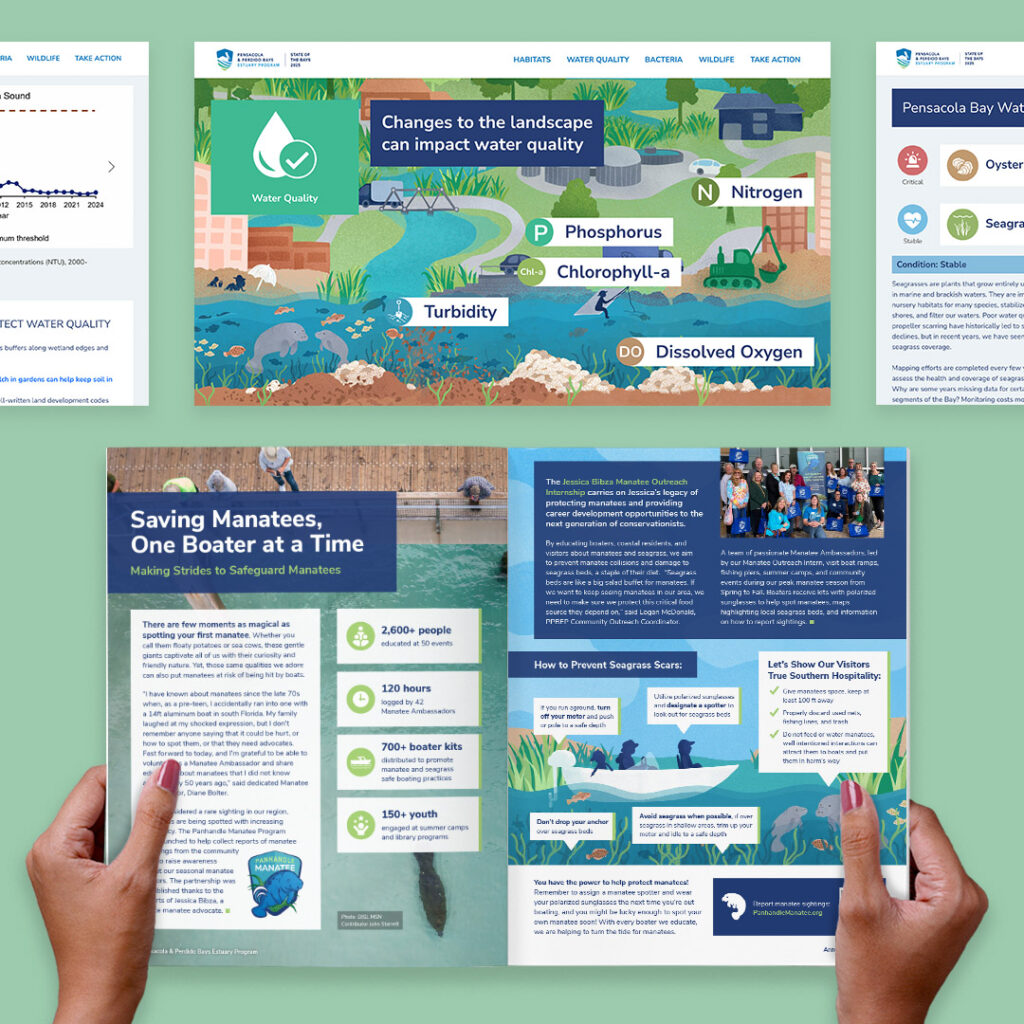
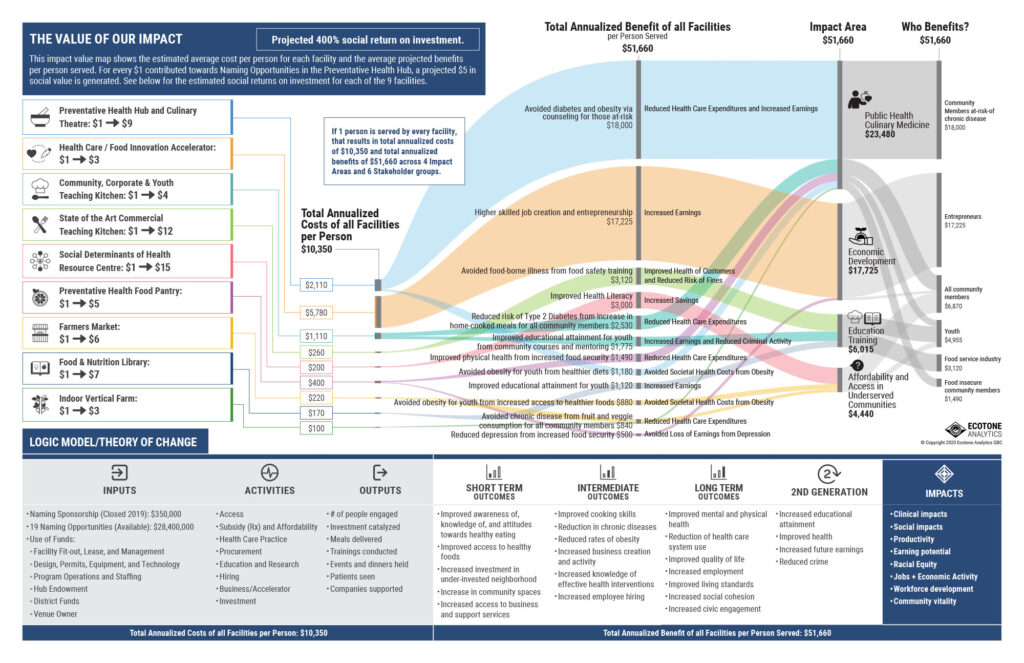
Colors and icons form a visual language that helps the audience absorb complex information
Color coding shows which programs and stakeholders benefit from funding, helping investors understand how their support makes a difference in many areas of the community.
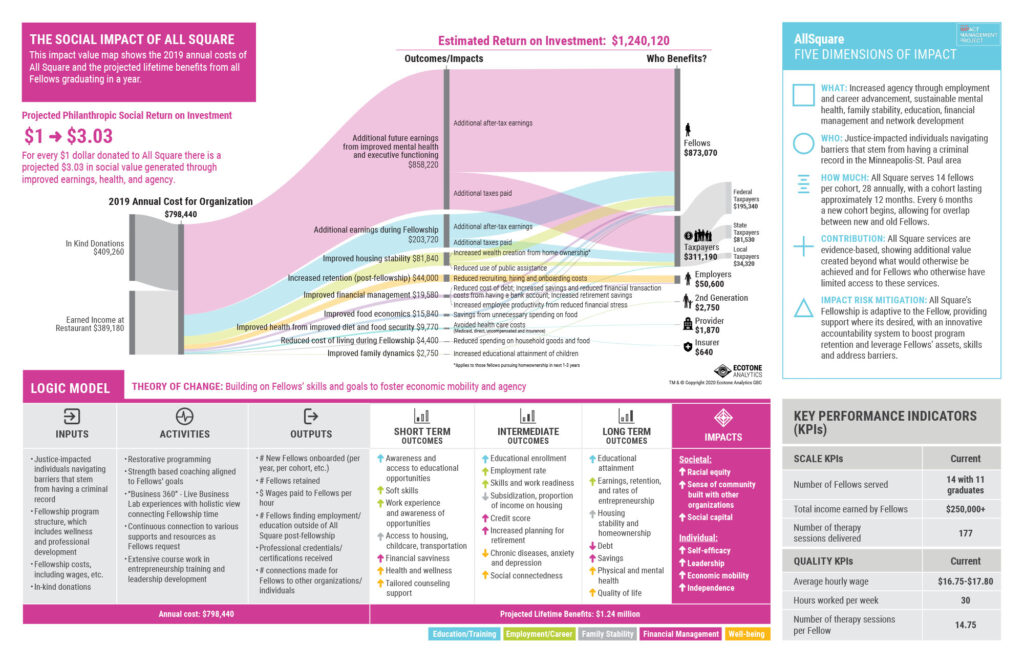

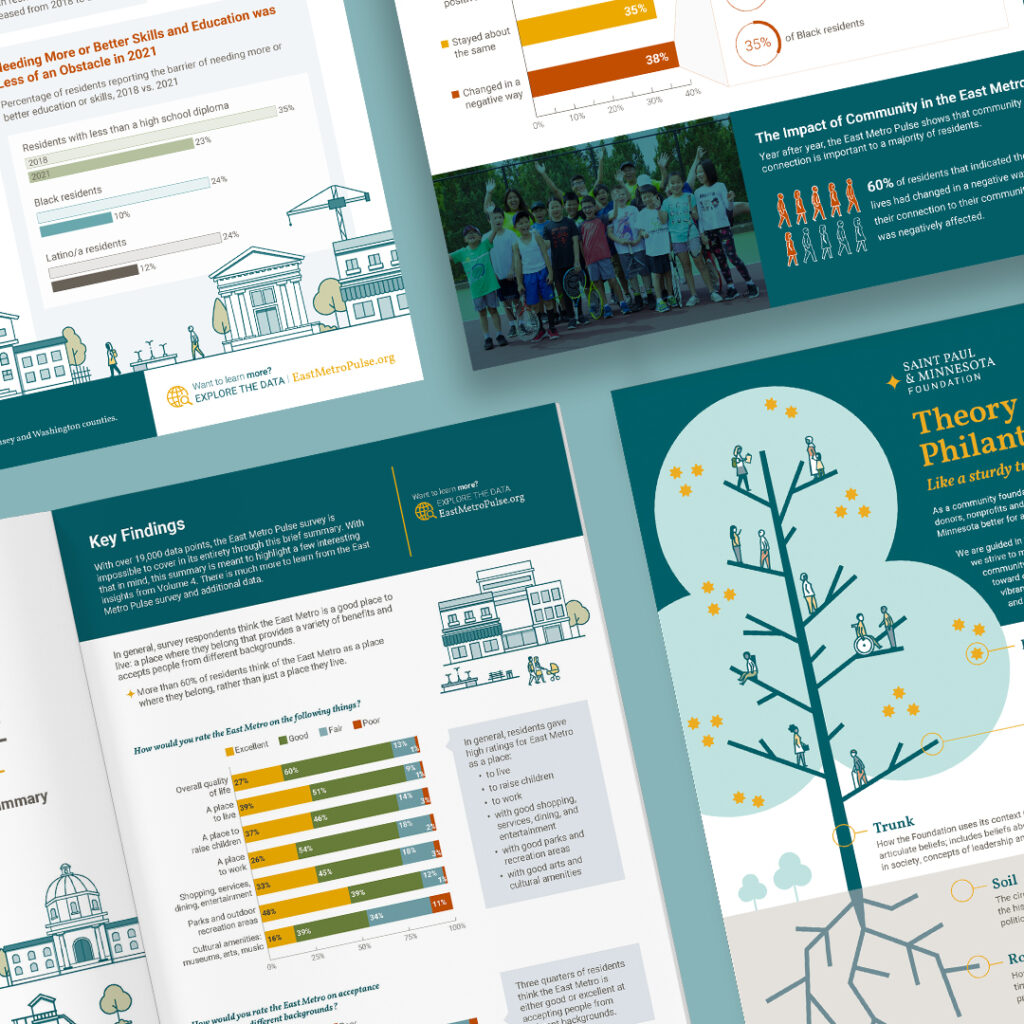
A story designed for the audience’s level of knowledge
Just like Social Return on Investment, Theories of Change are complicated. These visualizations take advantage of the audience’s pre-existing knowledge, providing a clear story and allowing them to dig into details where desired.