Featured insight from our team

Telling stories with “comparison” data
The right narrative and visual framework will help the audience understand and connect with the data, leading to behavior change.
Featured presentation
Using visual language to tell sustainability stories
“Sustainability visualized: Arlene Birt at TEDxFulbright”
Featured research
Topic: Personal stories as powerful persuasion tools
“Personal experiences bridge moral and political divides better than facts” by Kubin, E. et al.
Recommended research articles
Topic: How visual stories shape messages
“Visualization rhetoric: Framing effects in narrative visualization” by Hullman, J. and Diakopoulos, N.
Topic: Photography in climate comms
“Climate visuals: A mixed methods investigation of public perceptions of climate images in three countries” by Chapman, D. et al.
Topic: Embracing emotion in science communication
“Engaging people on climate change: The role of emotional responses” by Wong-Parodia, G. and Feygina, I.
More insights from our team
Creating accessible design
Design doesn’t work unless it works for everyone Audience is a key ingredient in our design process, and no audience …
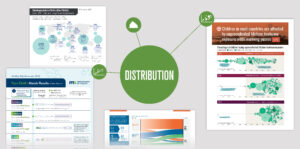
Telling stories with “distributed” data
How we convey the meaning behind the numbers This is our third exploration of how to frame your data. In …
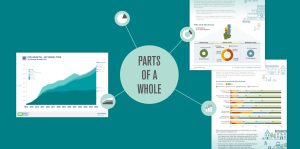
Telling stories with “parts of a whole” data
We’re continuing our exploration of how to frame your data. In our previous post, we discussed the story behind comparison data: …
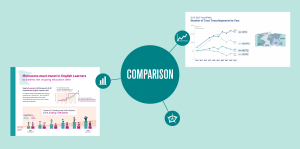
Telling stories with “comparison” data
When exciting data is released, it’s tempting to share the numbers directly with your audience. But there are two challenges …
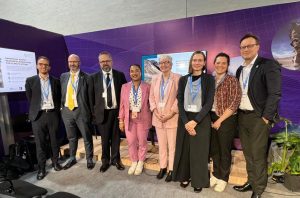
COP29 Presentation – Communicating Science
At the climate change conference COP29 this fall, I presented to an audience of hydrologists and weather-forecasting scientists. Speaking during …
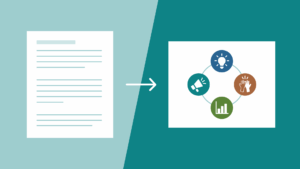
You’ve finished your Theory of Change – what’s next?
Visual storytelling is an effective tool to help audiences understand your organization. Jump-start the process of sharing your new model …
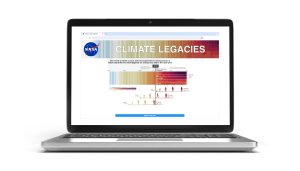
Create your own climate generation visual
Map your family’s climate legacy We’re excited that a UN Intergovernmental IPCC figure designed by our creative director has been …
Happy 2024!
Looking back at 2023, we’re really proud of the work we’ve done — thanks to our amazing partners. Read more about …
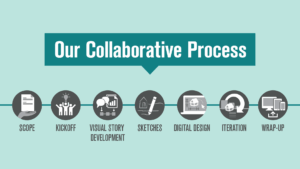
The path to a successful visual story
Whether developing an infographic, printed sign, or animated video, we approach every project with a time-tested collaborative process …
The future of the creative process is increased collaboration
Our founder/creative director shares key lessons from collaborating with more than 60 scientists for Intergovernmental Panel on Climate Change …
Get communication insights in your inbox
Sign up for our quarterly email newsletter.