
National Institute for Reproductive Health (NIRH)
Illustrating the Reproductive Freedom Landscape
TOOLS TO ANALYZE & ADVANCE ACCESS TO REPRODUCTIVE HEALTHCARE
An interactive microsite makes extensive data sets digestible and engaging.
We designed an interactive scorecard tool & microsite for NIRH’s 2023 Local Reproductive Freedom Index (LRFI).
The interactive scorecard tool embedded within the microsite allows users to analyze & compare reproductive freedom indicators across 50 cities in the United States.
The microsite provides concrete suggestions for funding, initiatives, & policies that localities can put in place to move toward the NIRH Model City framework.
Our Work Includes: INFOGRAPHICS, WIREFRAMING, INTERACTION
PROJECT IMPACT
This interactive tool generates resources for advocates & local leaders to use to protect & advance reproductive freedom in their communities.
Our Partner:
This Organization's Focus:


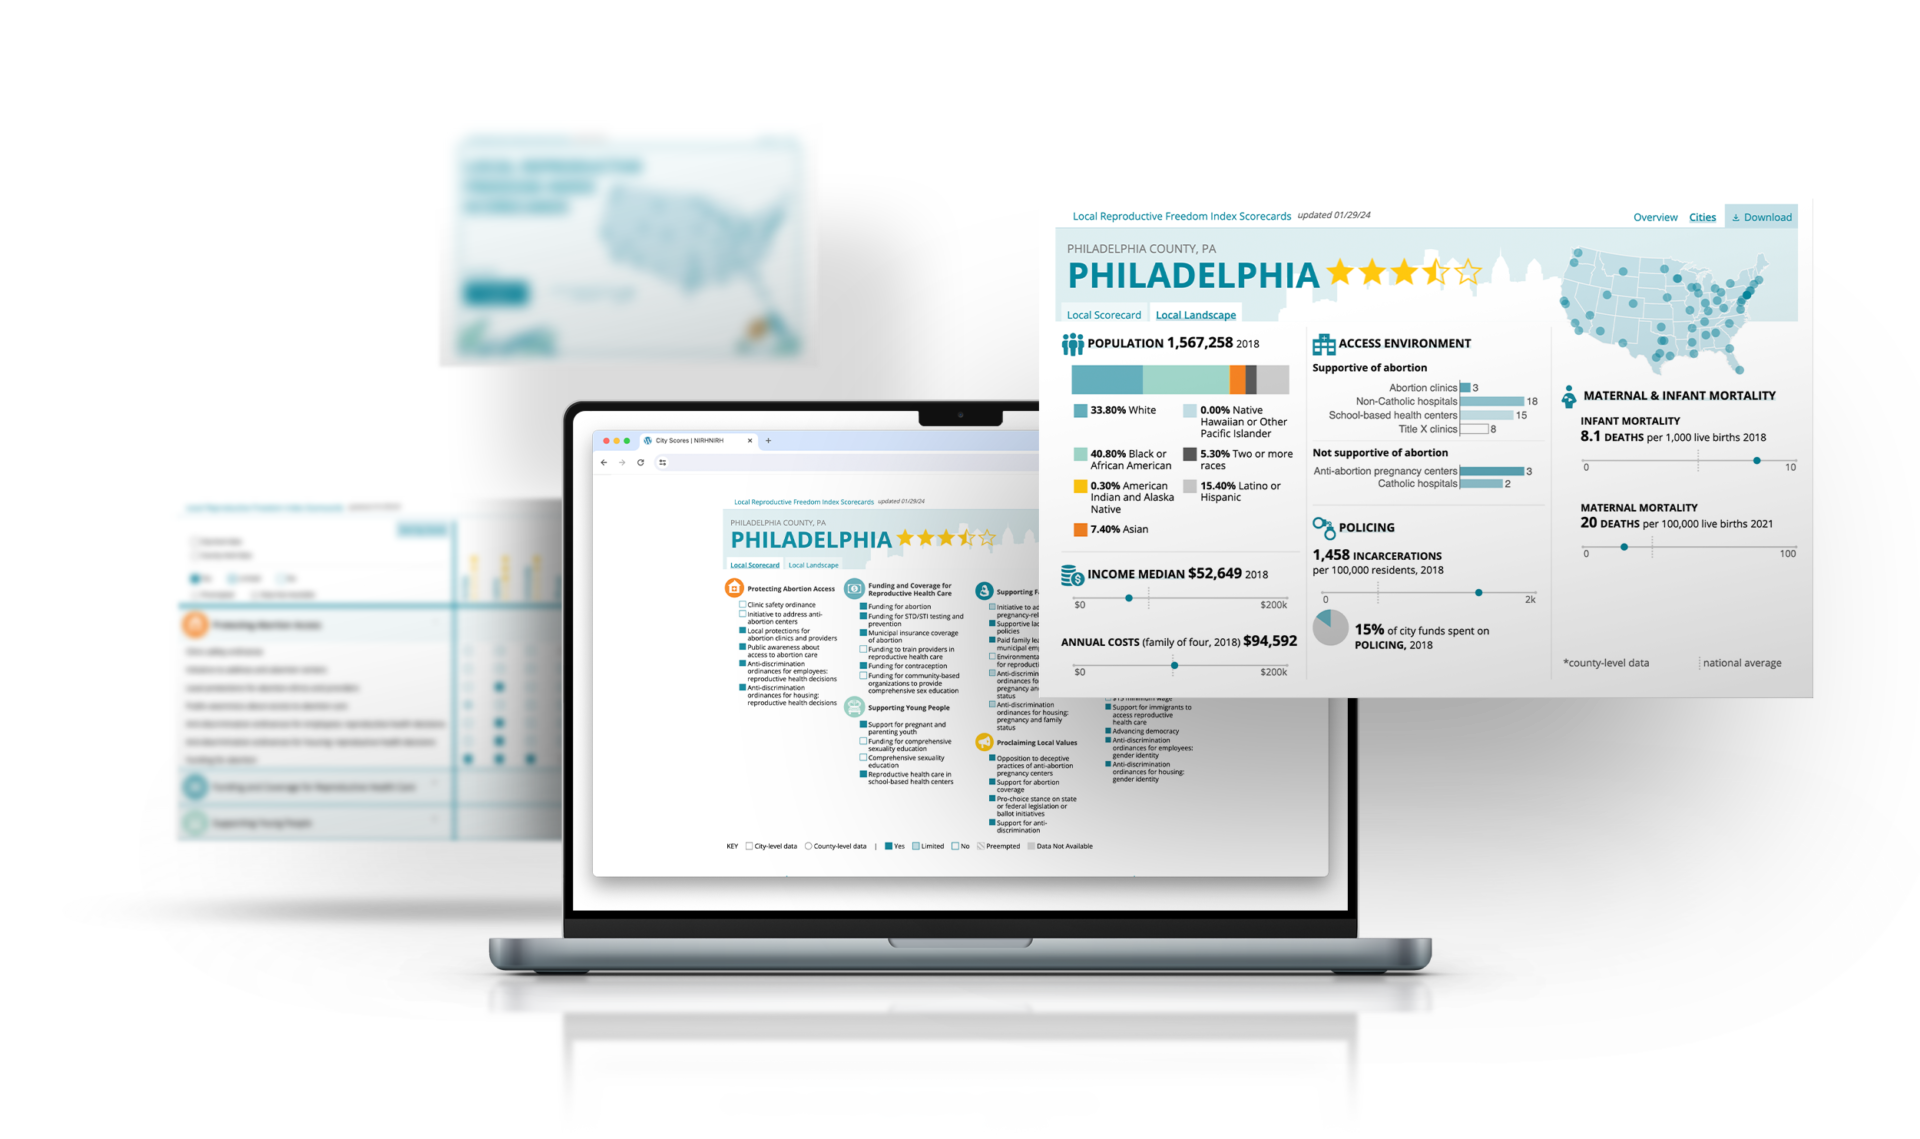
The updatable tool makes data accessible and engaging for advocates, local leaders, and the general public.
![]()
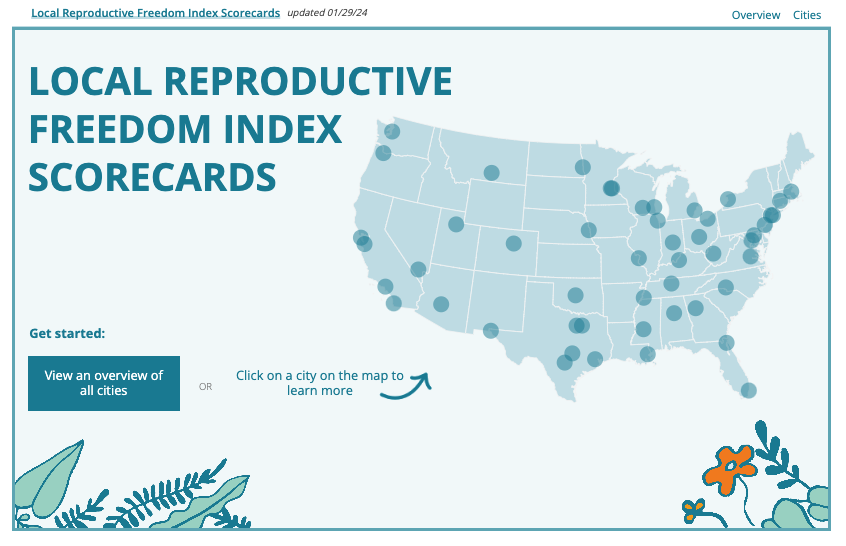
Users can navigate between cities using an interactive map or dropdown menu.
![]()
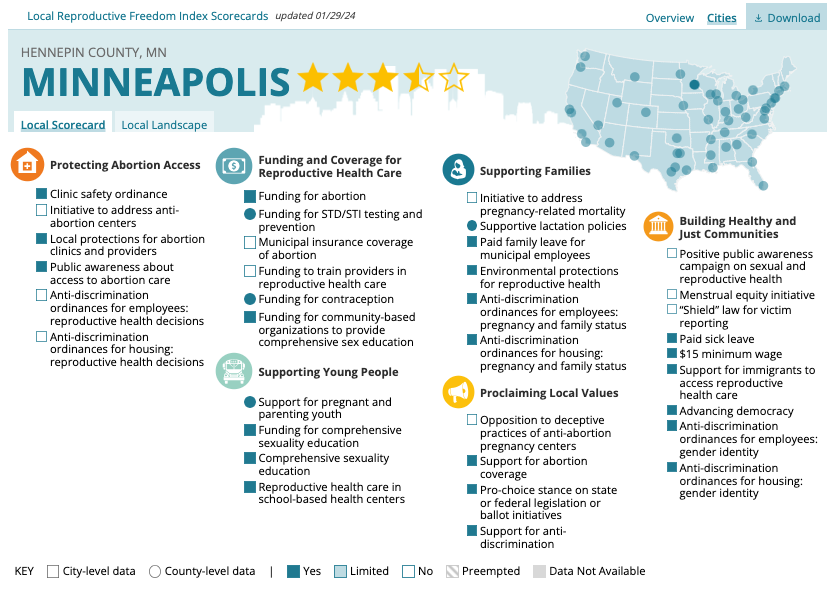
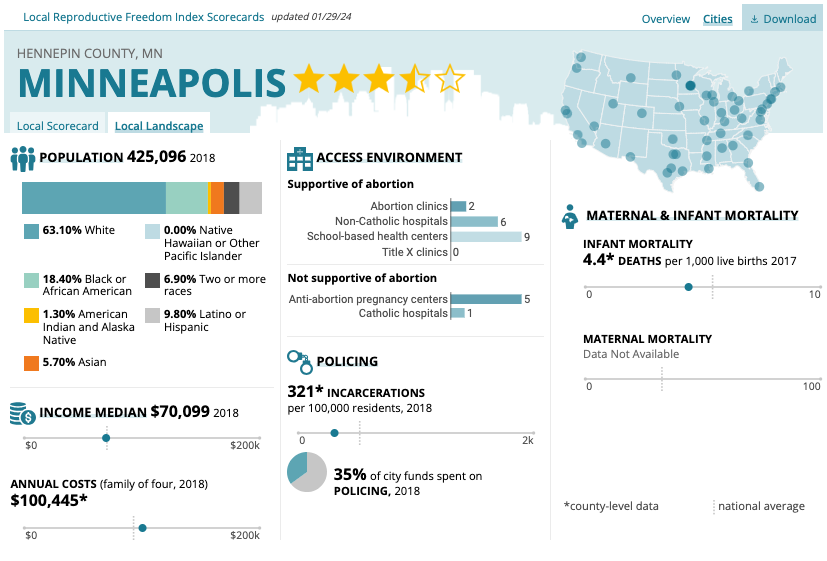
Individual scorecards are printable and provide advocates with a useful one-pager to provide local policymakers to pinpoint areas to advance reproductive freedom.
![]()
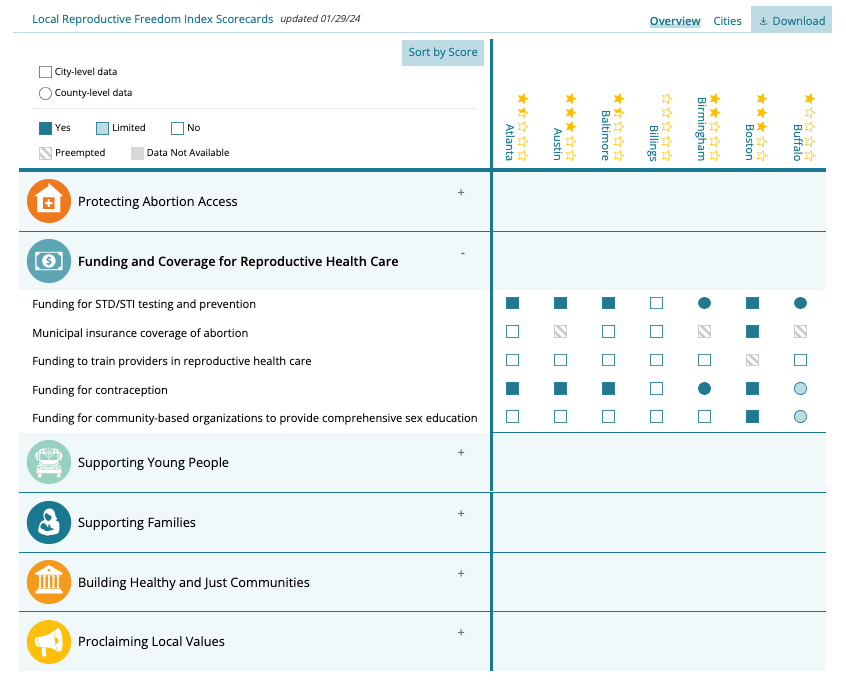
The overview allows users to compare and sort cities alphabetically and by overall score.
![]()
Visualized key data points provide a snapshot of the Local Landscape of each city in a way viewers can see at a glance.
![]()
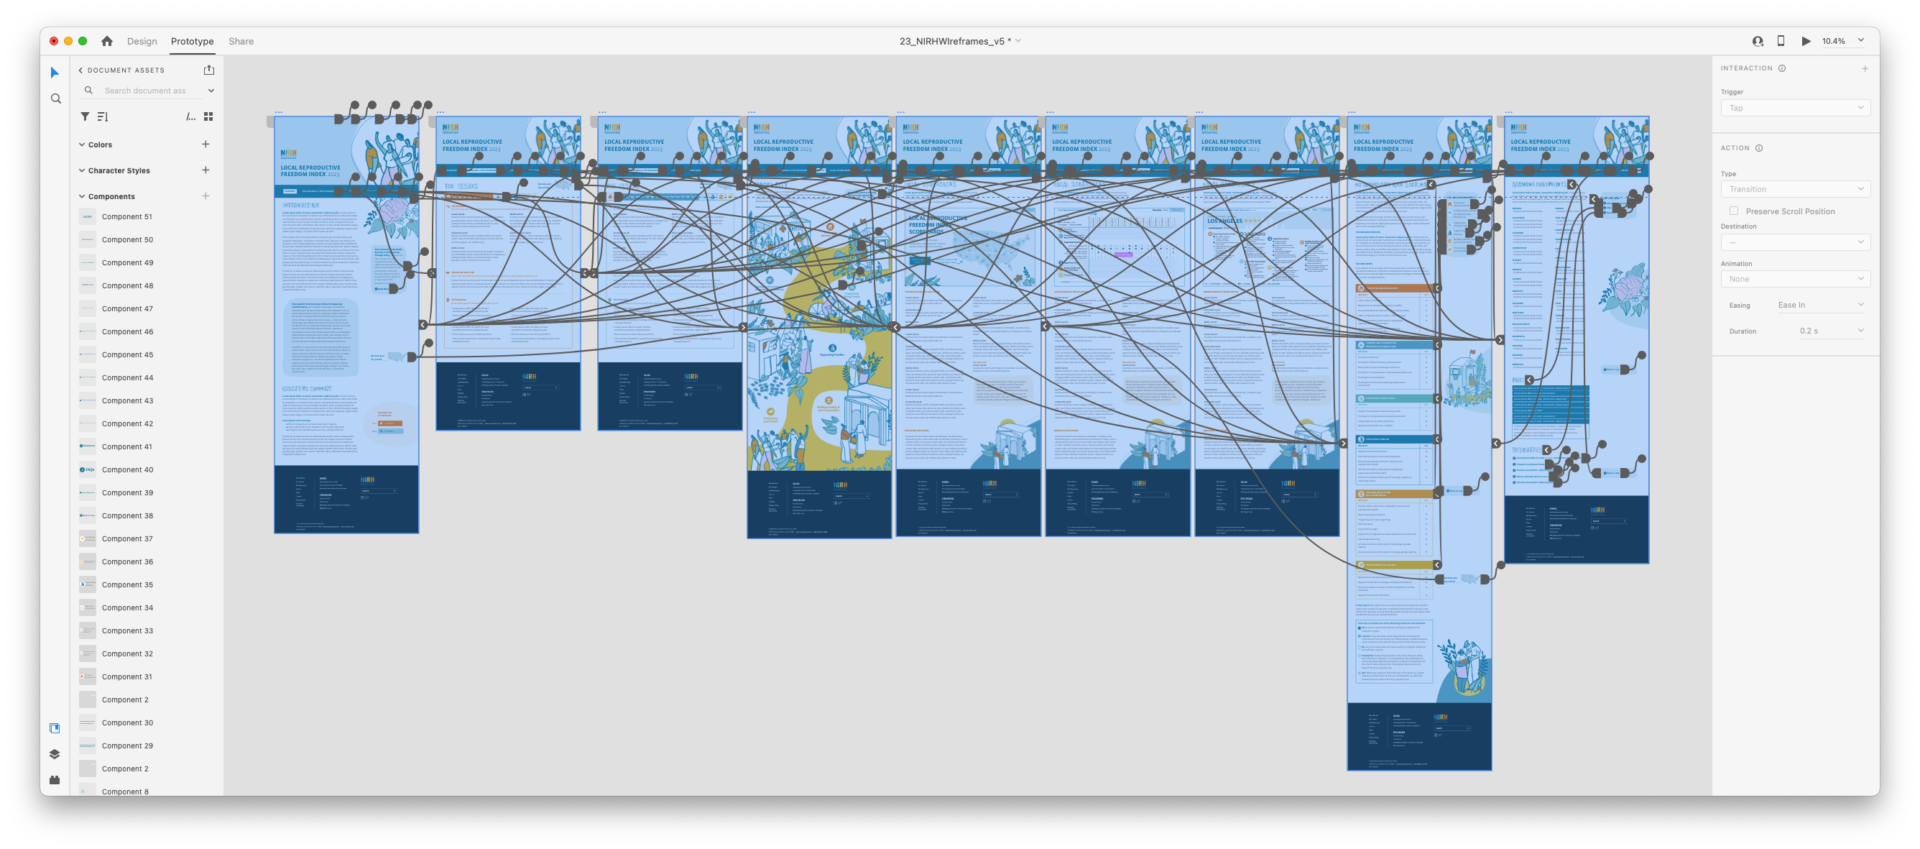
Using Adobe XD, we created a fully clickable prototype to communicate our ideas with the client and website developer.