
Ecotone Analytics
Demonstrating Social Return on Investment (SROI)
show the value of your impact
Infographics that make social value more visible
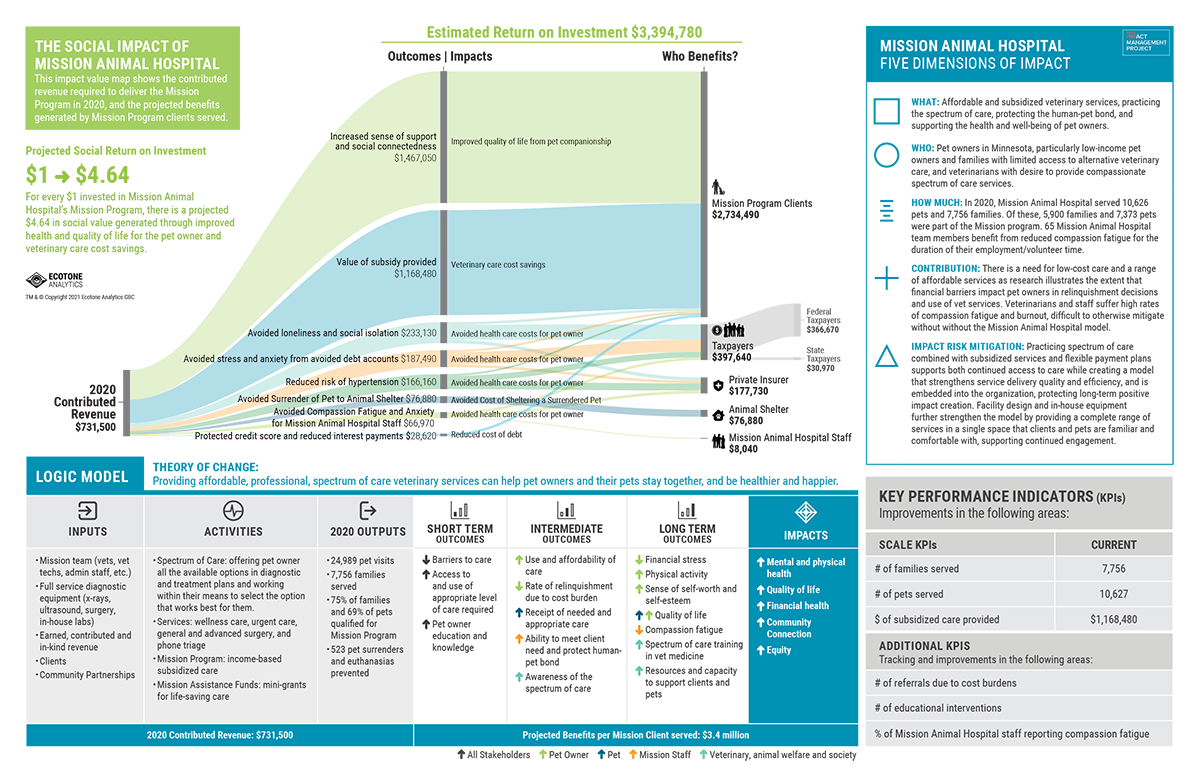
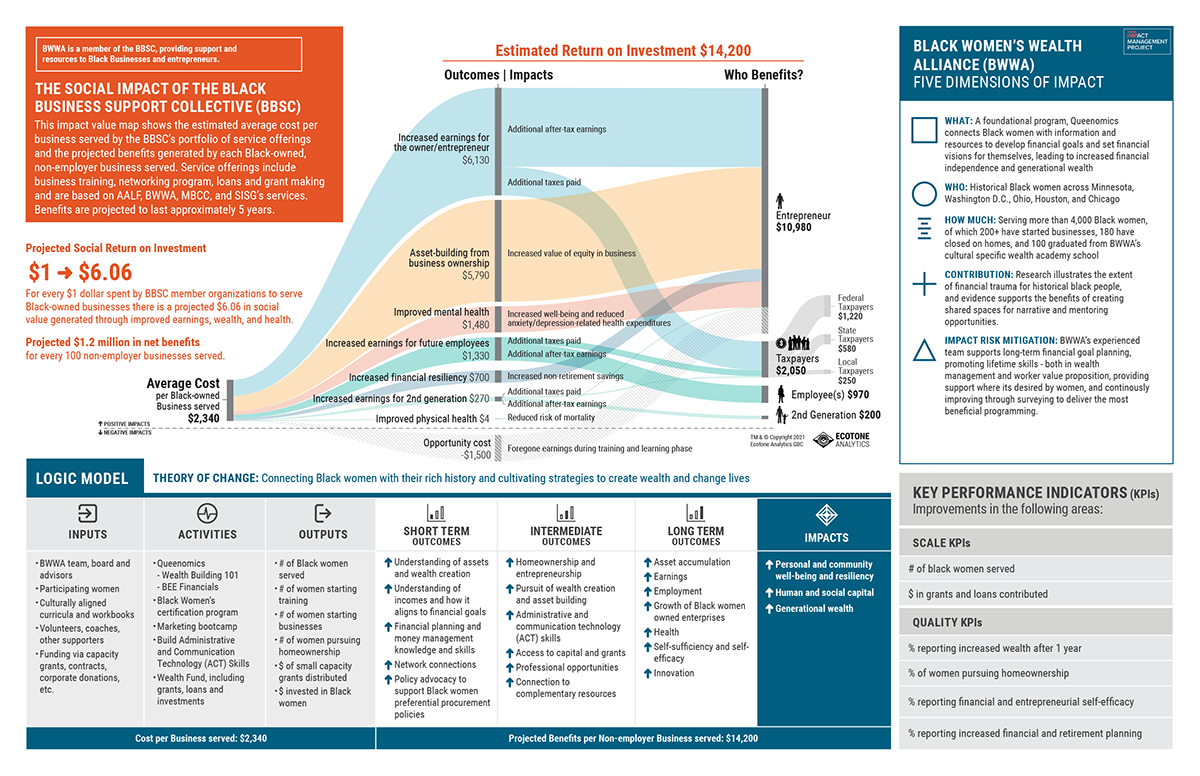
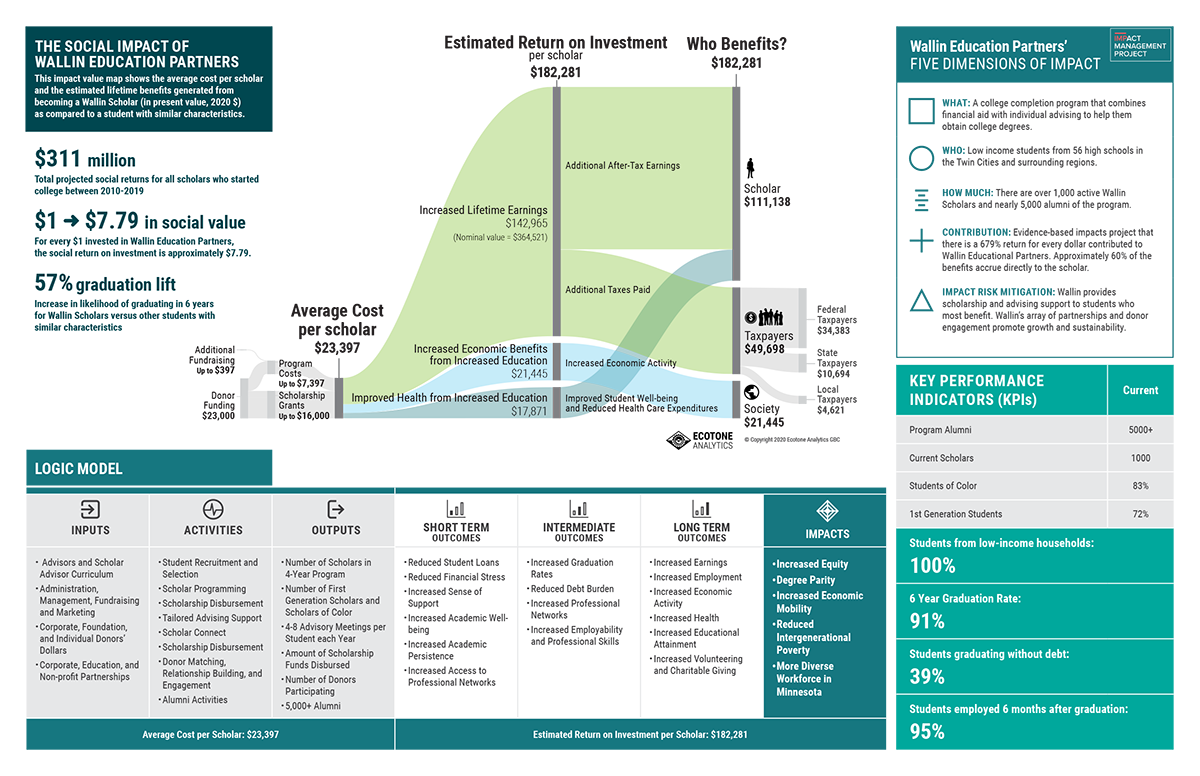
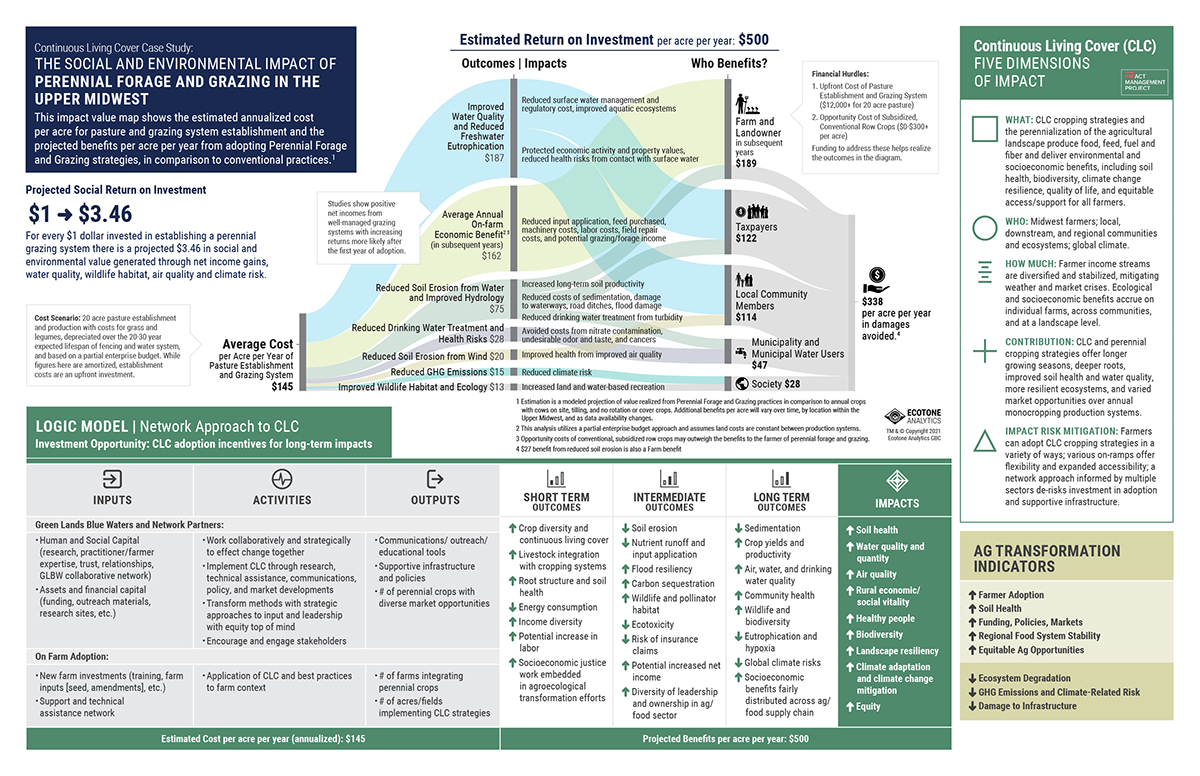
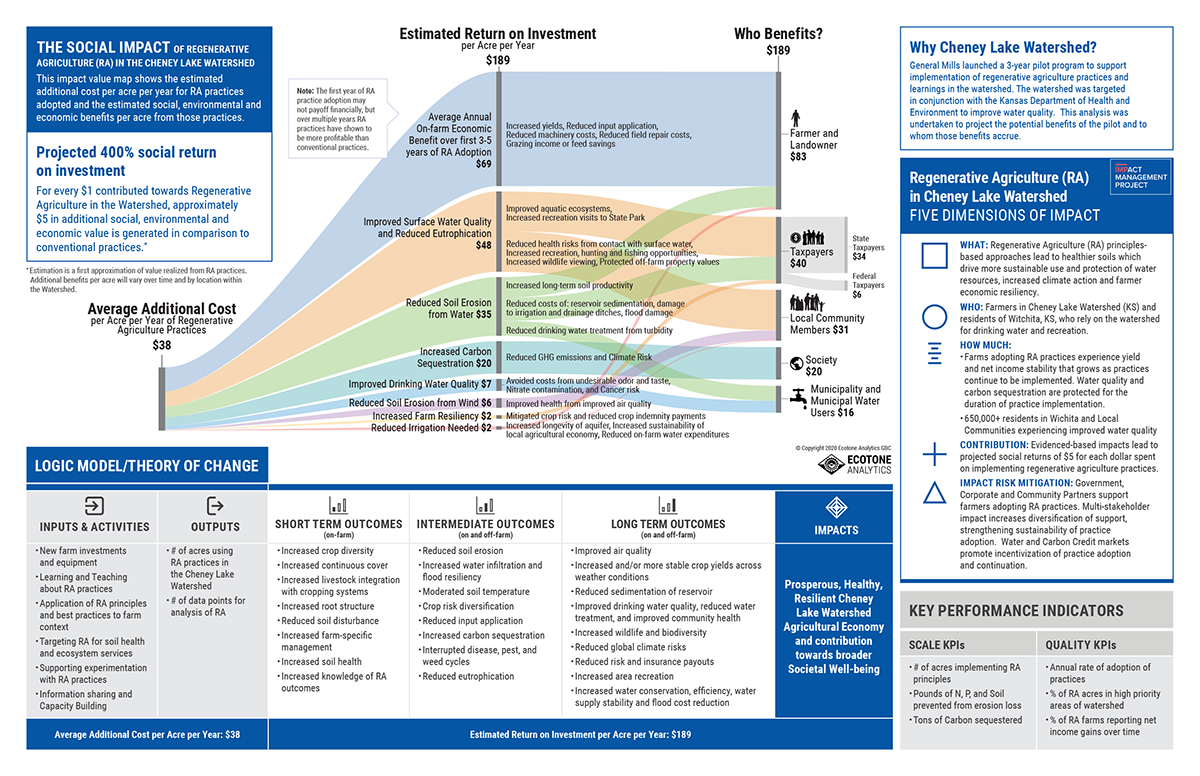
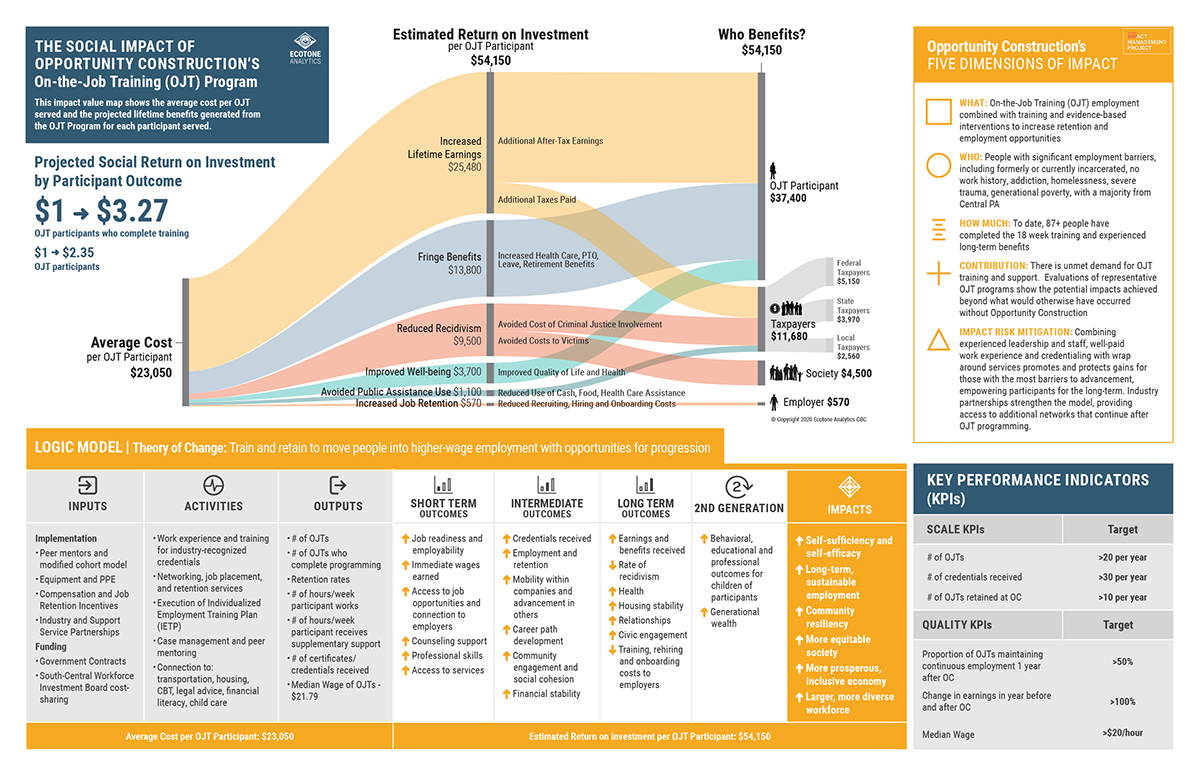
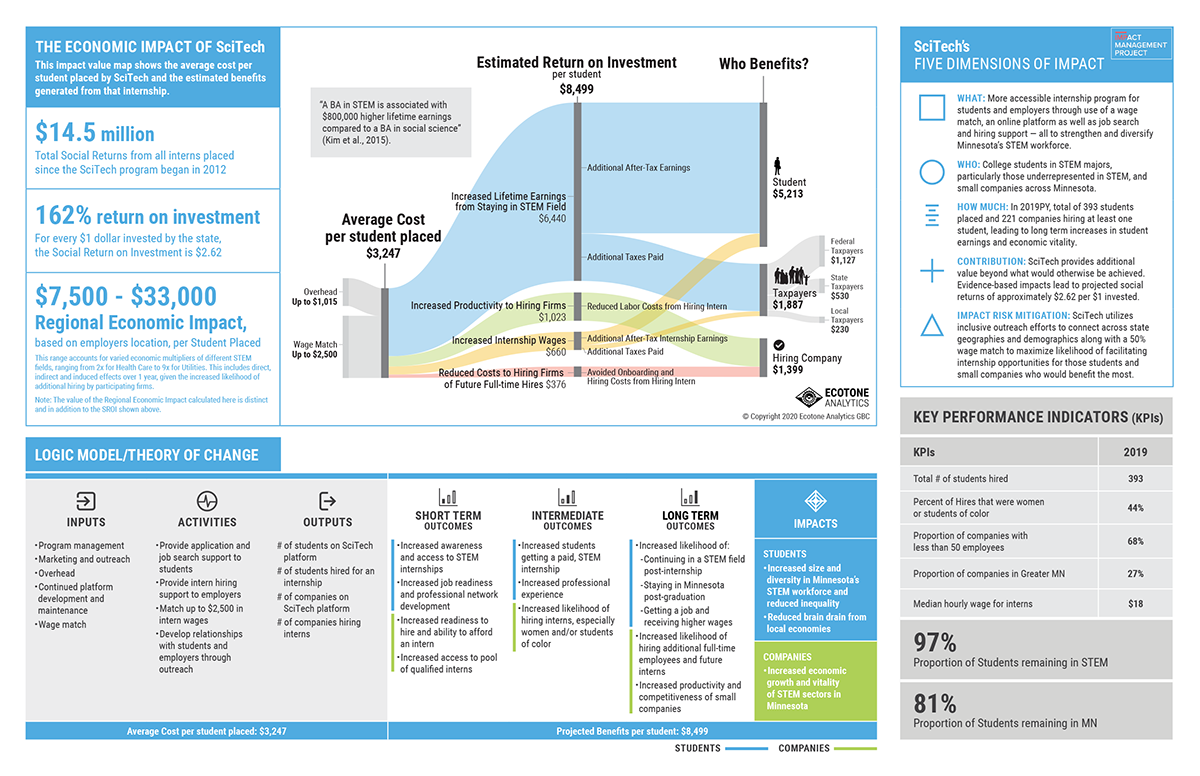
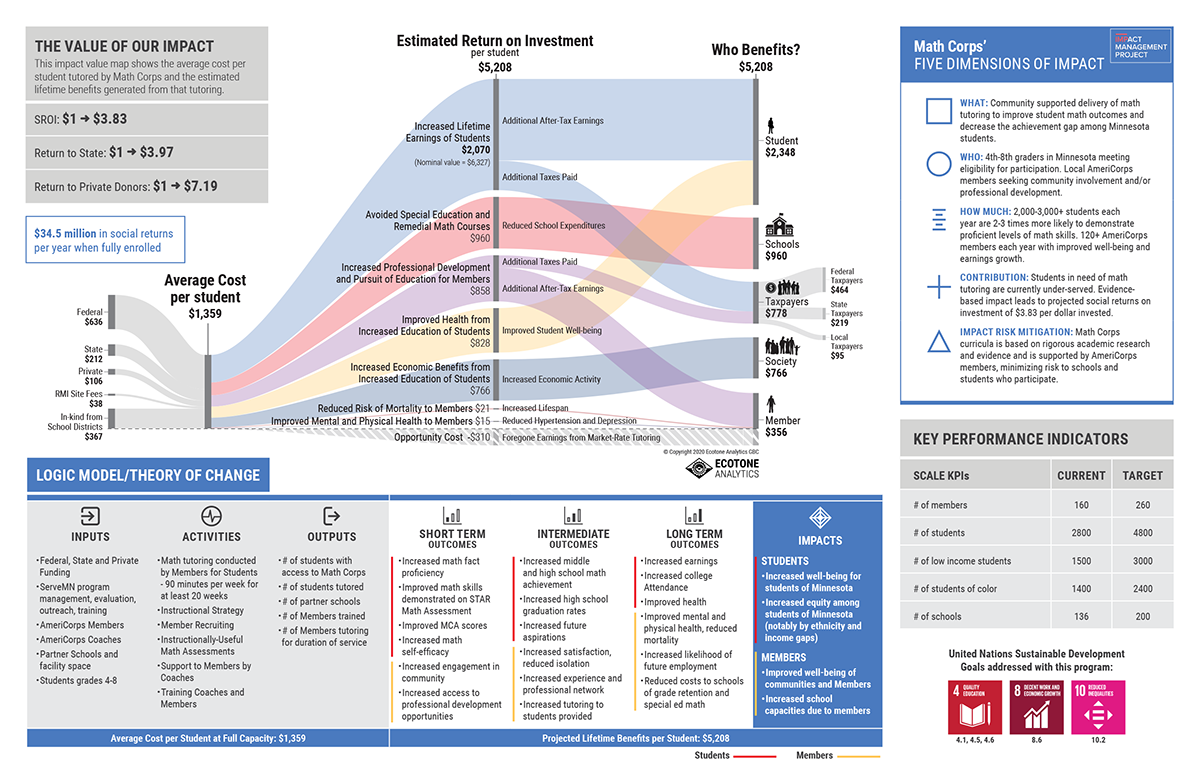
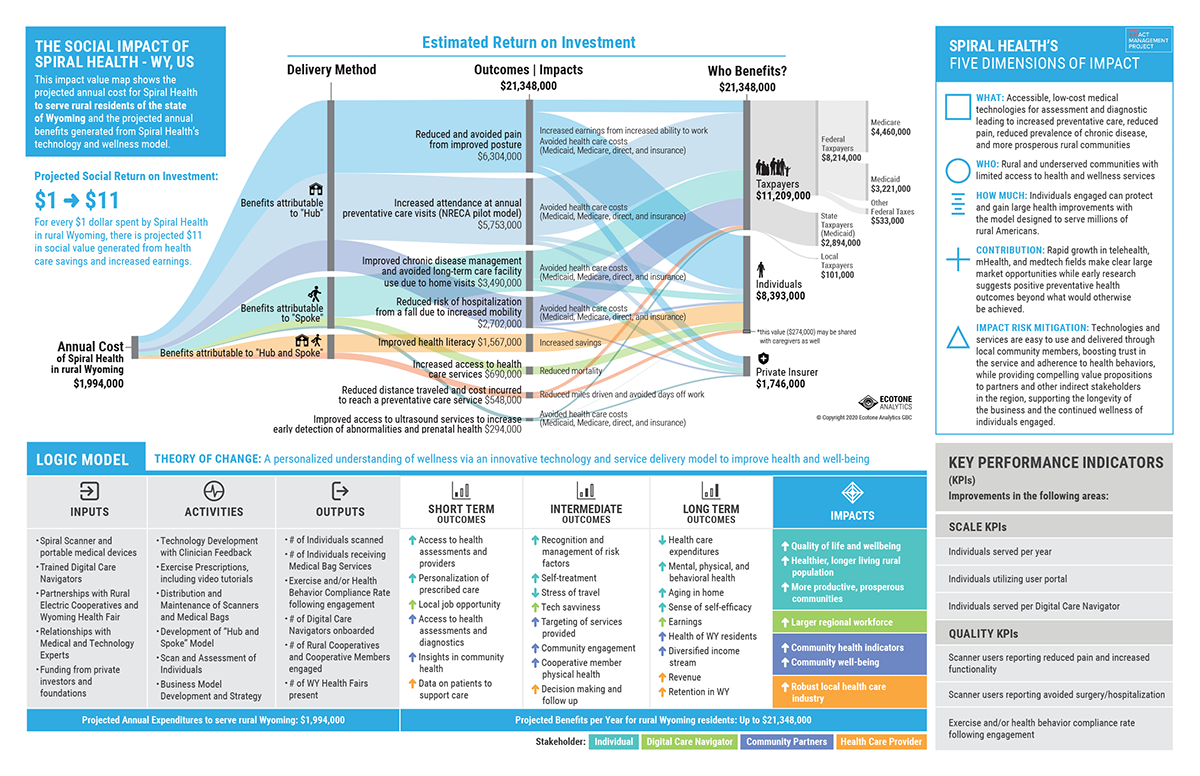
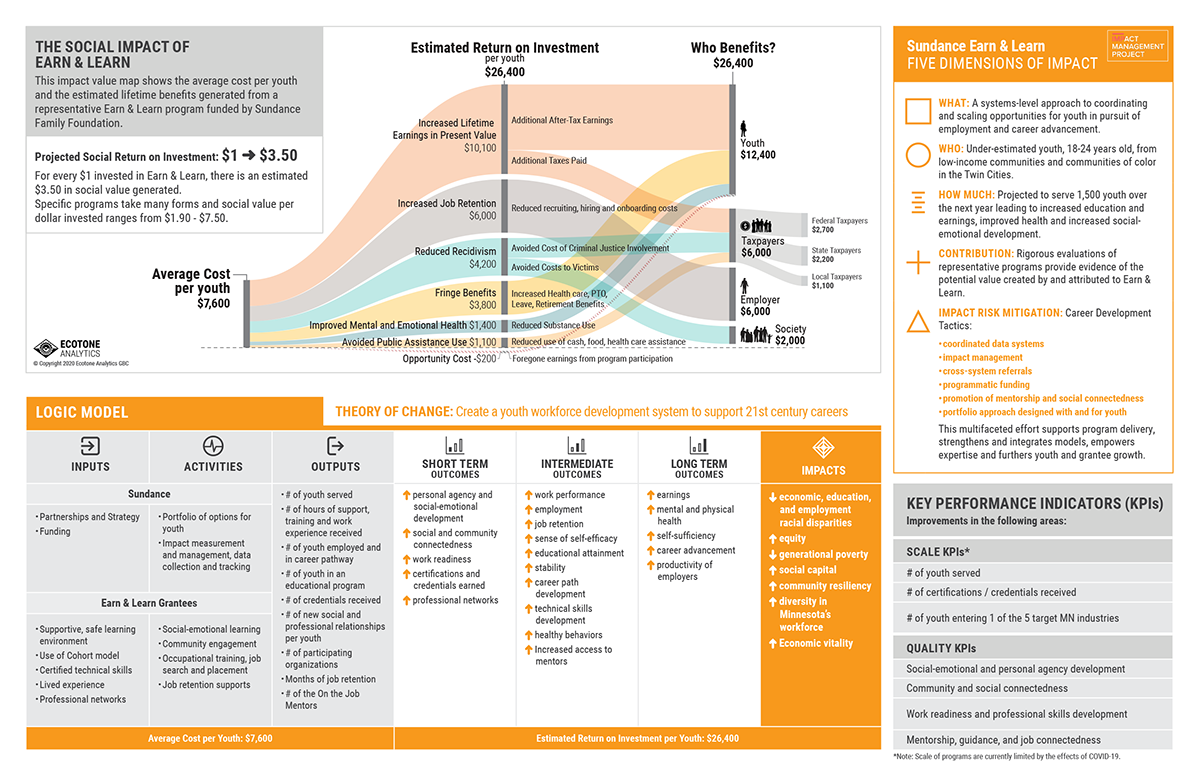
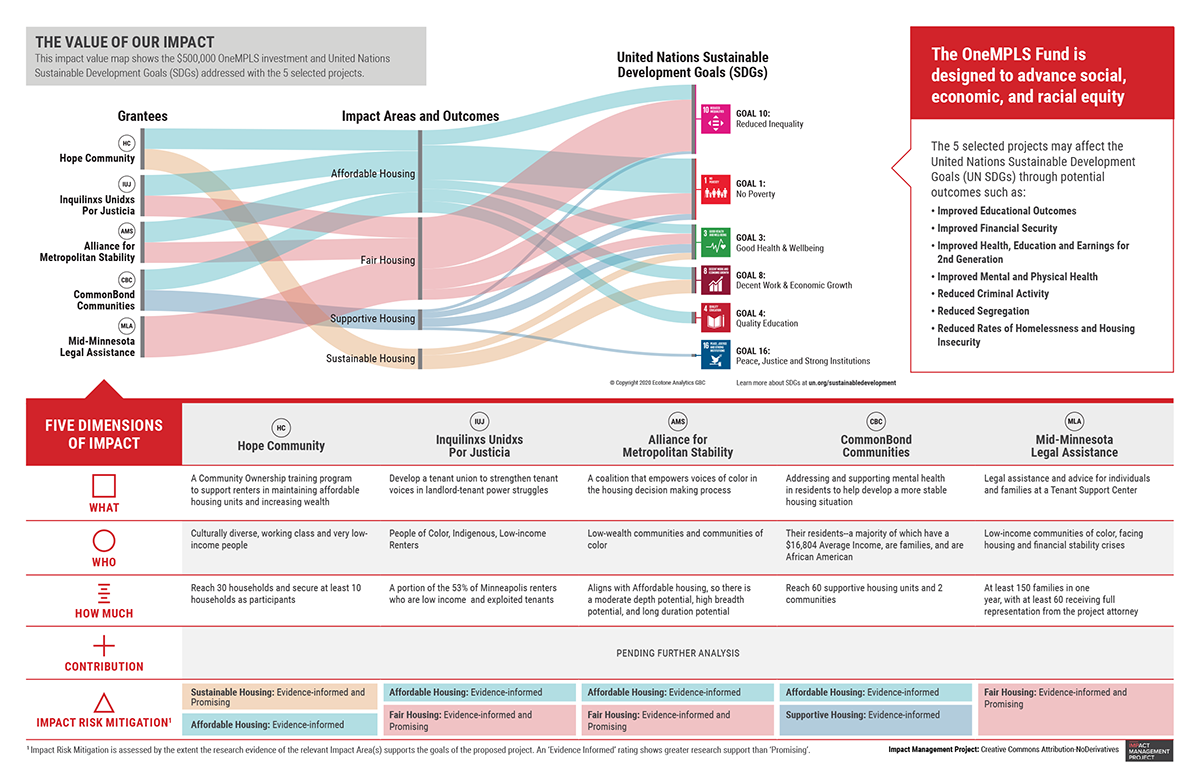
Through a long-term partnership with Ecotone Analytics we create infographics (or “social benefit flow” diagrams) that show how non-profits, businesses, education, government and social enterprises create impact in the community, and to communicate the value of that impact to investors and stakeholders.
We developed approachable visuals to show Ecotone's data in context, so that the audience is driven to engage with the data.
Our Work Includes: INFOGRAPHICS, DATAVIS
PROJECT IMPACT
Communicate the value of an organization's social impact to investors and stakeholders.
Our Partner:
Ecotone’s mission is to help clients scale their social and environmental impact by communicating impact value to stakeholders and investors.
This Organization's Focus:


Highly visual charts and infographics show prospective partners the social benefits of investing in non-profits and other social enterprises


Social return on investment flow diagrams invite the audience to engage with the data.

Engaging infographics and graphs work together to communicate the social benefits.


“Before Background Stories' dataviz, it was hard to get people to pay attention. Their eyes were glazing over. Now people lean in and say 'this is really cool'. We're more quickly able to get to a better conversation.”
TED CARLING, Ecotone Analytics Co-Founder & COO