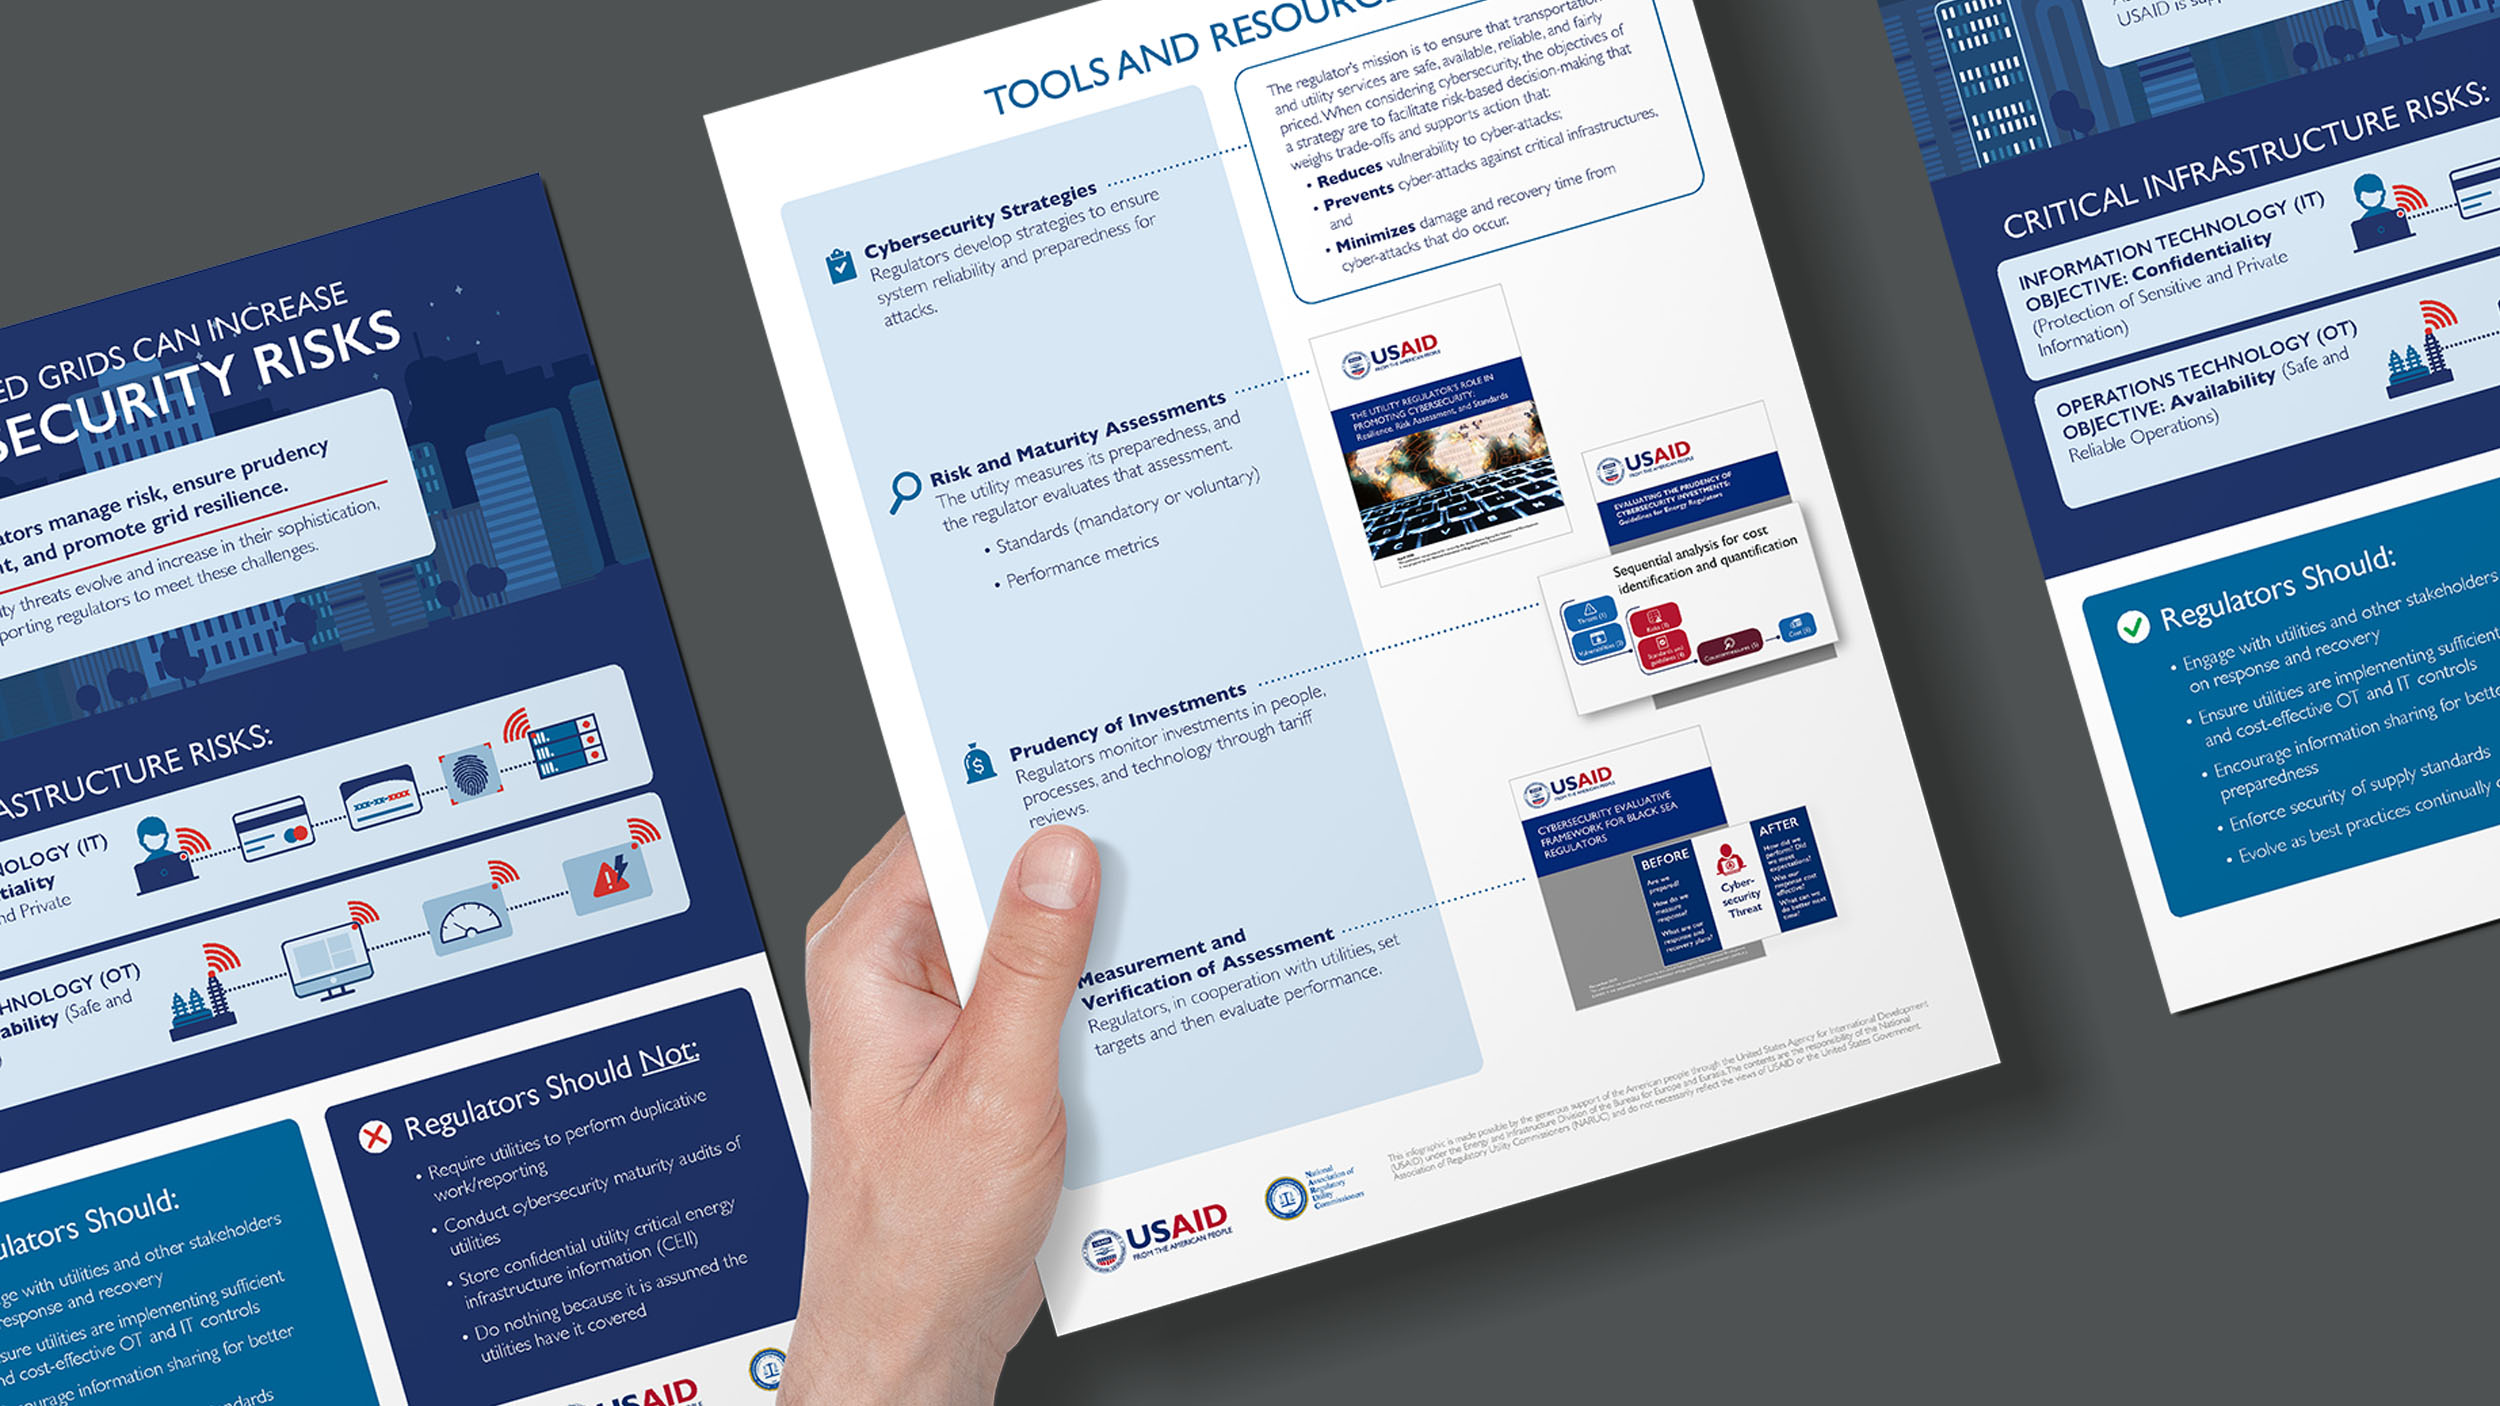
Infographics help regulators visually explain complex regulatory processes
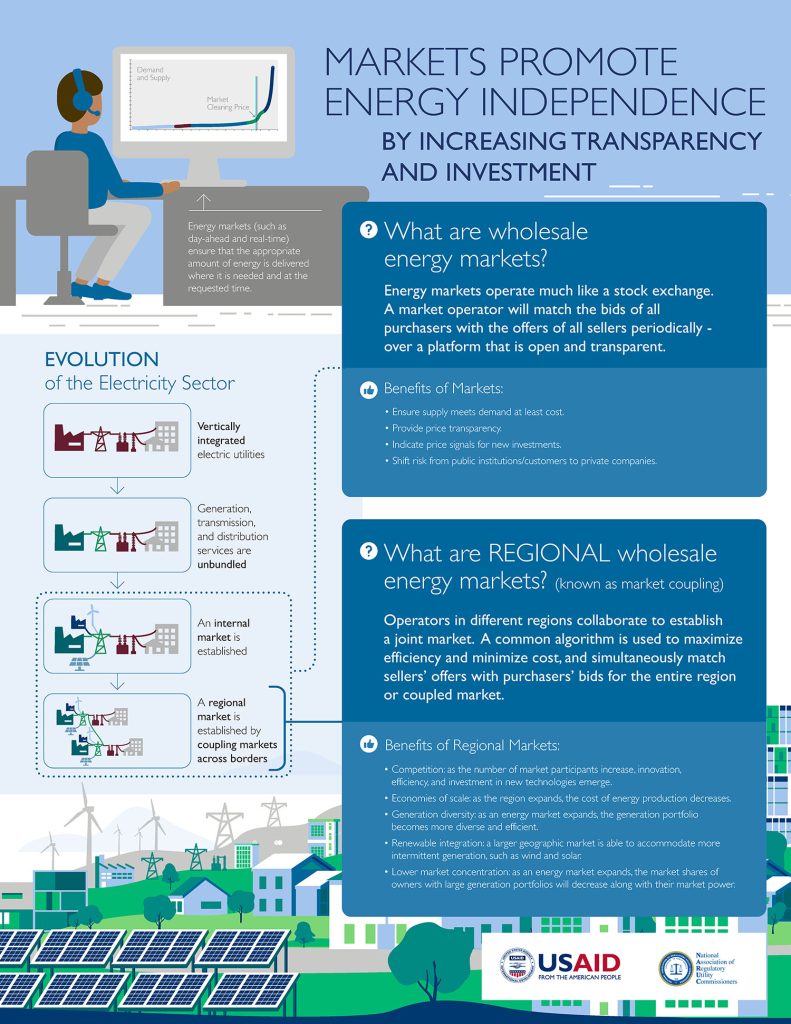
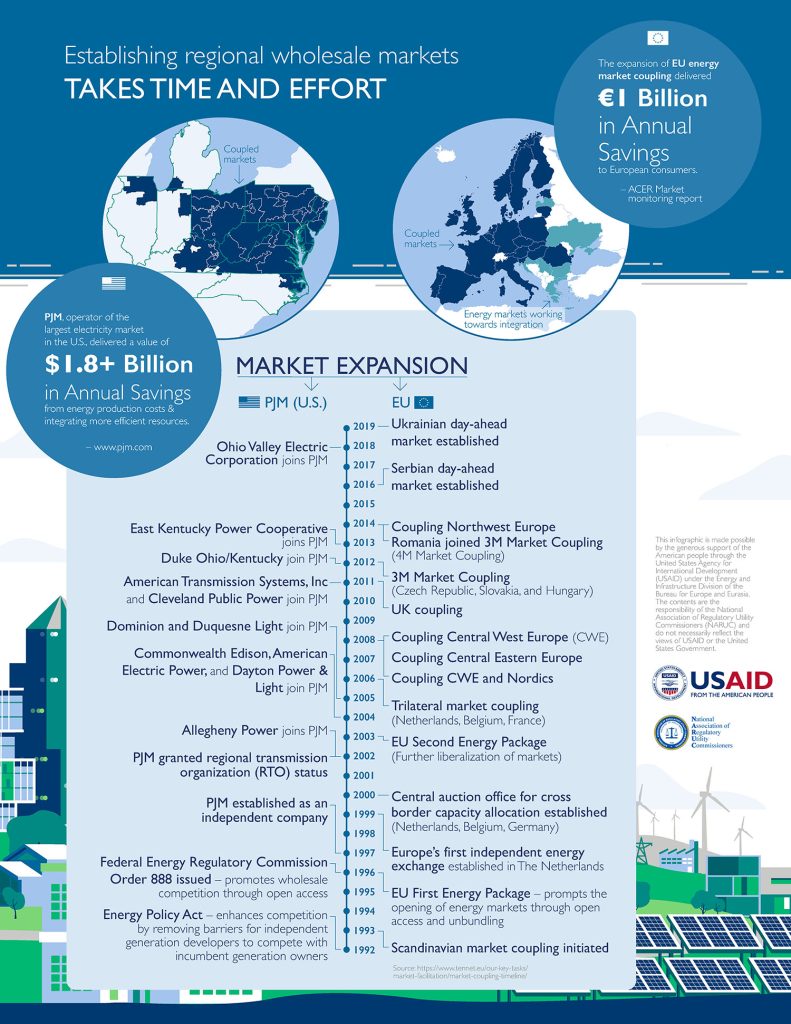
To visually explain complex regulatory processes to government officials, we created this series of printable, one-page infographics. For our ongoing client’s international work, they often need to communicate to people working alongside them on projects. Topics range from cybersecurity to energy markets and distribution, and gender equity. This project is funded by USAID.
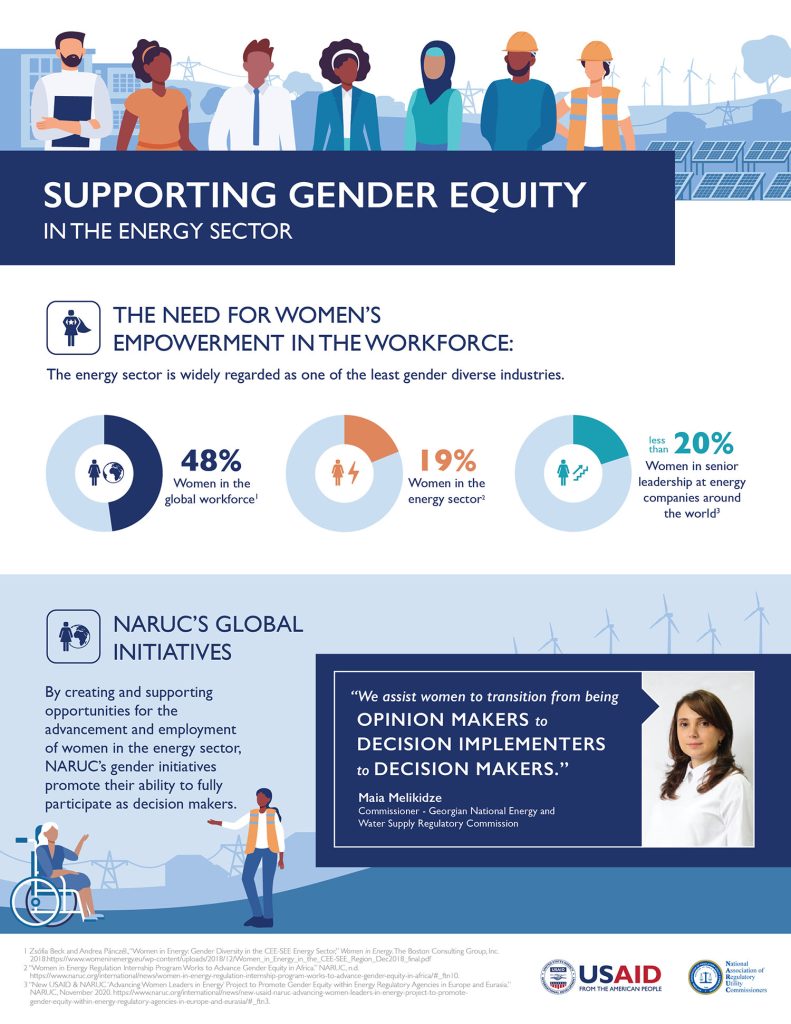
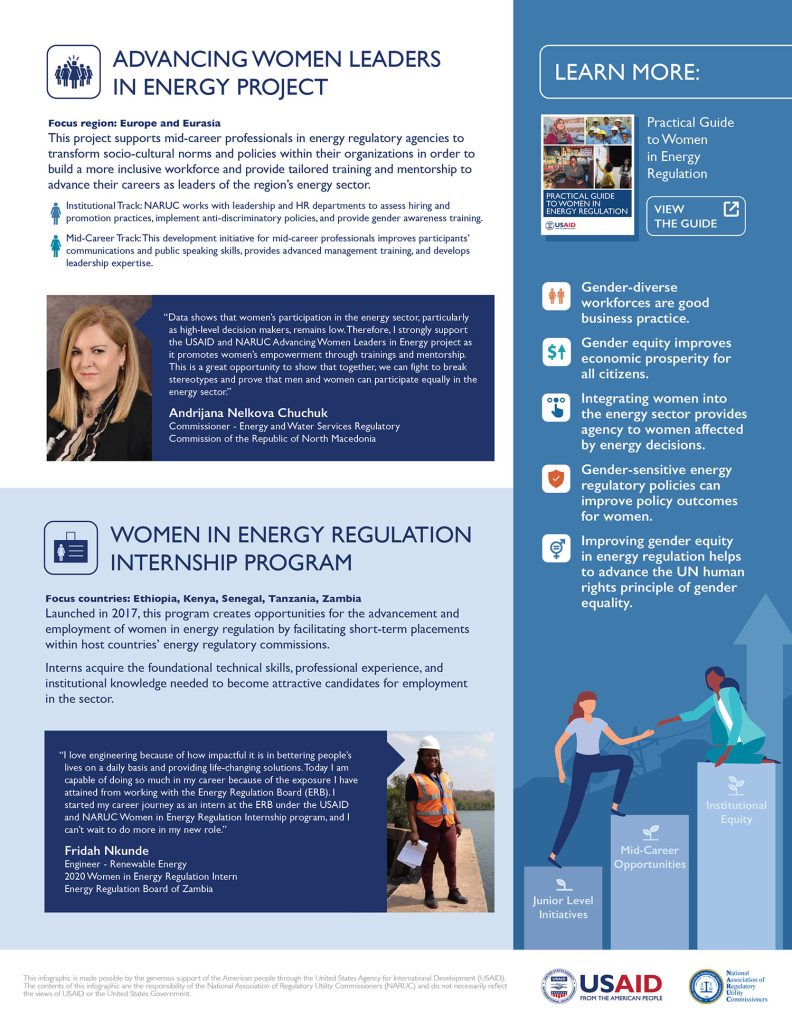
Using visual storytelling, we structured content into a visual format to communicate the need for gender equity in the energy sector.
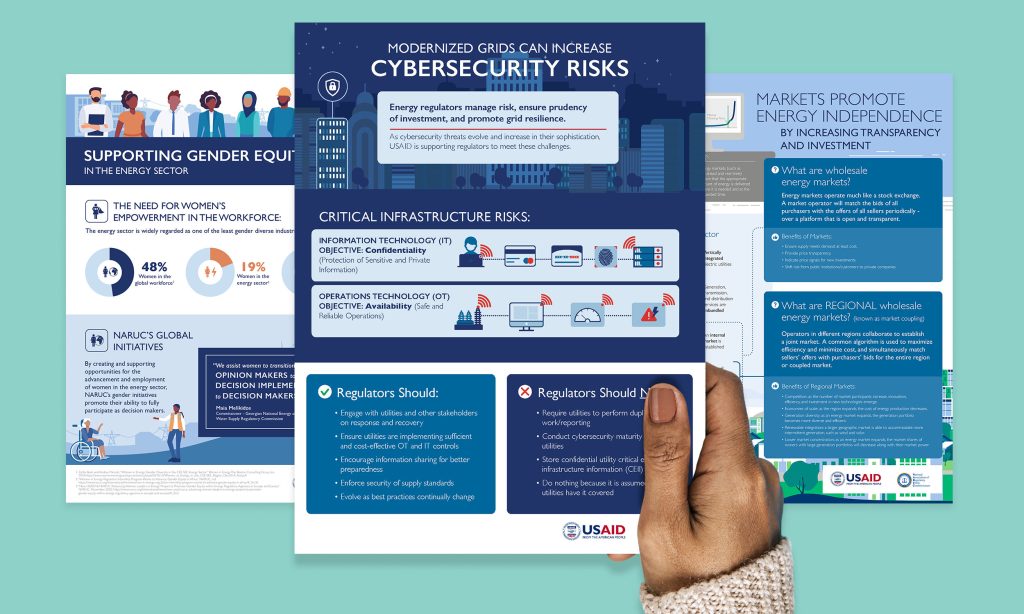
Highly visual infographics and data visualization help stakeholders understand the benefits of regional wholesale energy markets