Turning community data and values into visual stories
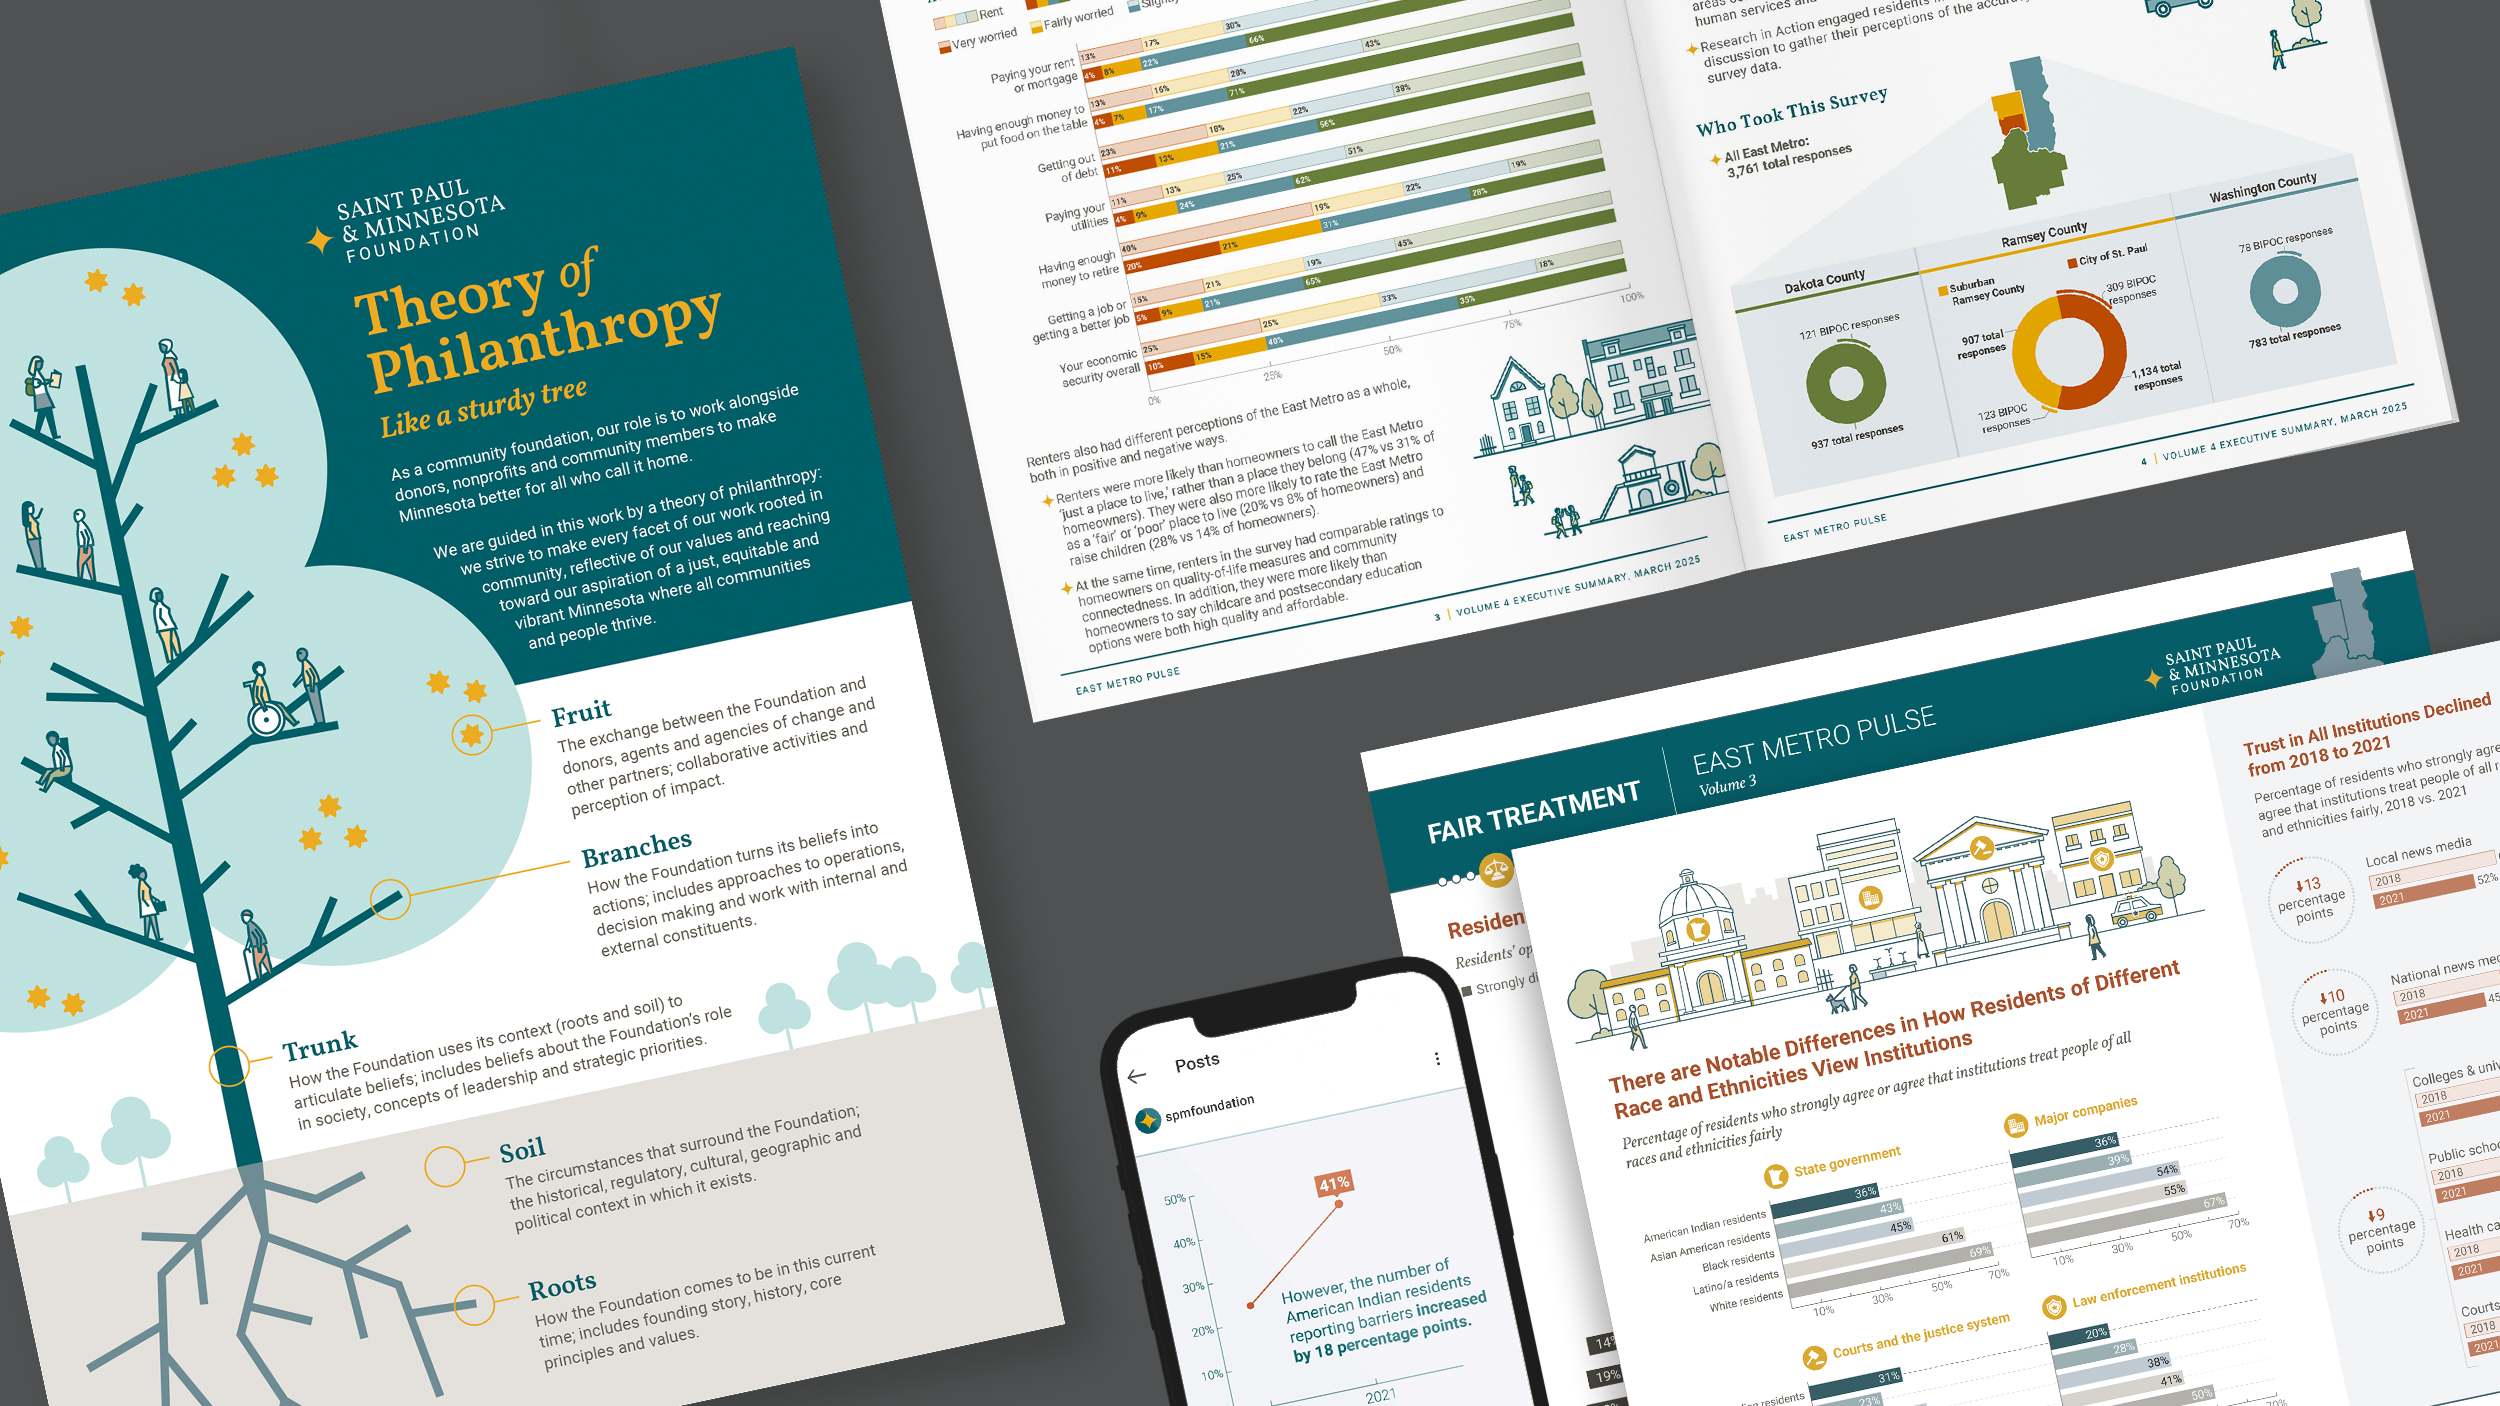
In partnership with the Saint Paul & Minnesota Foundation (SPMCF), we’ve designed tools that translate complex data and mission-driven strategy into engaging visual stories. From research reports that measure community vitality to a visual framework that expresses SPMCF’s philanthropic values, each piece helps audiences connect to SPMCF’s work toward an equitable, just, and vibrant Minnesota.
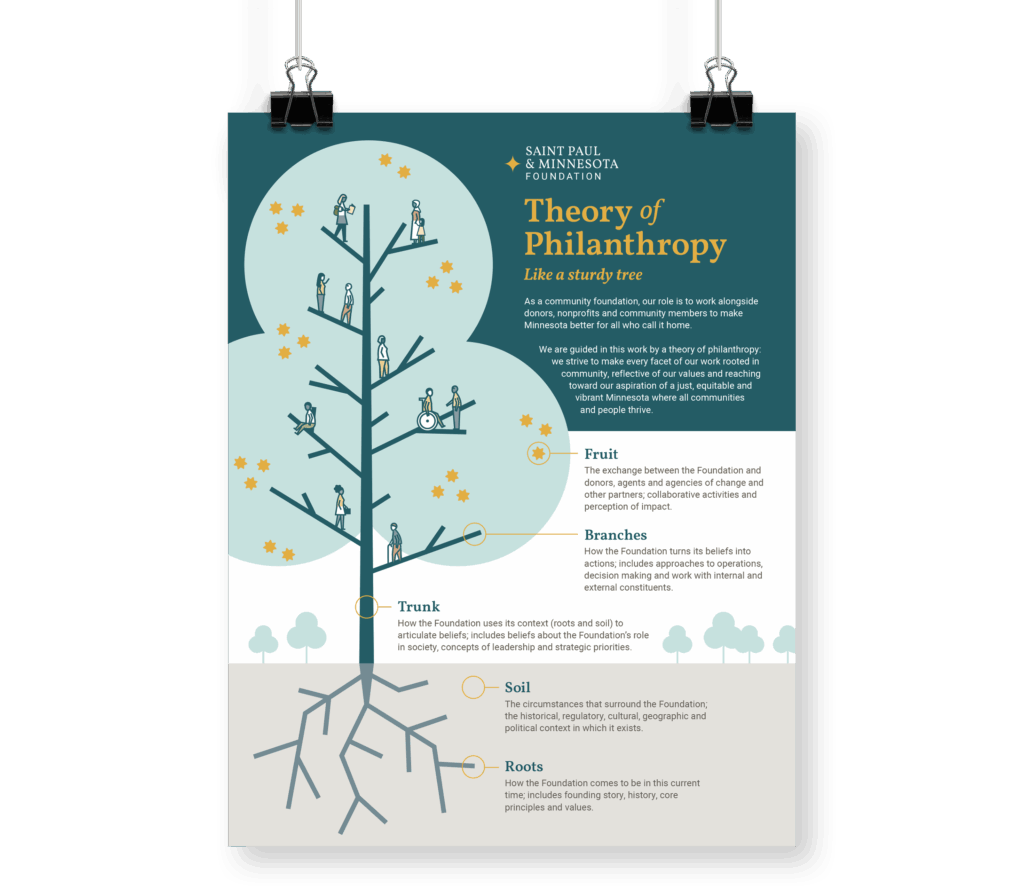
Our collaboration spans multiple initiatives, including East Metro Pulse, a recurring community survey, and SPMCFs Theory of Philanthropy, which illustrates how their work and partnerships are rooted in community.
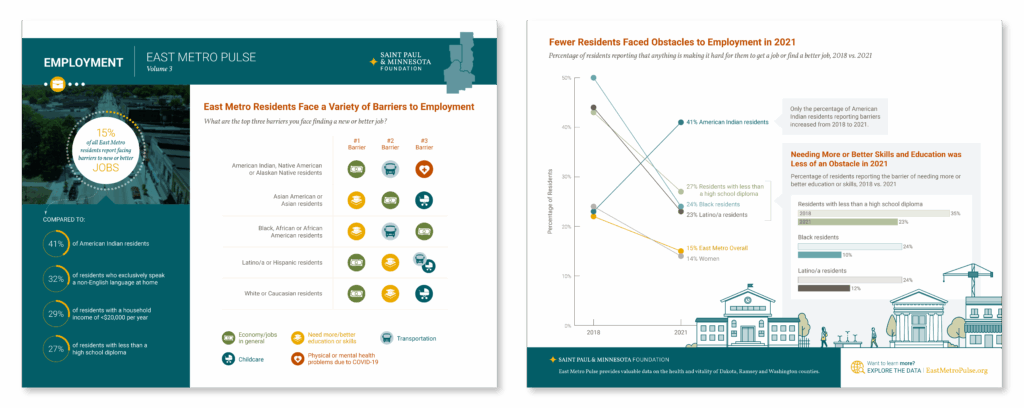
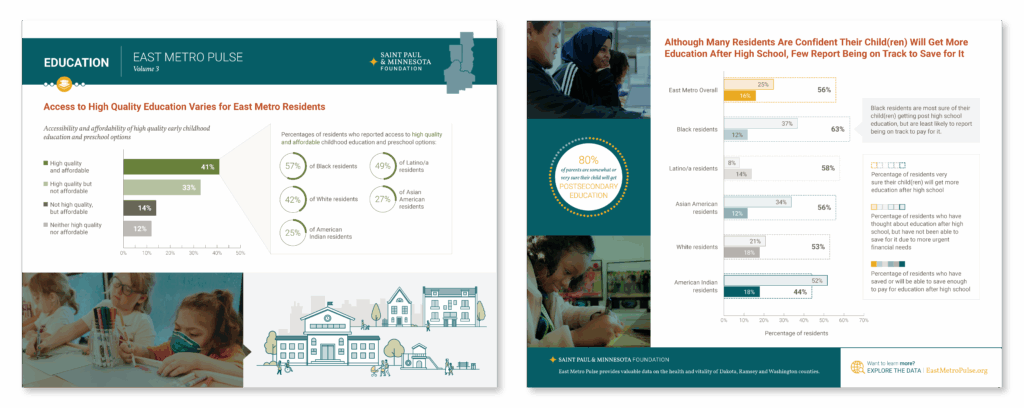
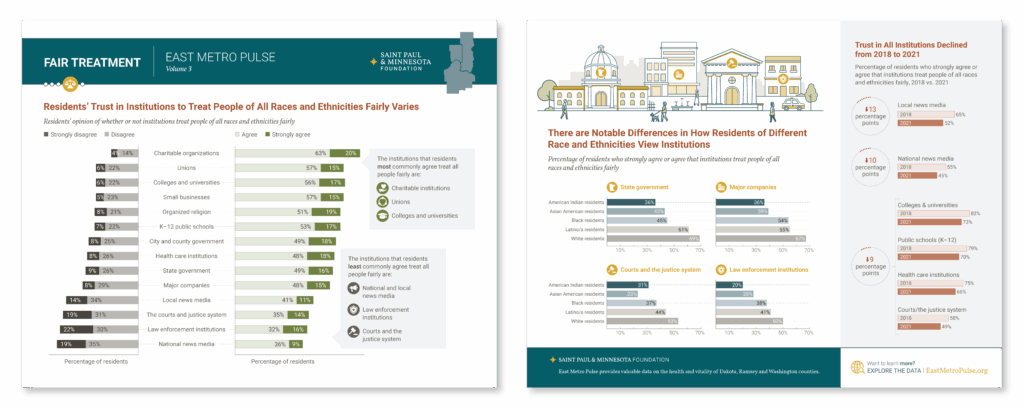
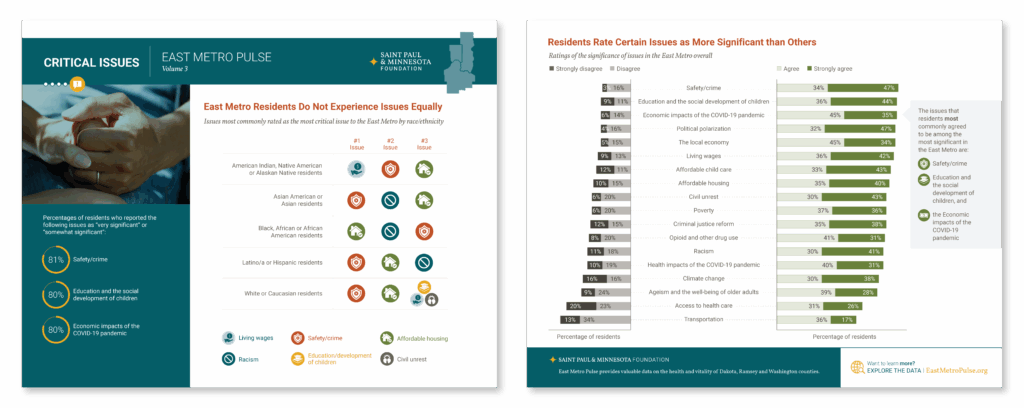
Illustration-rich infographics turn East Metro Pulse survey data into stories of community insight.
Visually engaging reports distill community data into clear, digestible summaries
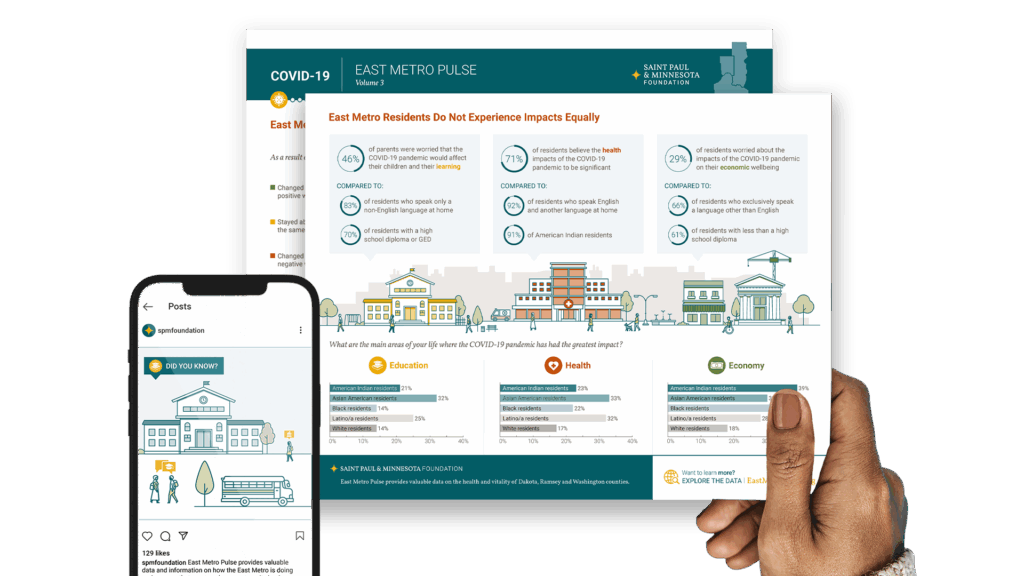
For volume 3 of the East Metro Pulse, we designed a suite of mini-reports that highlight key findings from the survey, pairing data visualization with clear narratives. Each report reveals insights about community vitality, equity, and quality of life across the East Metro region.
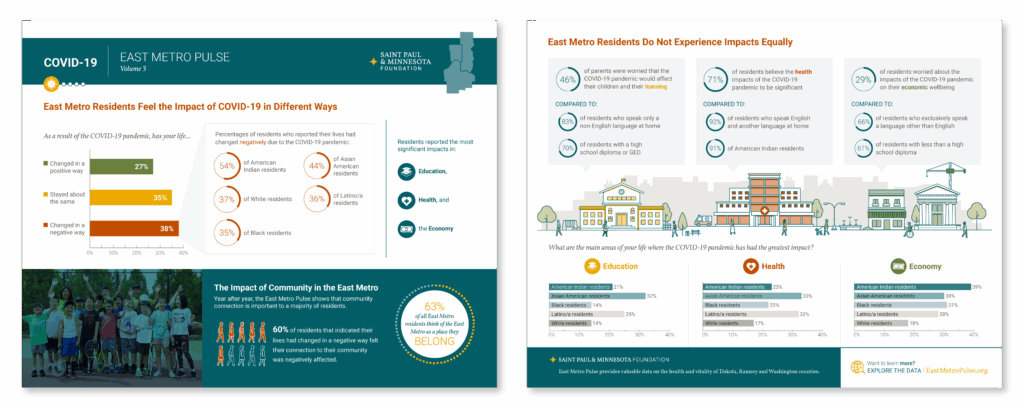

A data-rich executive summary brings community insights to life
For volume 4 of the East Metro Pulse, we created an executive summary that turns hundreds of data points into a clear, engaging narrative. Through illustration and accessible data visualization, readers can quickly grasp key trends and demographic insights at a glance.
To support their in-house marketing team, we also created adaptable templates for supplemental materials and social media, ensuring visual consistency across all communications.
An illustrated infographic maps the foundation’s community-grounded approach to giving.