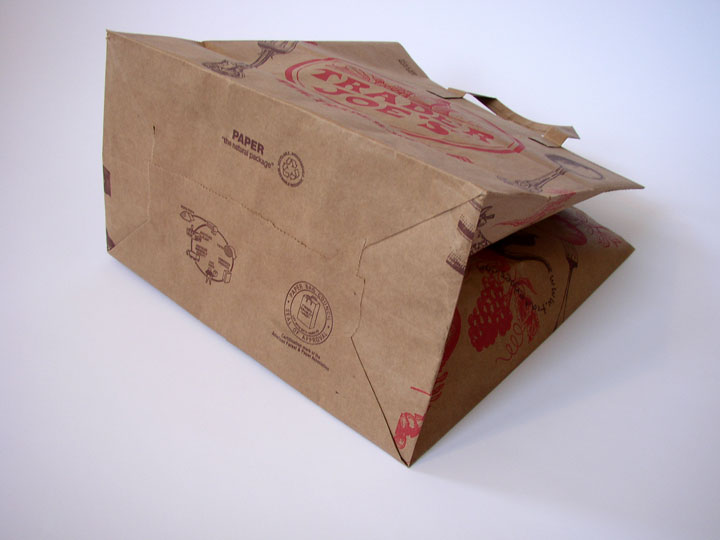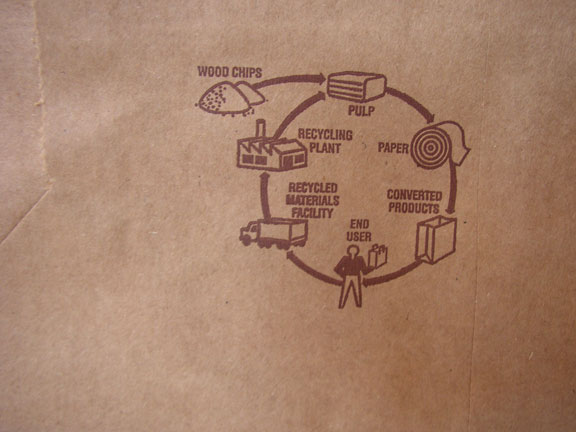
Companies are increasingly able to track the life of their products through their supply chains and trace the origins of even the smallest notion.
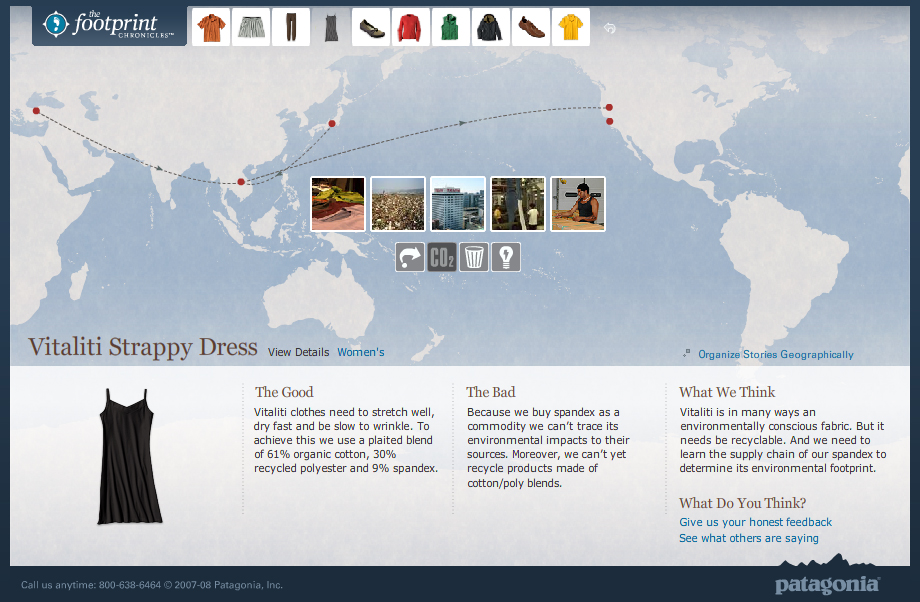
Patagonia’s Footprint Chronicles outlines the potential for a company to unveil its transparency in the name of promoting sustainability (and hence, appearing as a sustainable company). From an information standpoint, Patagonia is open about “The Good” and “The Bad” – admitting that, like any human, they’re not yet perfect, but they know where they need to improve.
The online tool carries the viewer through design, materials, manufacture, distribution (among others) of a handful of the company’s products, allowing the user to explore info both sequentially or geographically. Based on google-esque maps, the tool is well-designed as both a piece of information design and as an interactive tool.
Though included are a handful of data and other numbers, I’d like to see these numbers presented in a more visual way – nice parallels are drawn to perceivable concepts to make abstract quantities real. For example: where they say the CO2 generated from a specific shirt is equal to 100x the weight of the shirt, it would be nice to have a more standard reference: such as how many miles average driving…or how many trees need to be planted to counteract this release of CO2. This reference could in-turn, be illustrated in a more graphic format that would enable more direct comparison between various products.
