We use visual storytelling to put information into context and help non-expert audiences identify connections to their own lives. Our team applies visual storytelling in many mediums, and this includes websites.
Whether it’s a single-page scrollable story, a microsite of 5–7 pages, or a more complex website, these online formats provide opportunities to layer information—to invite visitors into content. Here are some ways that our team incorporates visual storytelling into web projects.

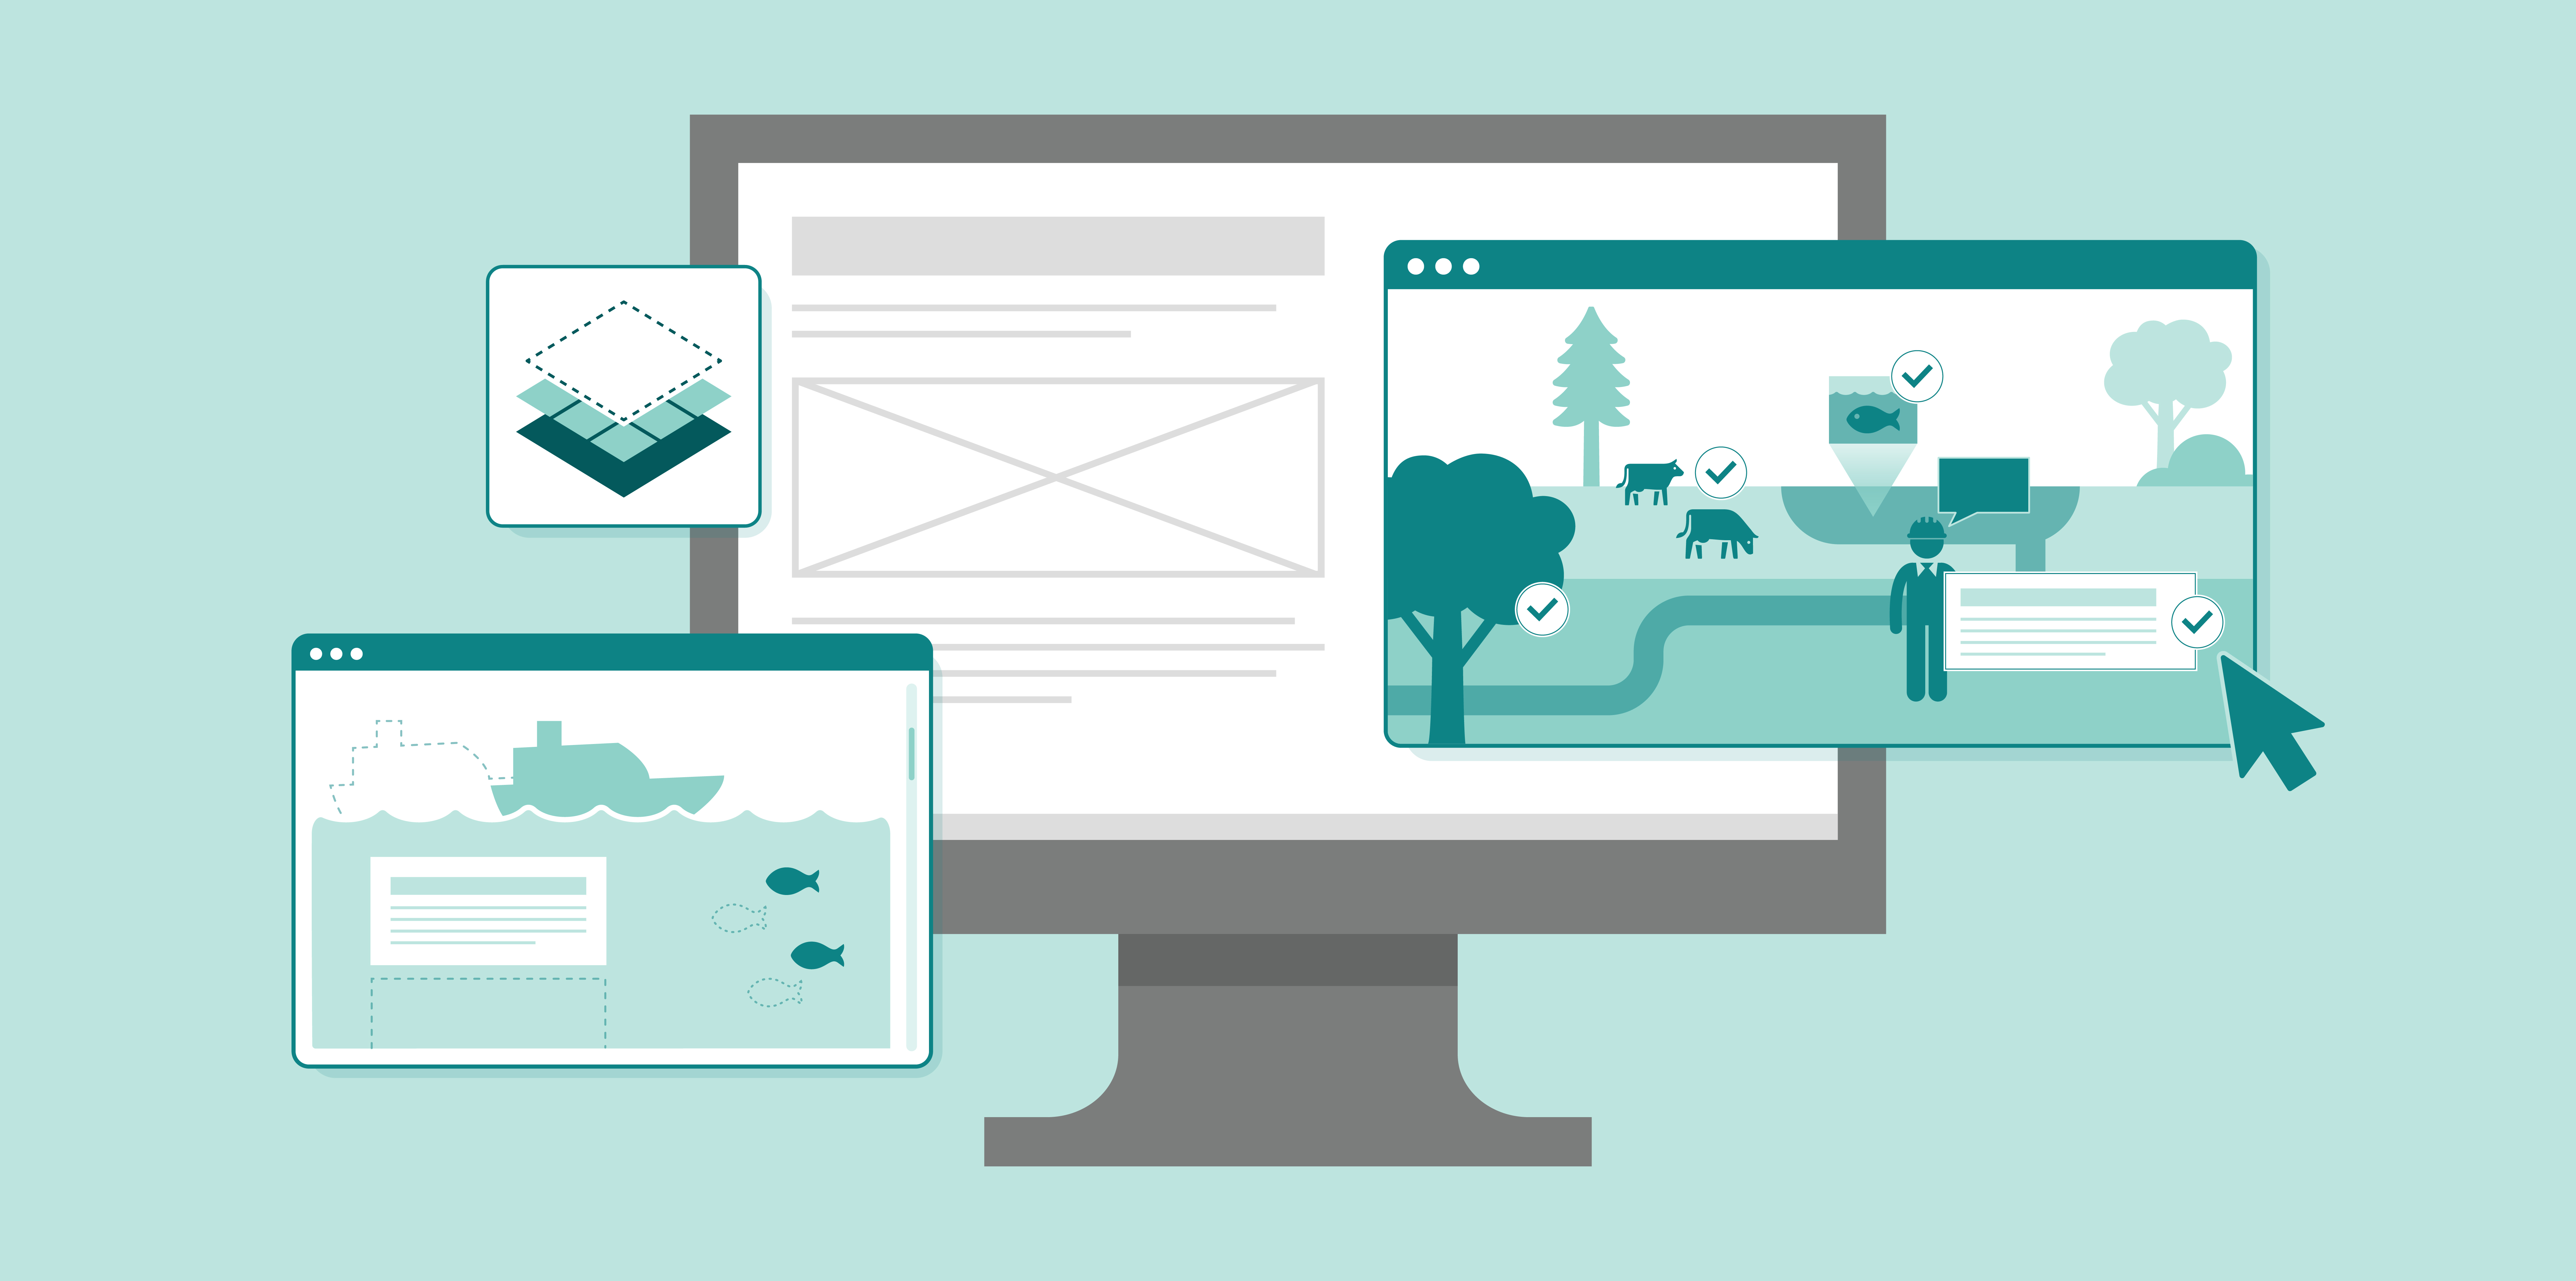
Reveal content in layers
“Scrollytelling” enables transitions as the viewer scrolls, allowing graphics to build complexity over time. This is an especially useful technique when communicating scientific research to non-expert audiences. Unlike more static formats, websites can give each audience member control over how quickly or slowly the information is revealed.
This scrolling infographic visualizes new technologies and research in the field of selective fishing. Illustration and text are integrated to provide context for technical information and convey the science in an approachable way.
The homepage of this microsite uses visual storytelling to connect upstream activities to downstream water quality. With engaging scroll animations, it walks the non-expert audience through each layer of complexity. After setting up this context, local community members are prepared to understand the rest of the website’s water quality data and other insights.
The website summarizes the health of two Florida bay ecosystems with illustrations, maps, data visualization, and photos.

Use relatable imagery
On this single-page microsite, a clickable infographic allows the viewer to see clean energy solutions in context and discover the content at their own pace. A generalized illustration helps the audience member see their own home in the graphic and relate the information to their own life.
This microsite was part of a suite of deliverables designed to help aquarium visitors connect clean energy to supporting ocean life.
This web tool uses Minnesota-specific landscape illustrations that change with different seasons and climate scenarios. As the user navigates the website, visual cues and icons help them identify with solutions and apply them to their own farming practices.
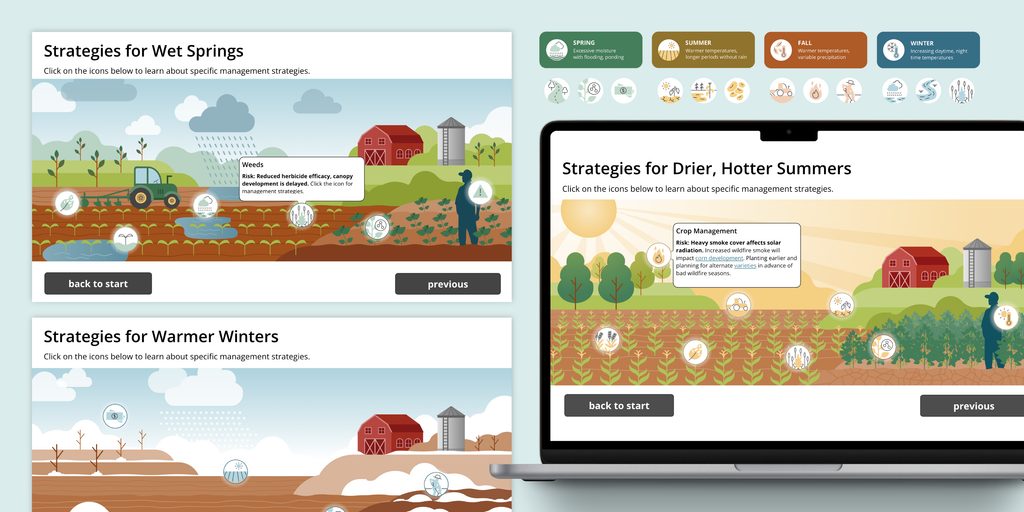
Minnesotan farmers use this web tool to understand how changes in climate will continue to affect their farming. The imagery helps tell the story in a way that can enable farmers to adapt to changing conditions, and a set of icons color coded by seasons guides the audience through the tool.

Focus on local stories
This scrollytelling microsite uses Minnesota-focused visuals to show the connection between the landscape, the community, and our common resource: water. The illustrations put the content into a local context and help communities understand the processes involved in caring for our water resources.
In collaboration with the Minnesota Clean Water Council, we designed an ArcGIS page that uses visual storytelling to explain how the Clean Water Fund protects, enhances, and restores our waters.