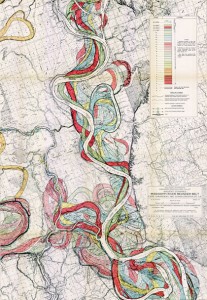
In a beautiful example of layered visual information, Harold Fisk mapped a portion of the Mississippi River in 1944. The series of plates show the changes in the path of the river through time. I’m drawn to the simple and clear detail, effective color palette and the amount of information communicated through this simple technique.

The full map is available at the US Army Corp of Engineers.

stormtrooper wallpaper says:
very good article. You might have a superb opinion on the subject and I’ll be subscribing to your feed and hope you shall post once more soon on similar subjects. But I was curious on what your sources for the post are? Thanks a lot