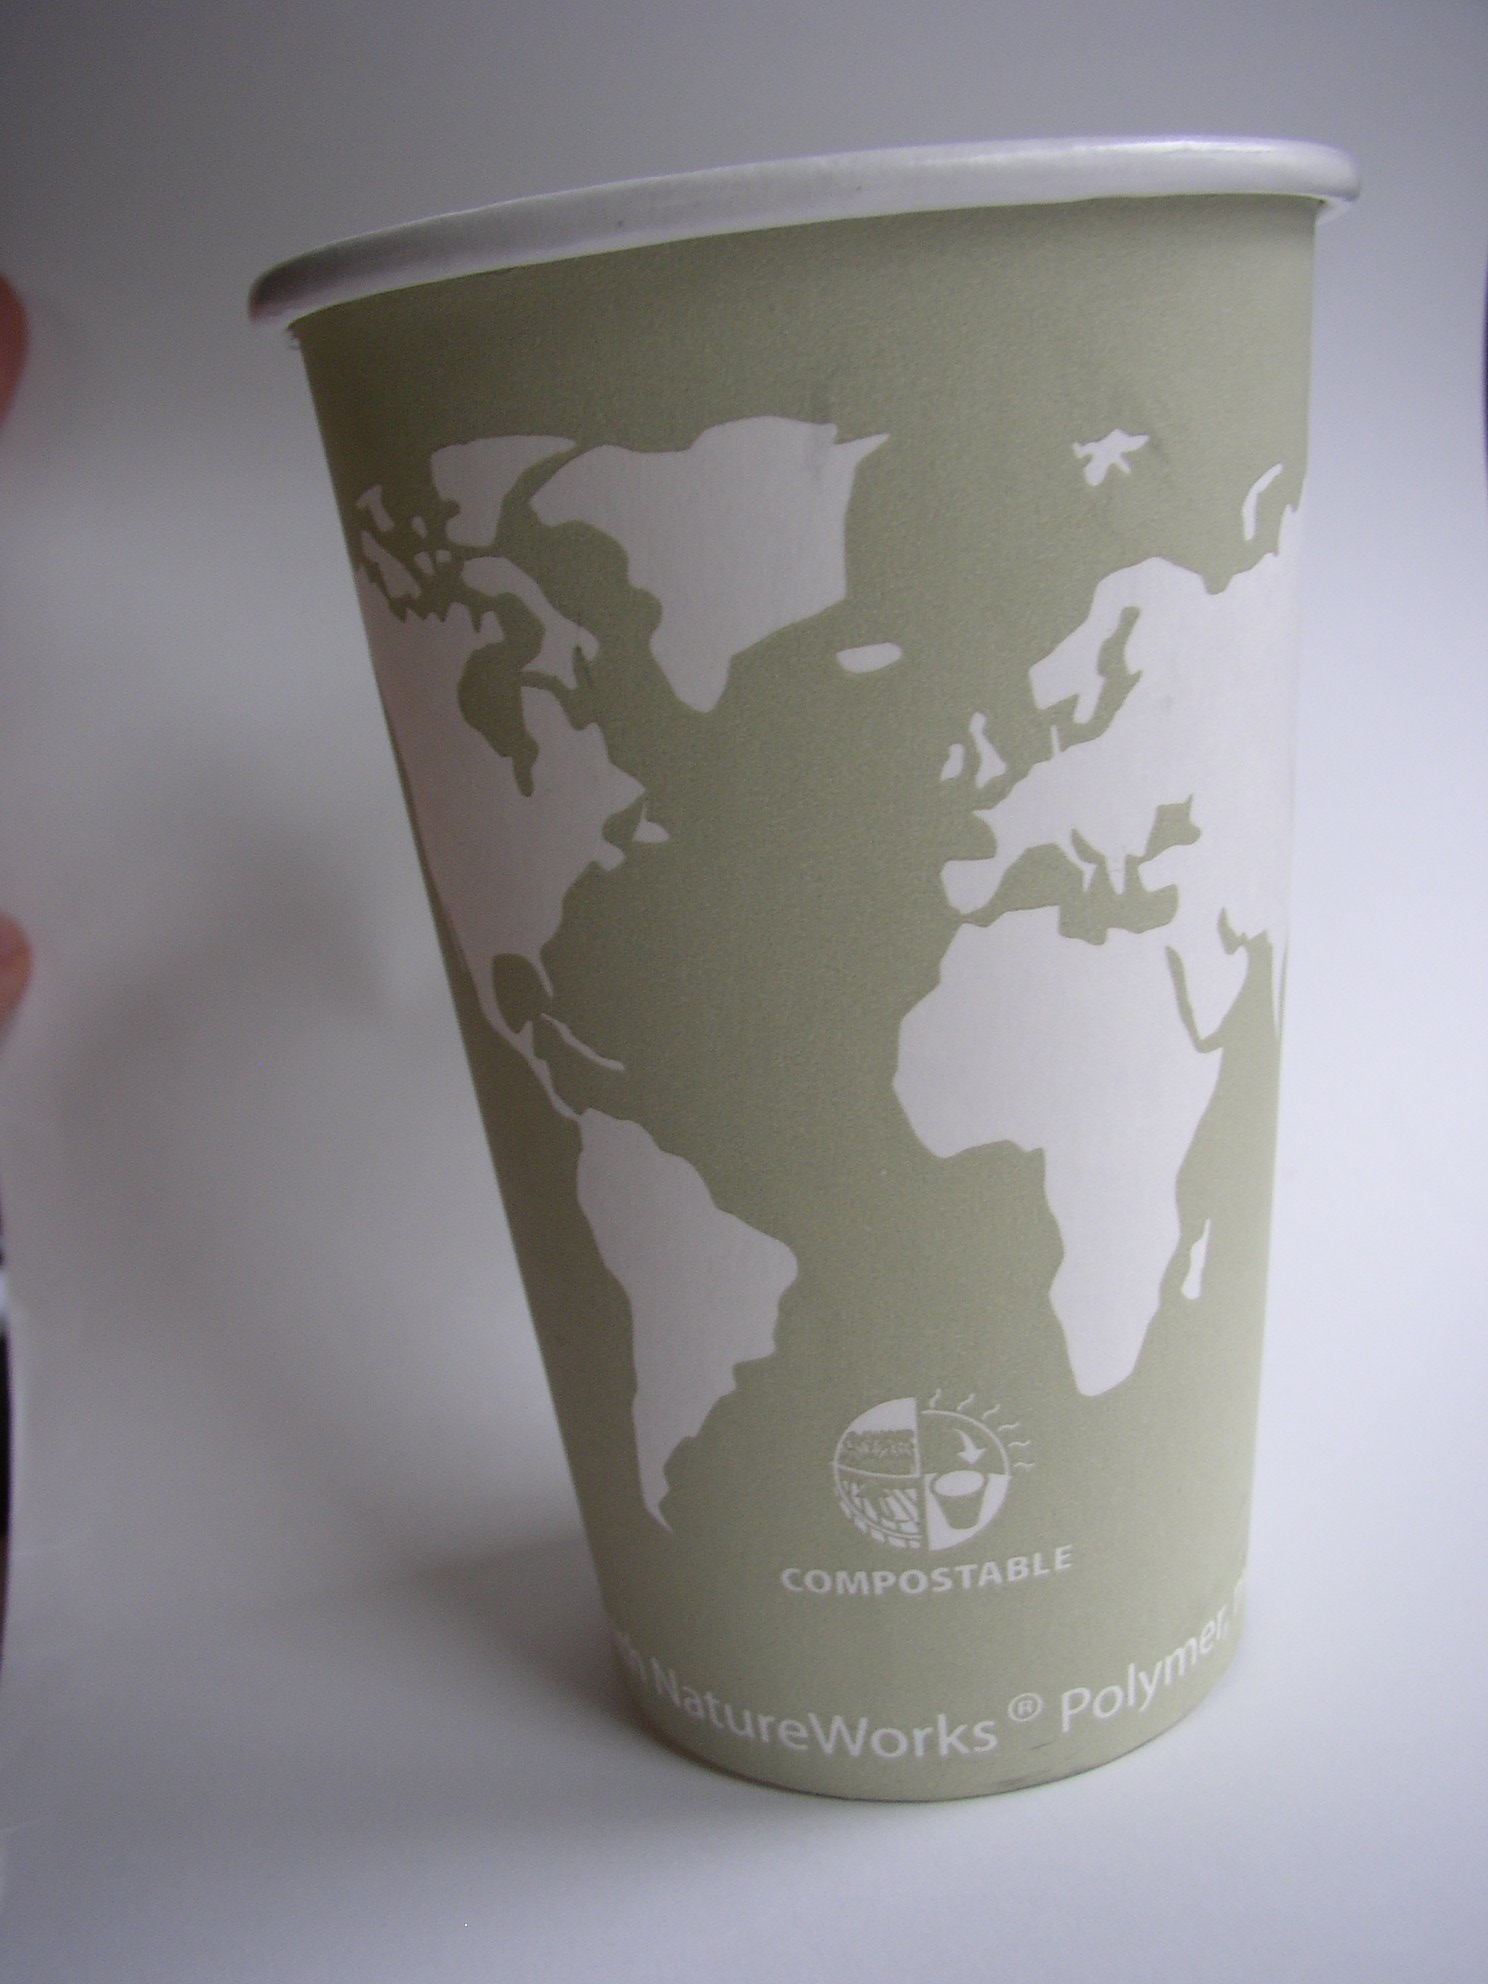
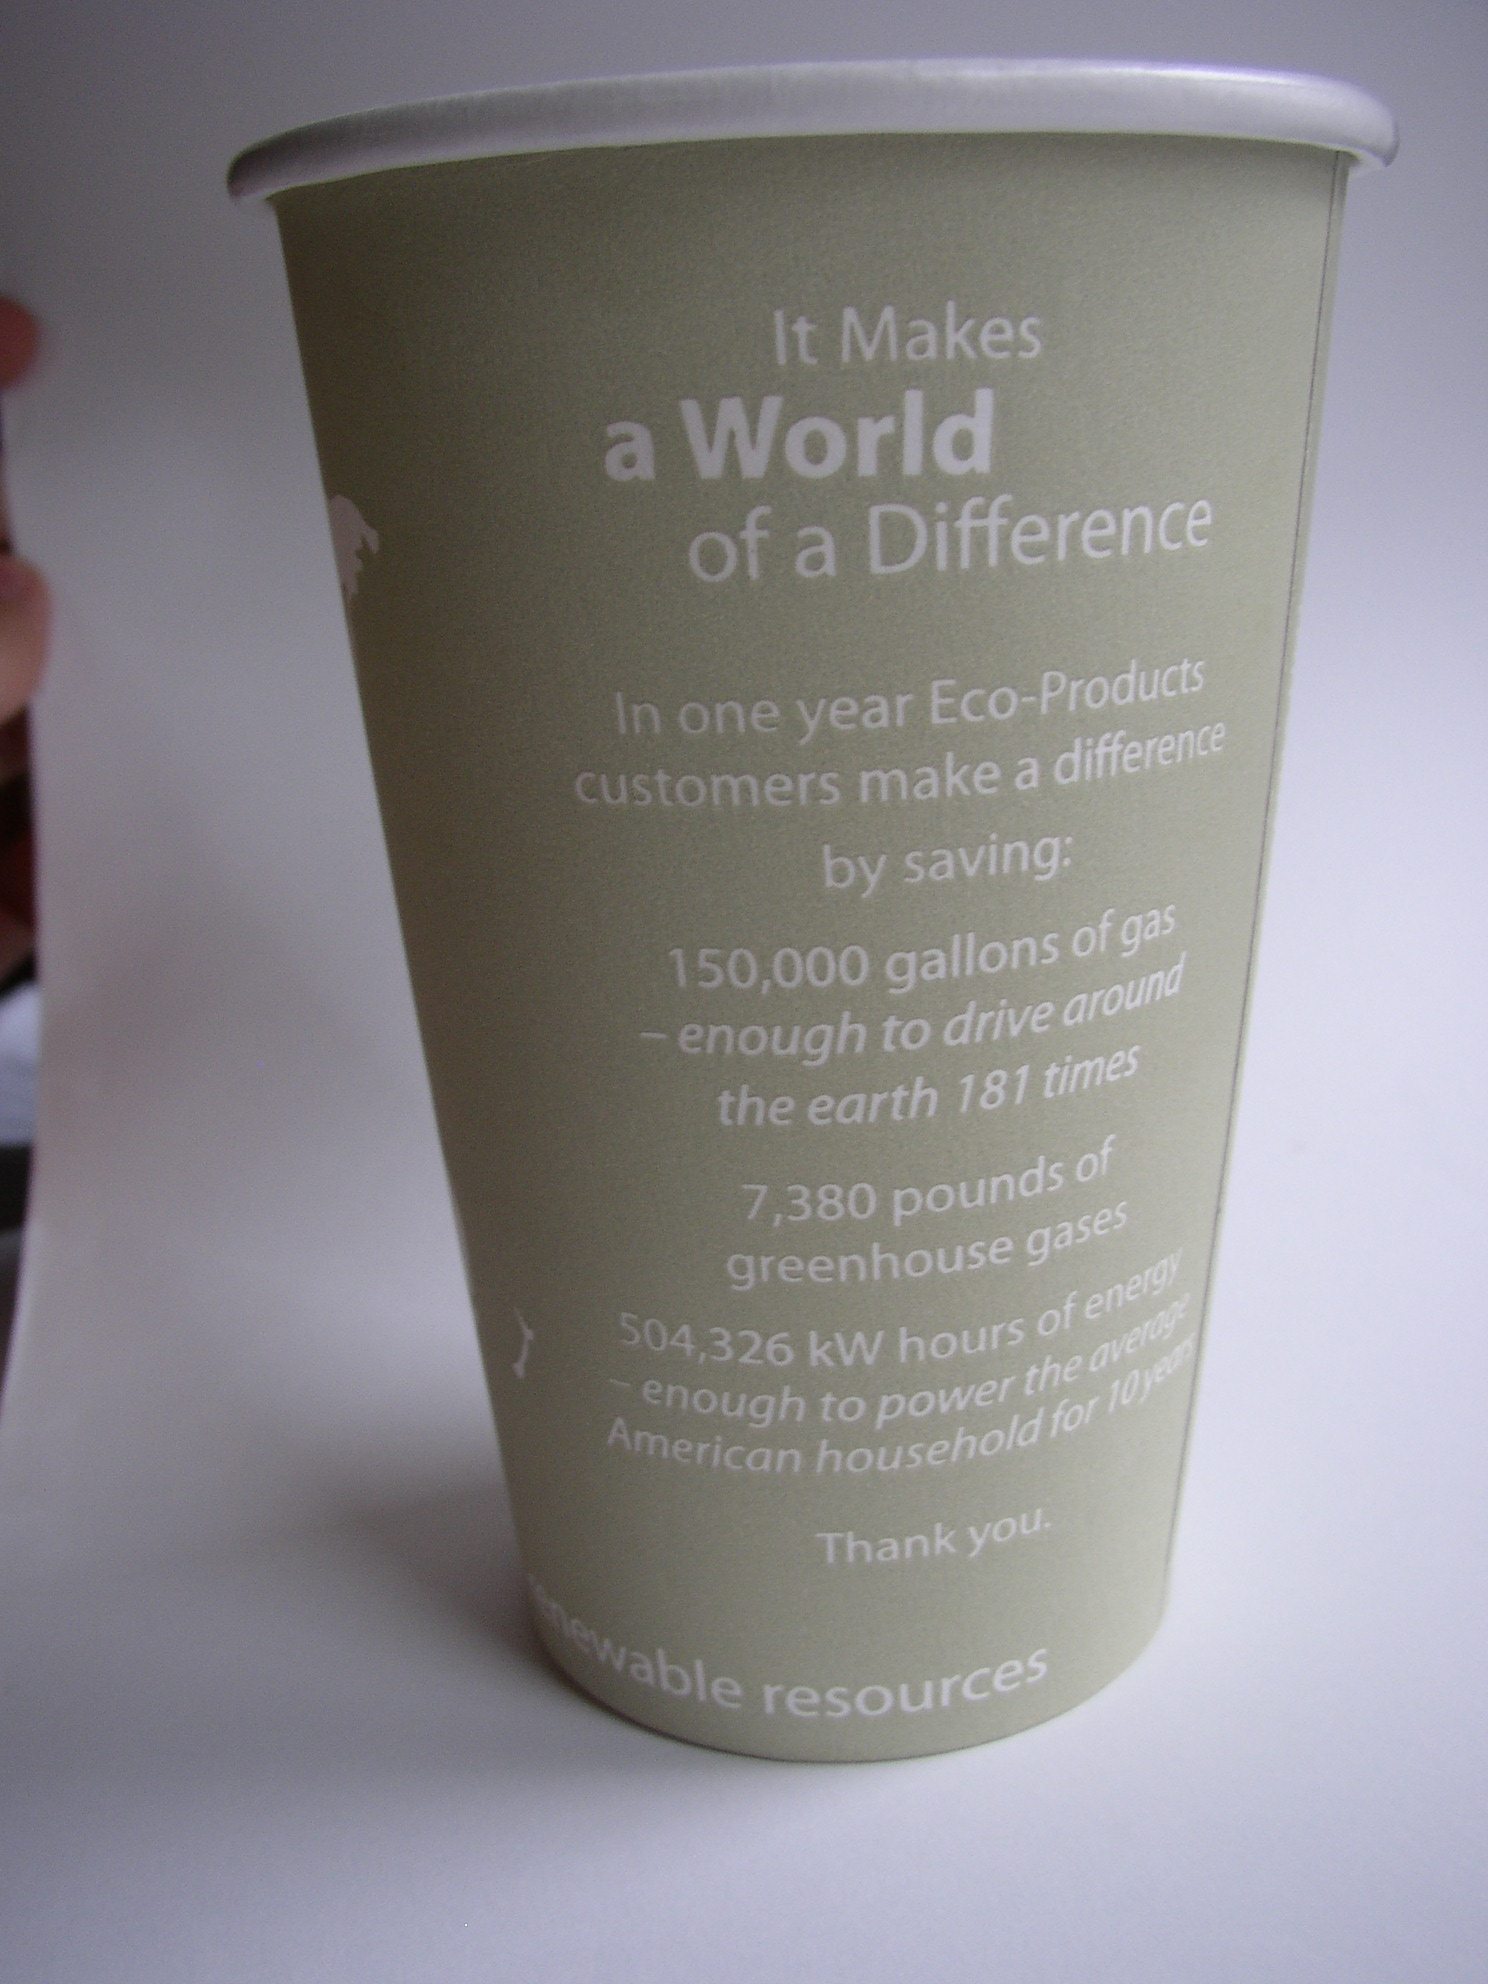
Details on the eco-efficiencies of the company that produced this cup are printed right on it. (Along with an intriguing blank world map: which could lend itself to some sketches to show where the coffee inside came from.)
I’m not sure that many take the time to read the details of eco-efficiencies on the back of the cup- no matter how intriguing they are. However, one thing that really helps is translation from data points into increments that the user can start to comprehend. For example, I’ve no idea what 150,000 gallons of gas means…but by telling me that it’s enough to drive around the earth 181 times, this makes the data more real to me.
By having the ‘world’ on the cup, this could be a unique opportunity to further compare some of the text-based data with the size of the world (for example: how about 181 lines around the cup?, or a sphere to represent what 7,380 pounds of gas would take up [though this may need to be on the scale of a house rather than to the world])
The ‘compostable’ icon under the continents is a start to some nice information design in itself -though this could have been further simplified, or even tied into some of the text on the cup’s reverse.
Overall, lots of potential, but data is left separate from visuals: even when the visuals are ripe with potential.
Cup by Eco-Products Inc.


Thailand Shopping says:
I just needed to take a second and let you know that I’ve been savouring reading your posts over the last few weeks. I have a blog of my own, and would love to switch links with you. If you’re interested just leave me a comment on my page or send me an e-mail with your details.