Projects
Insights
About
Process
Connect
Our work spans many industries and mediums
10+ years of making complex issues “click”
Client focus:
All
Cities, Policies, Government
Climate and Energy
Environment and Conservation
Equity and Health
Food and Agriculture
Our work includes:
All
Animation
Data Visualization
Illustration
Infographic
Publication
Signage
Social Media Graphic
Web Design
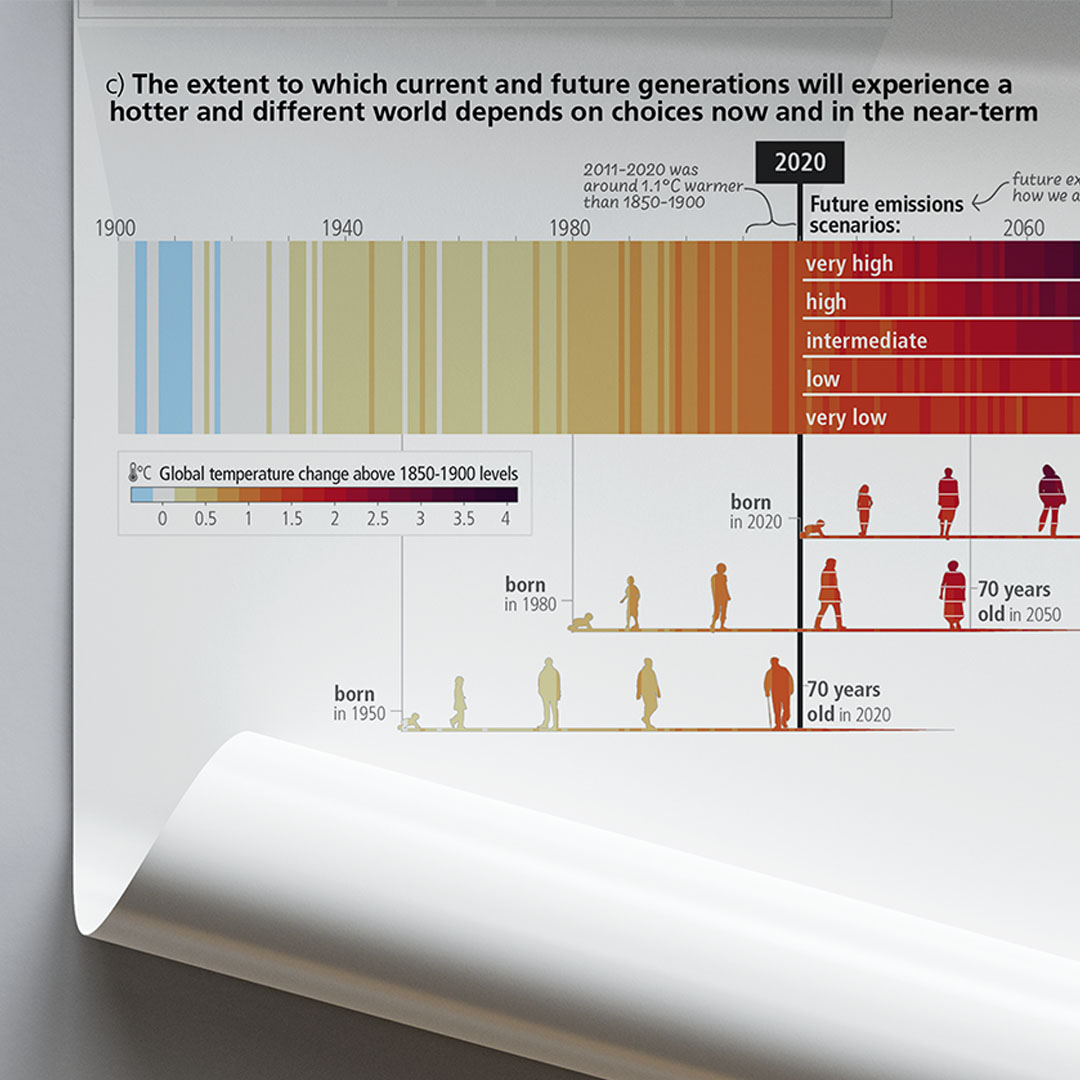
Making climate science visual to policymakers
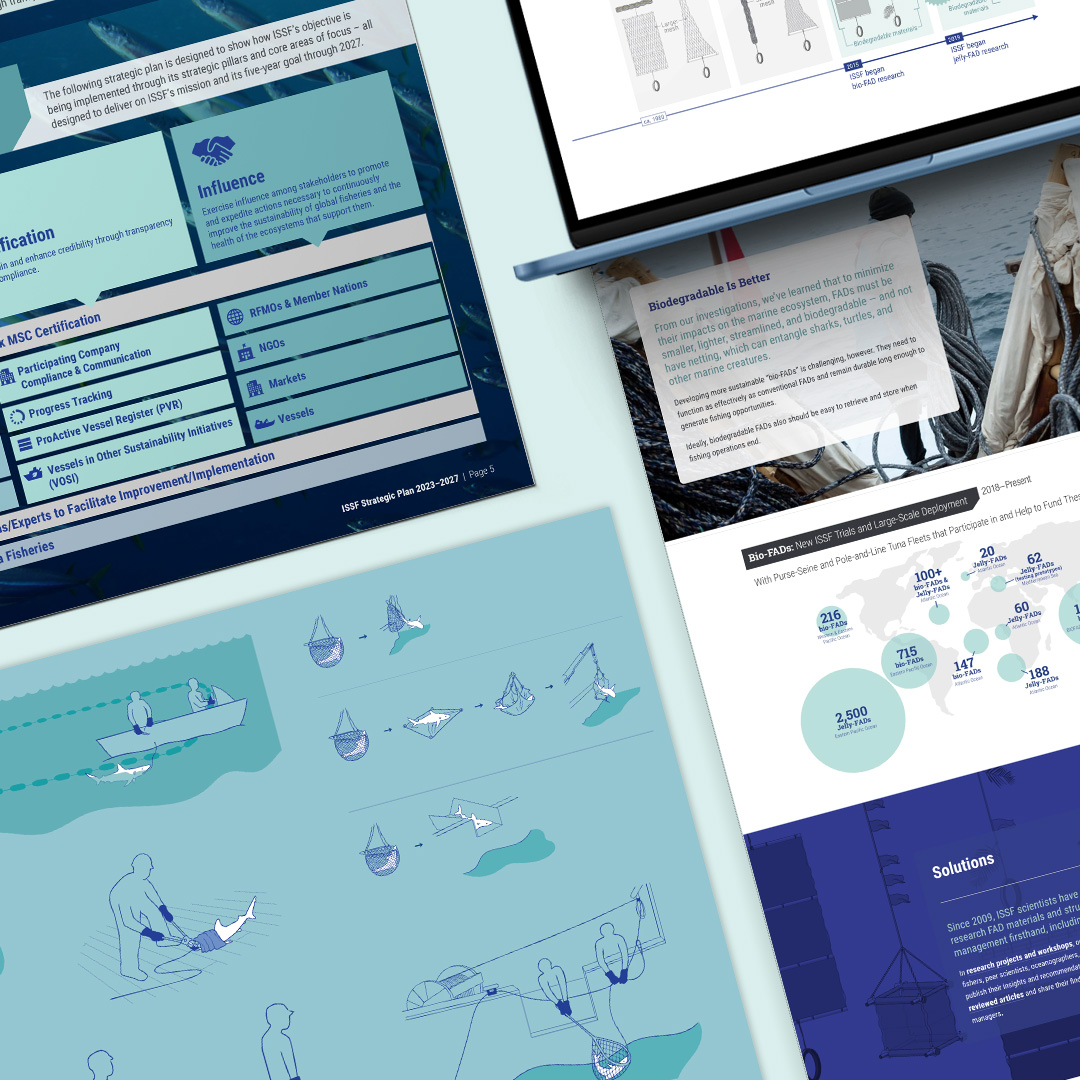
Communicating science-driven fisheries conservation
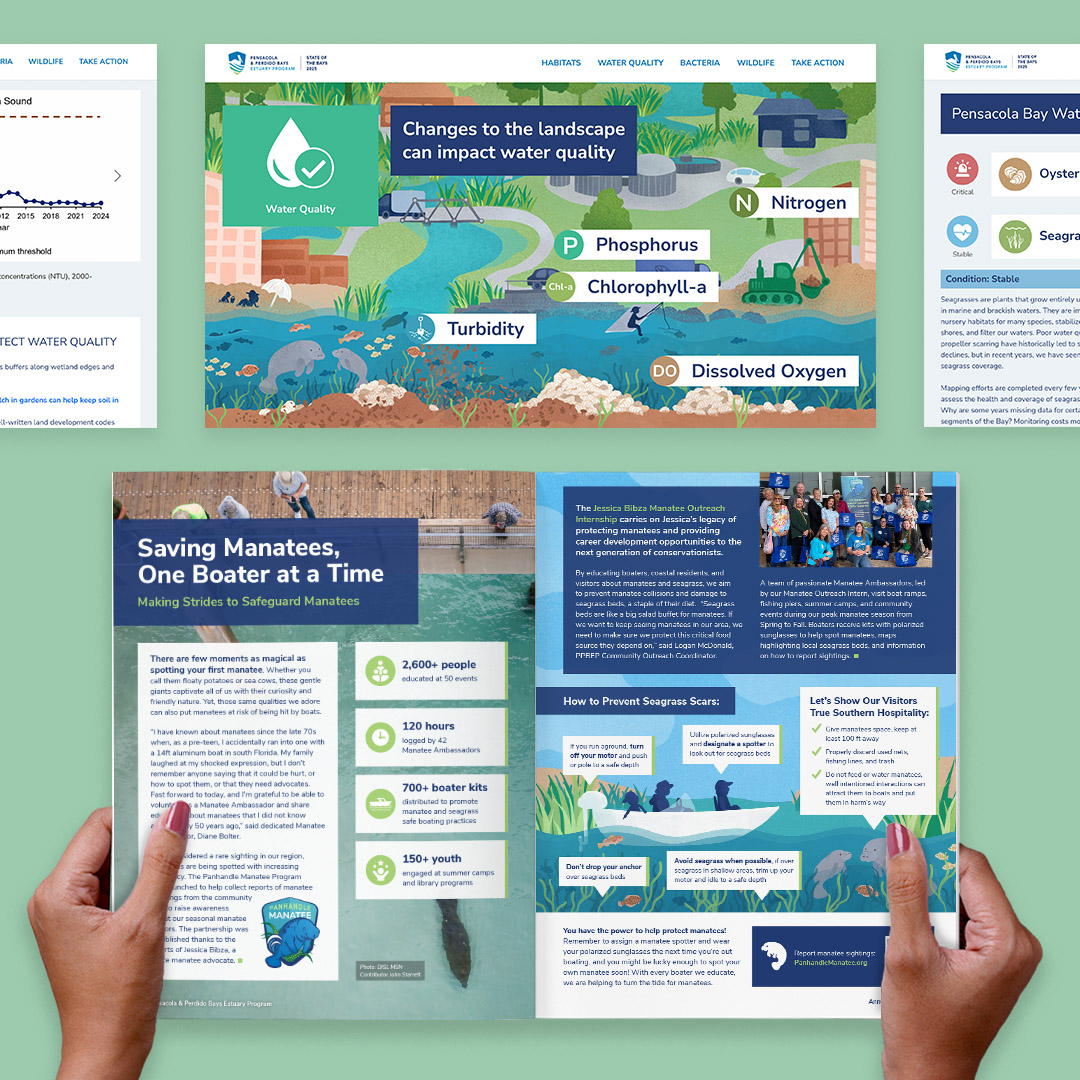
Raising awareness of local ecosystem health
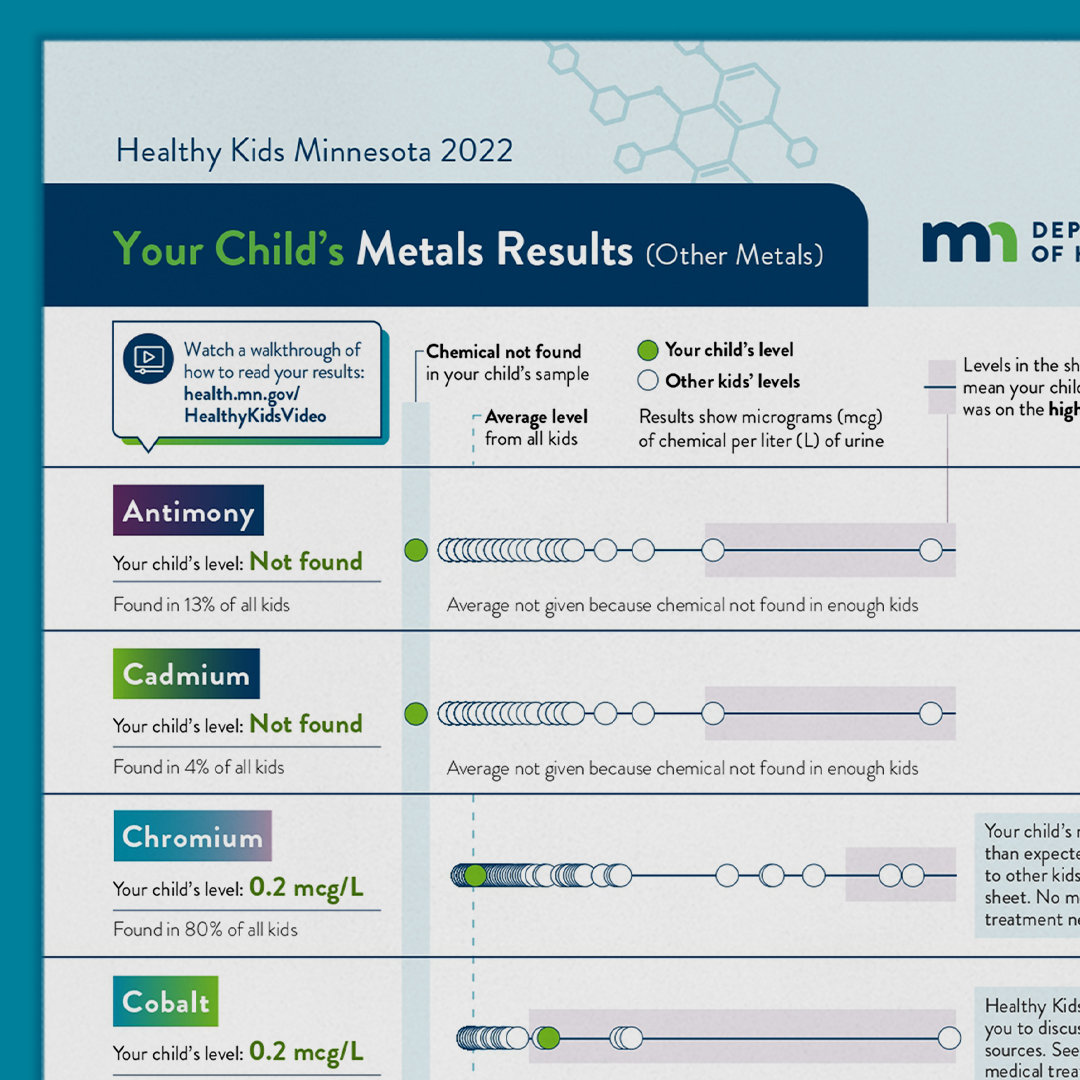
Empowering families with approachable health-result visuals
Synthesizing research on democracy and climate change
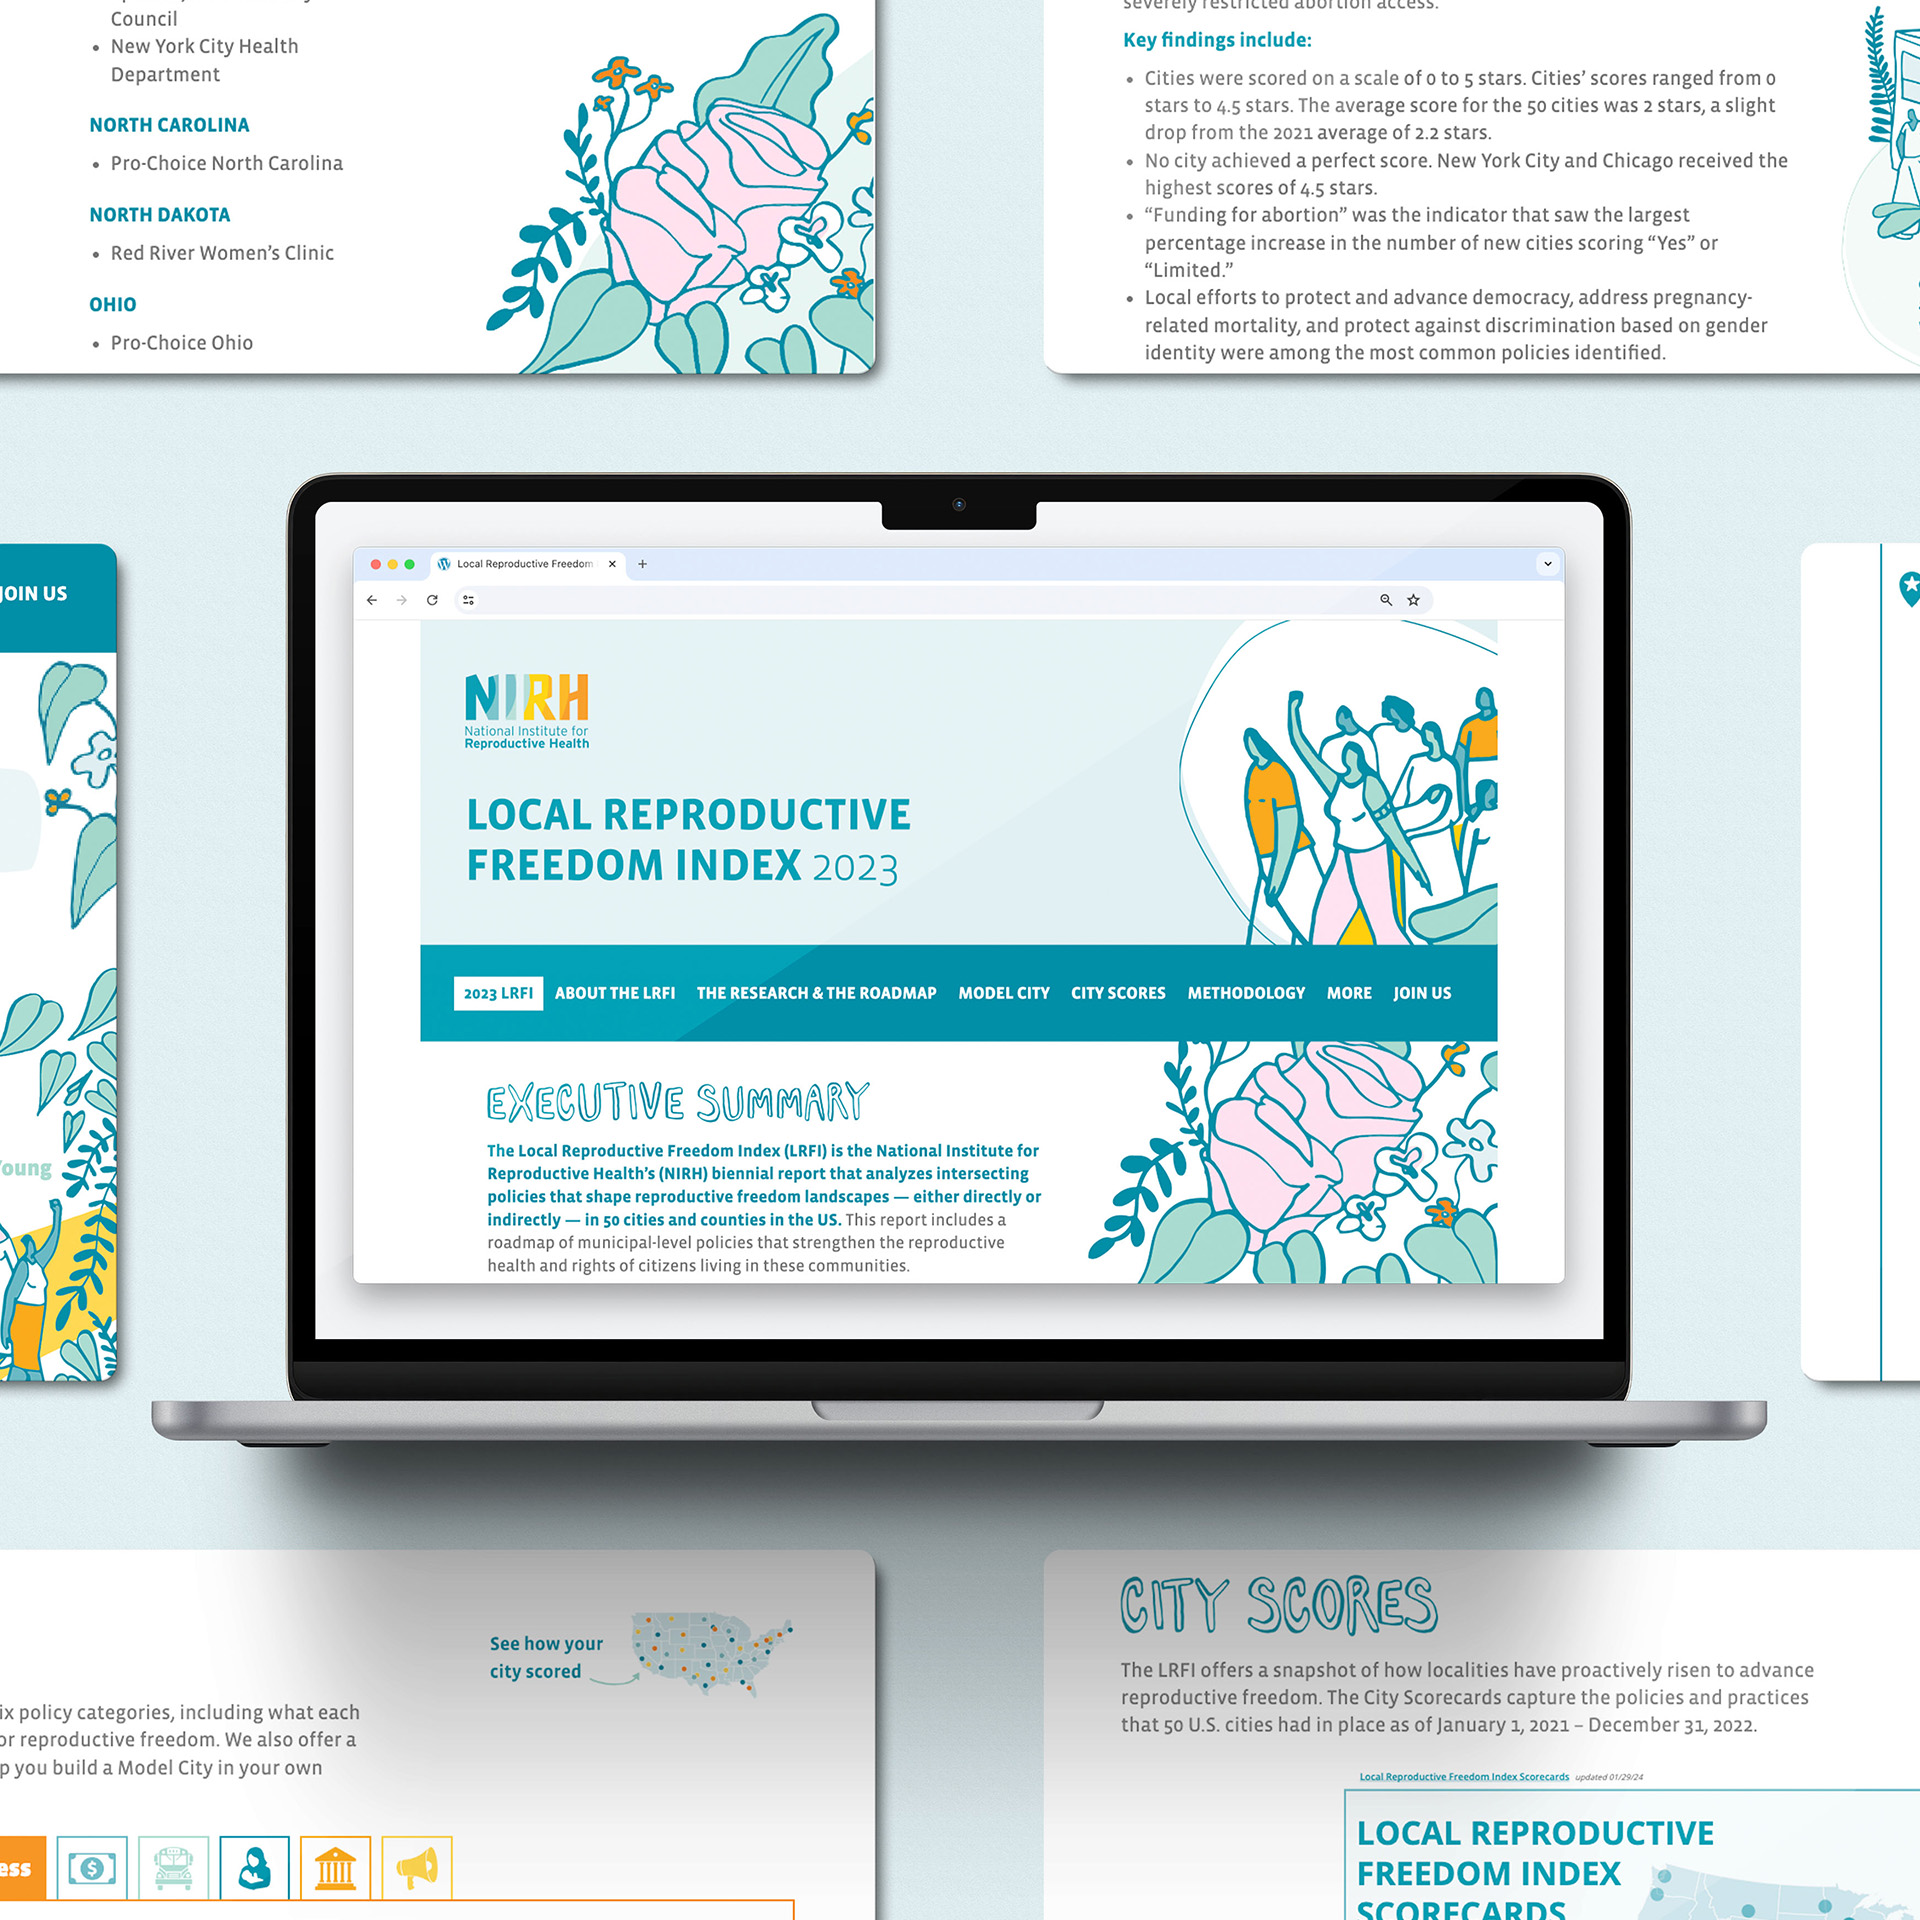
Illustrating the reproductive freedom landscape
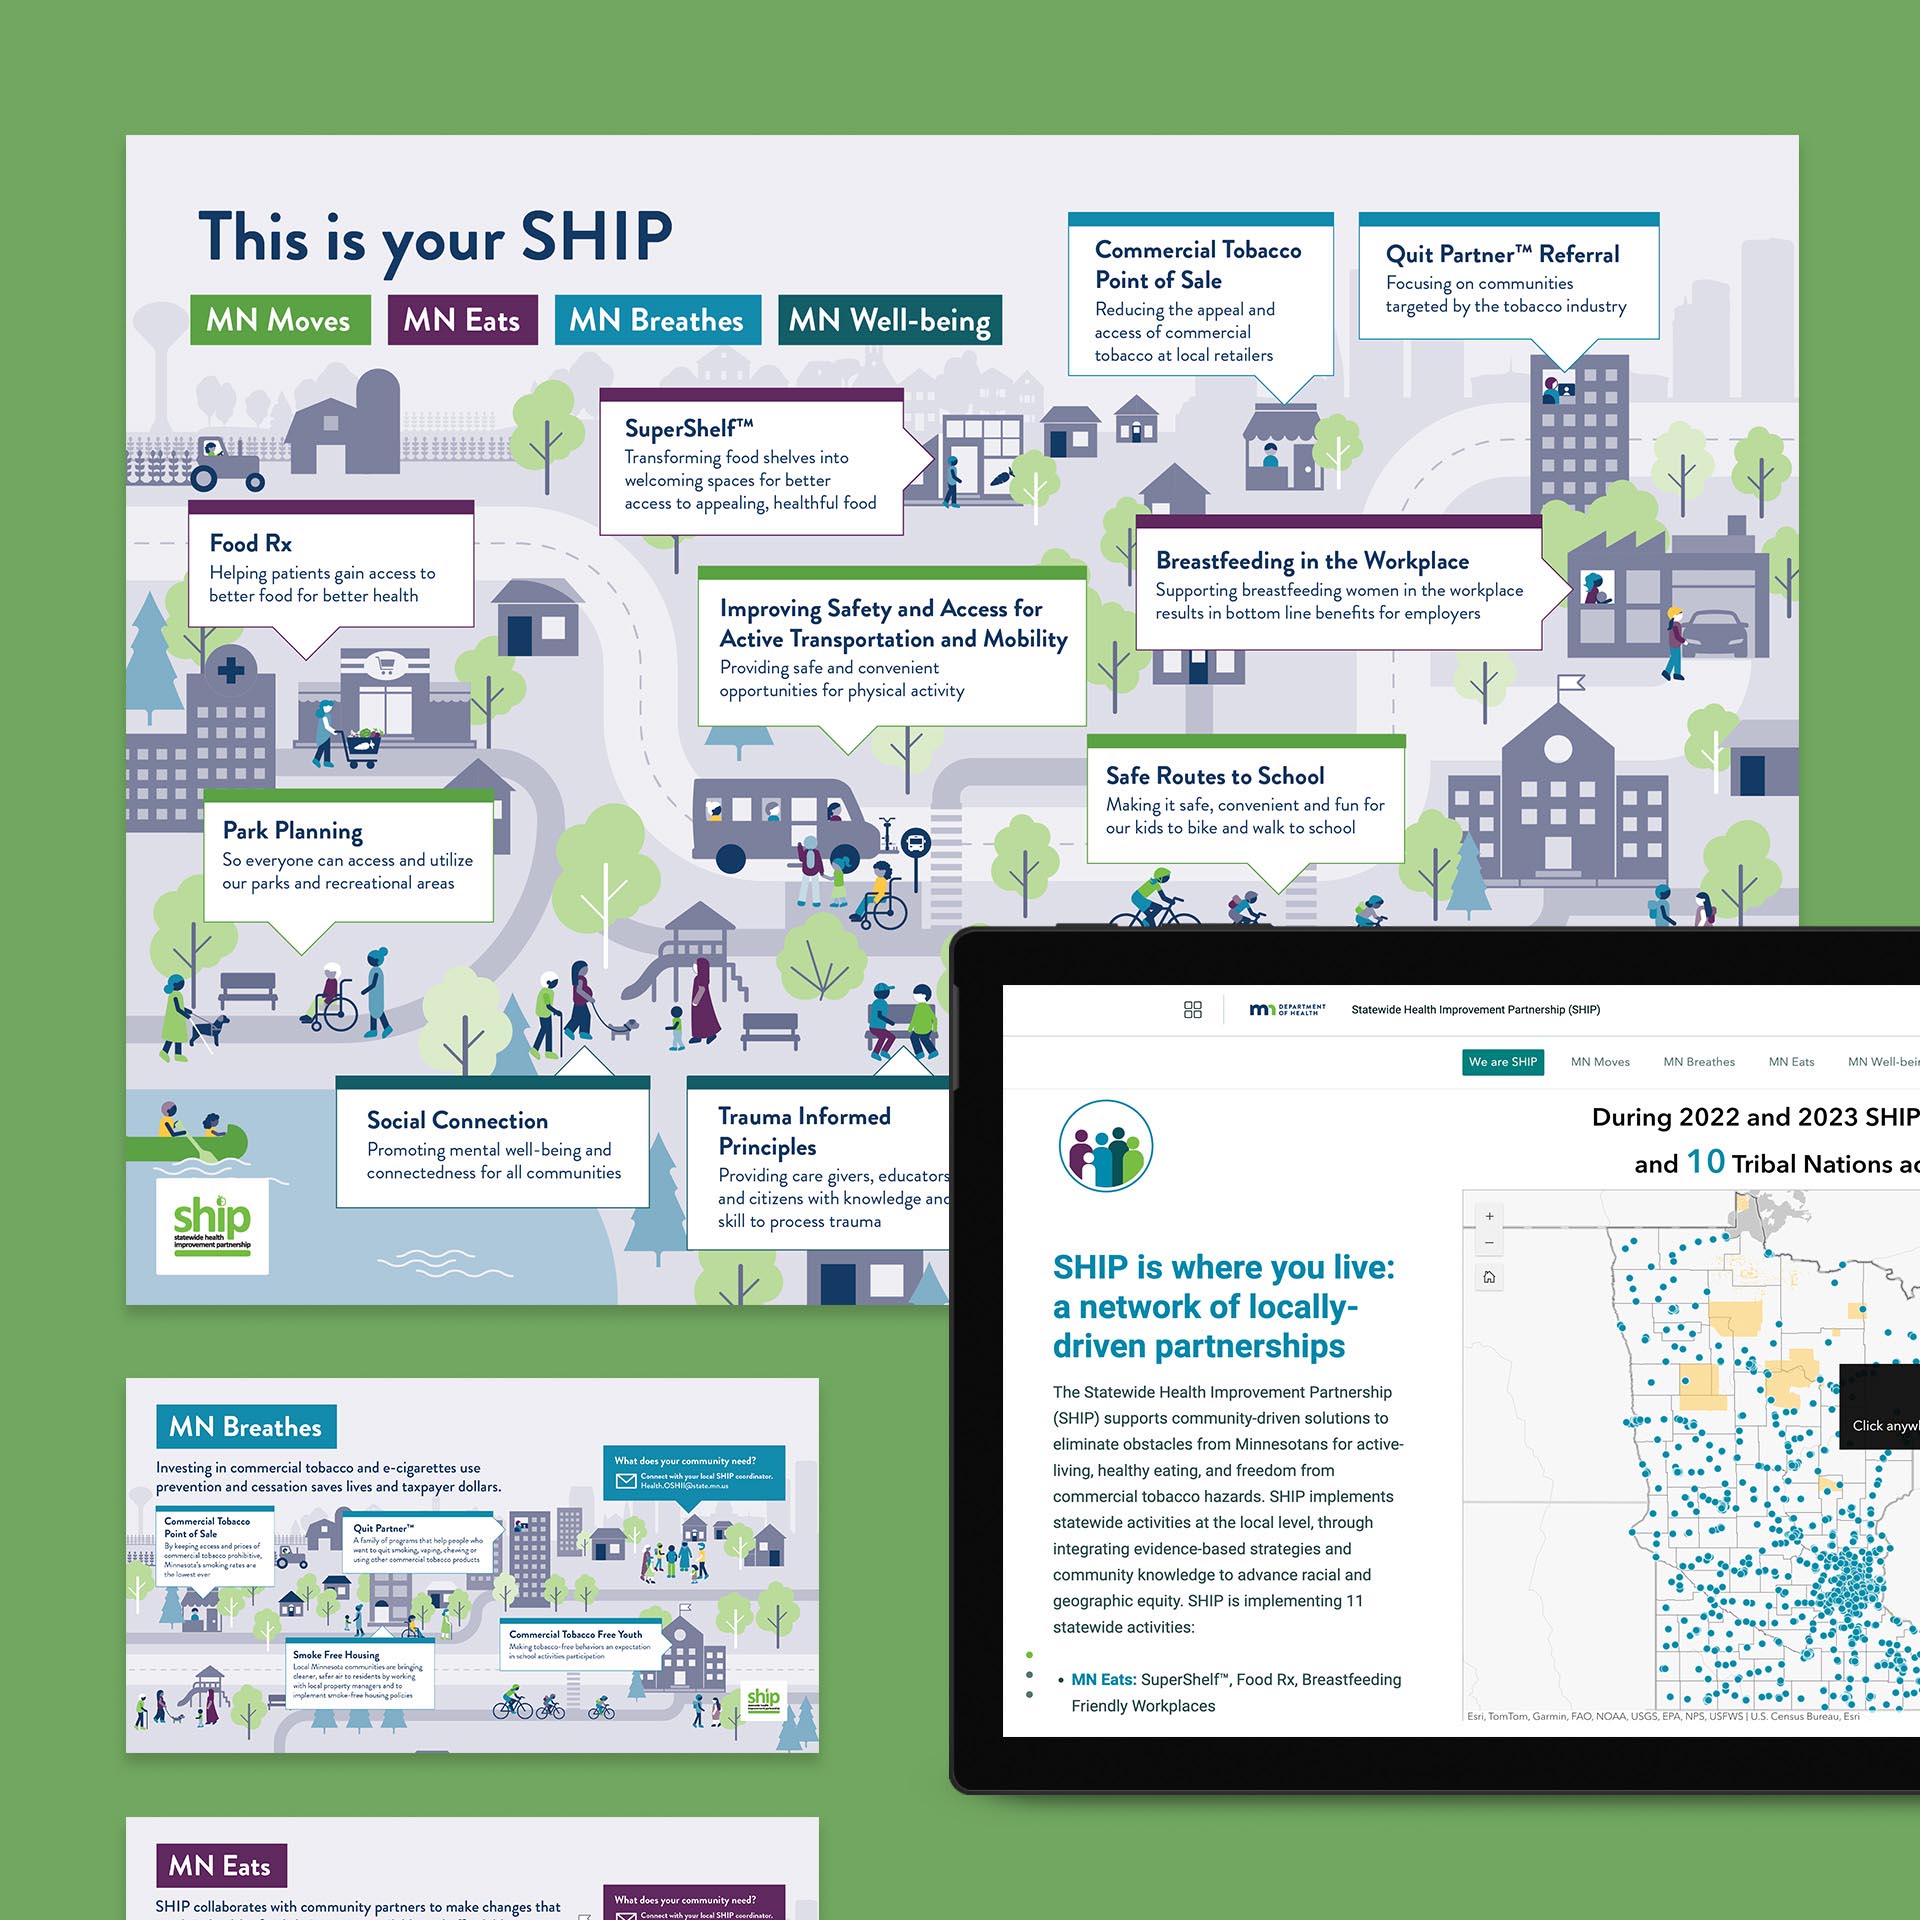
Visualizing the pillars of community health
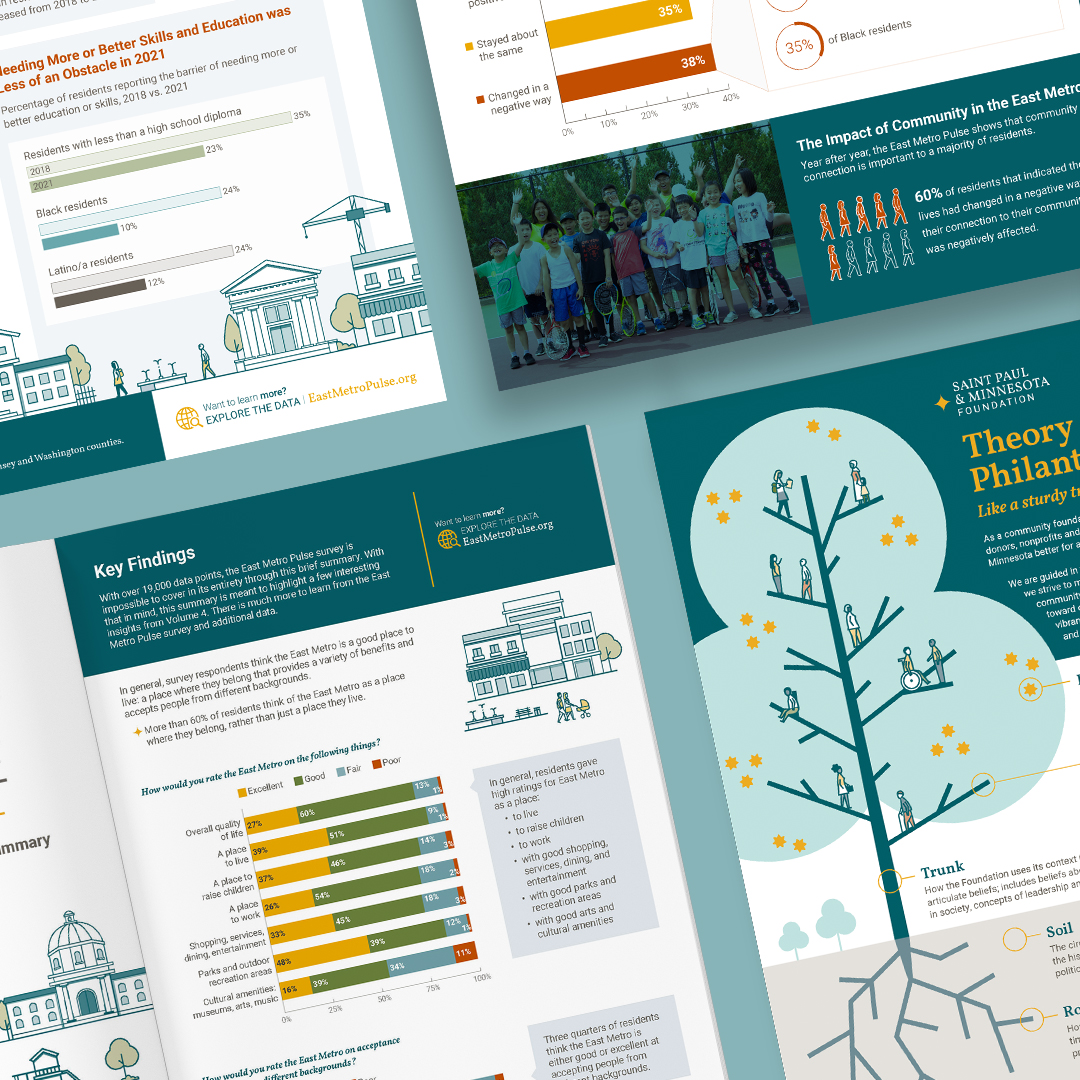
Turning data into dialogue for a more equitable east metro
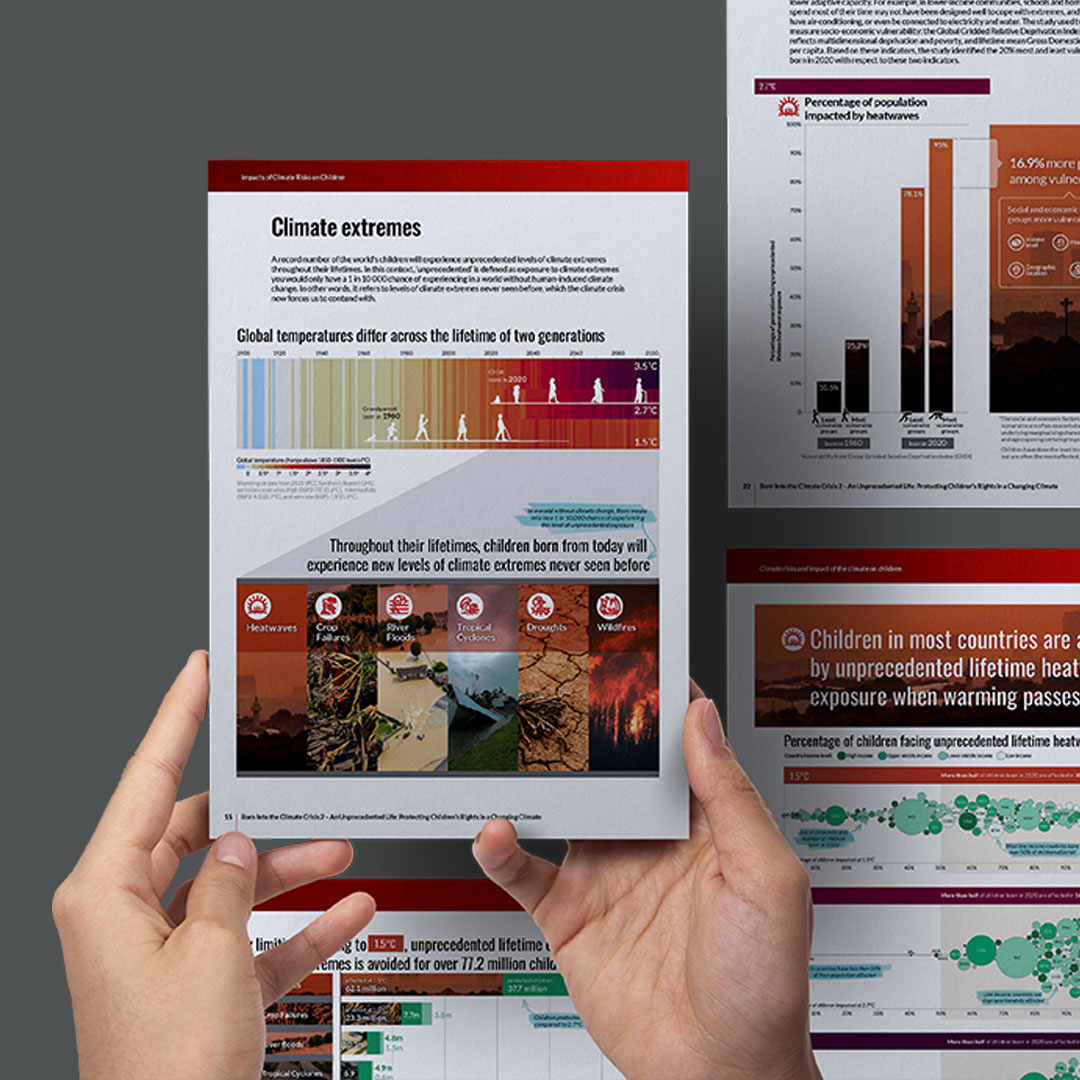
Presenting climate change’s unprecedented impact on children
Using visual language to explain clean energy policies
More