Data visualizations translate complex data into compelling advocacy tools
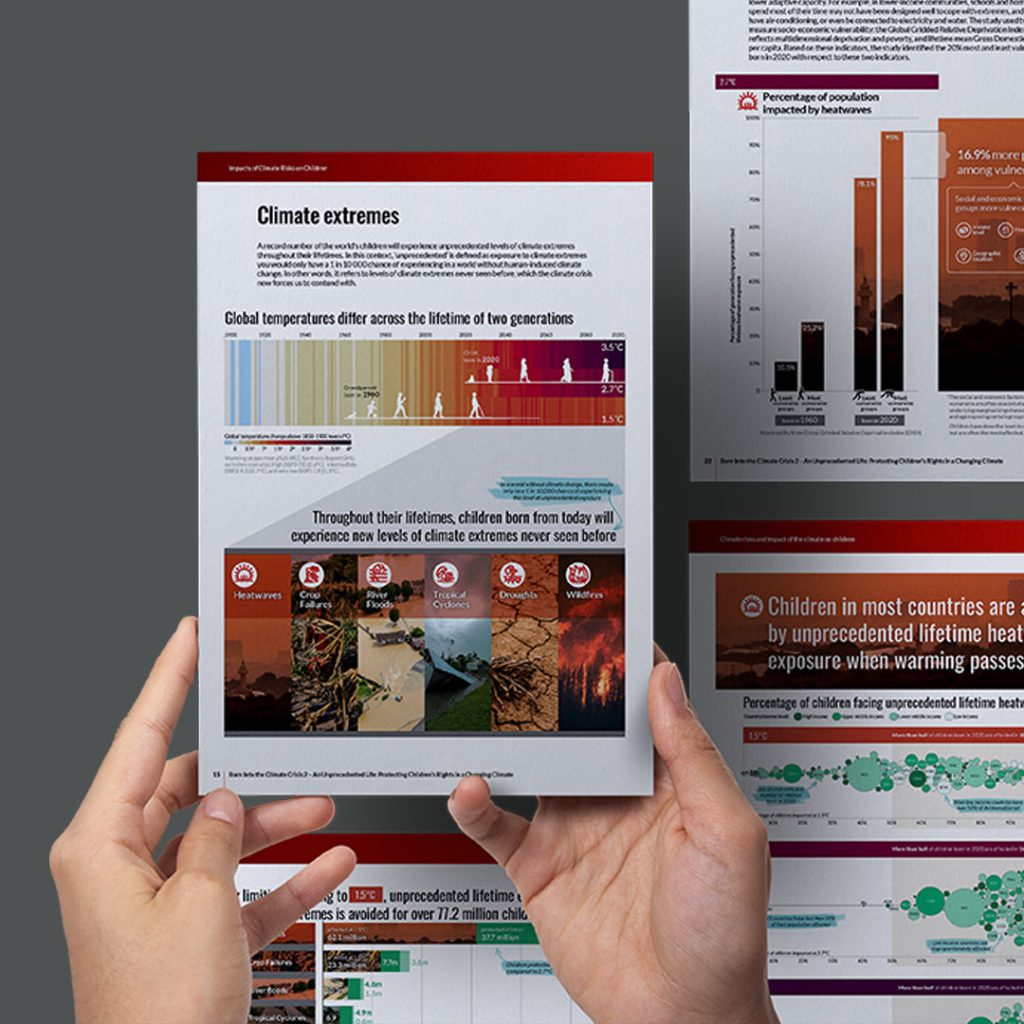
For Save the Children’s Born into the Climate Crisis 2 report, we designed figures that make the stakes of climate inaction—and the life-saving potential of action—clear. By turning abstract numbers into relatable statistics, the graphics show how climate change threatens millions of children and makes the data personal for policymakers and the public alike.
The report was covered by 175+ media outlets globally, and related research published in Nature (featuring adapted figures) has received over 92,000 downloads and ranks in the top 5% of research outputs scored by Altmetric.
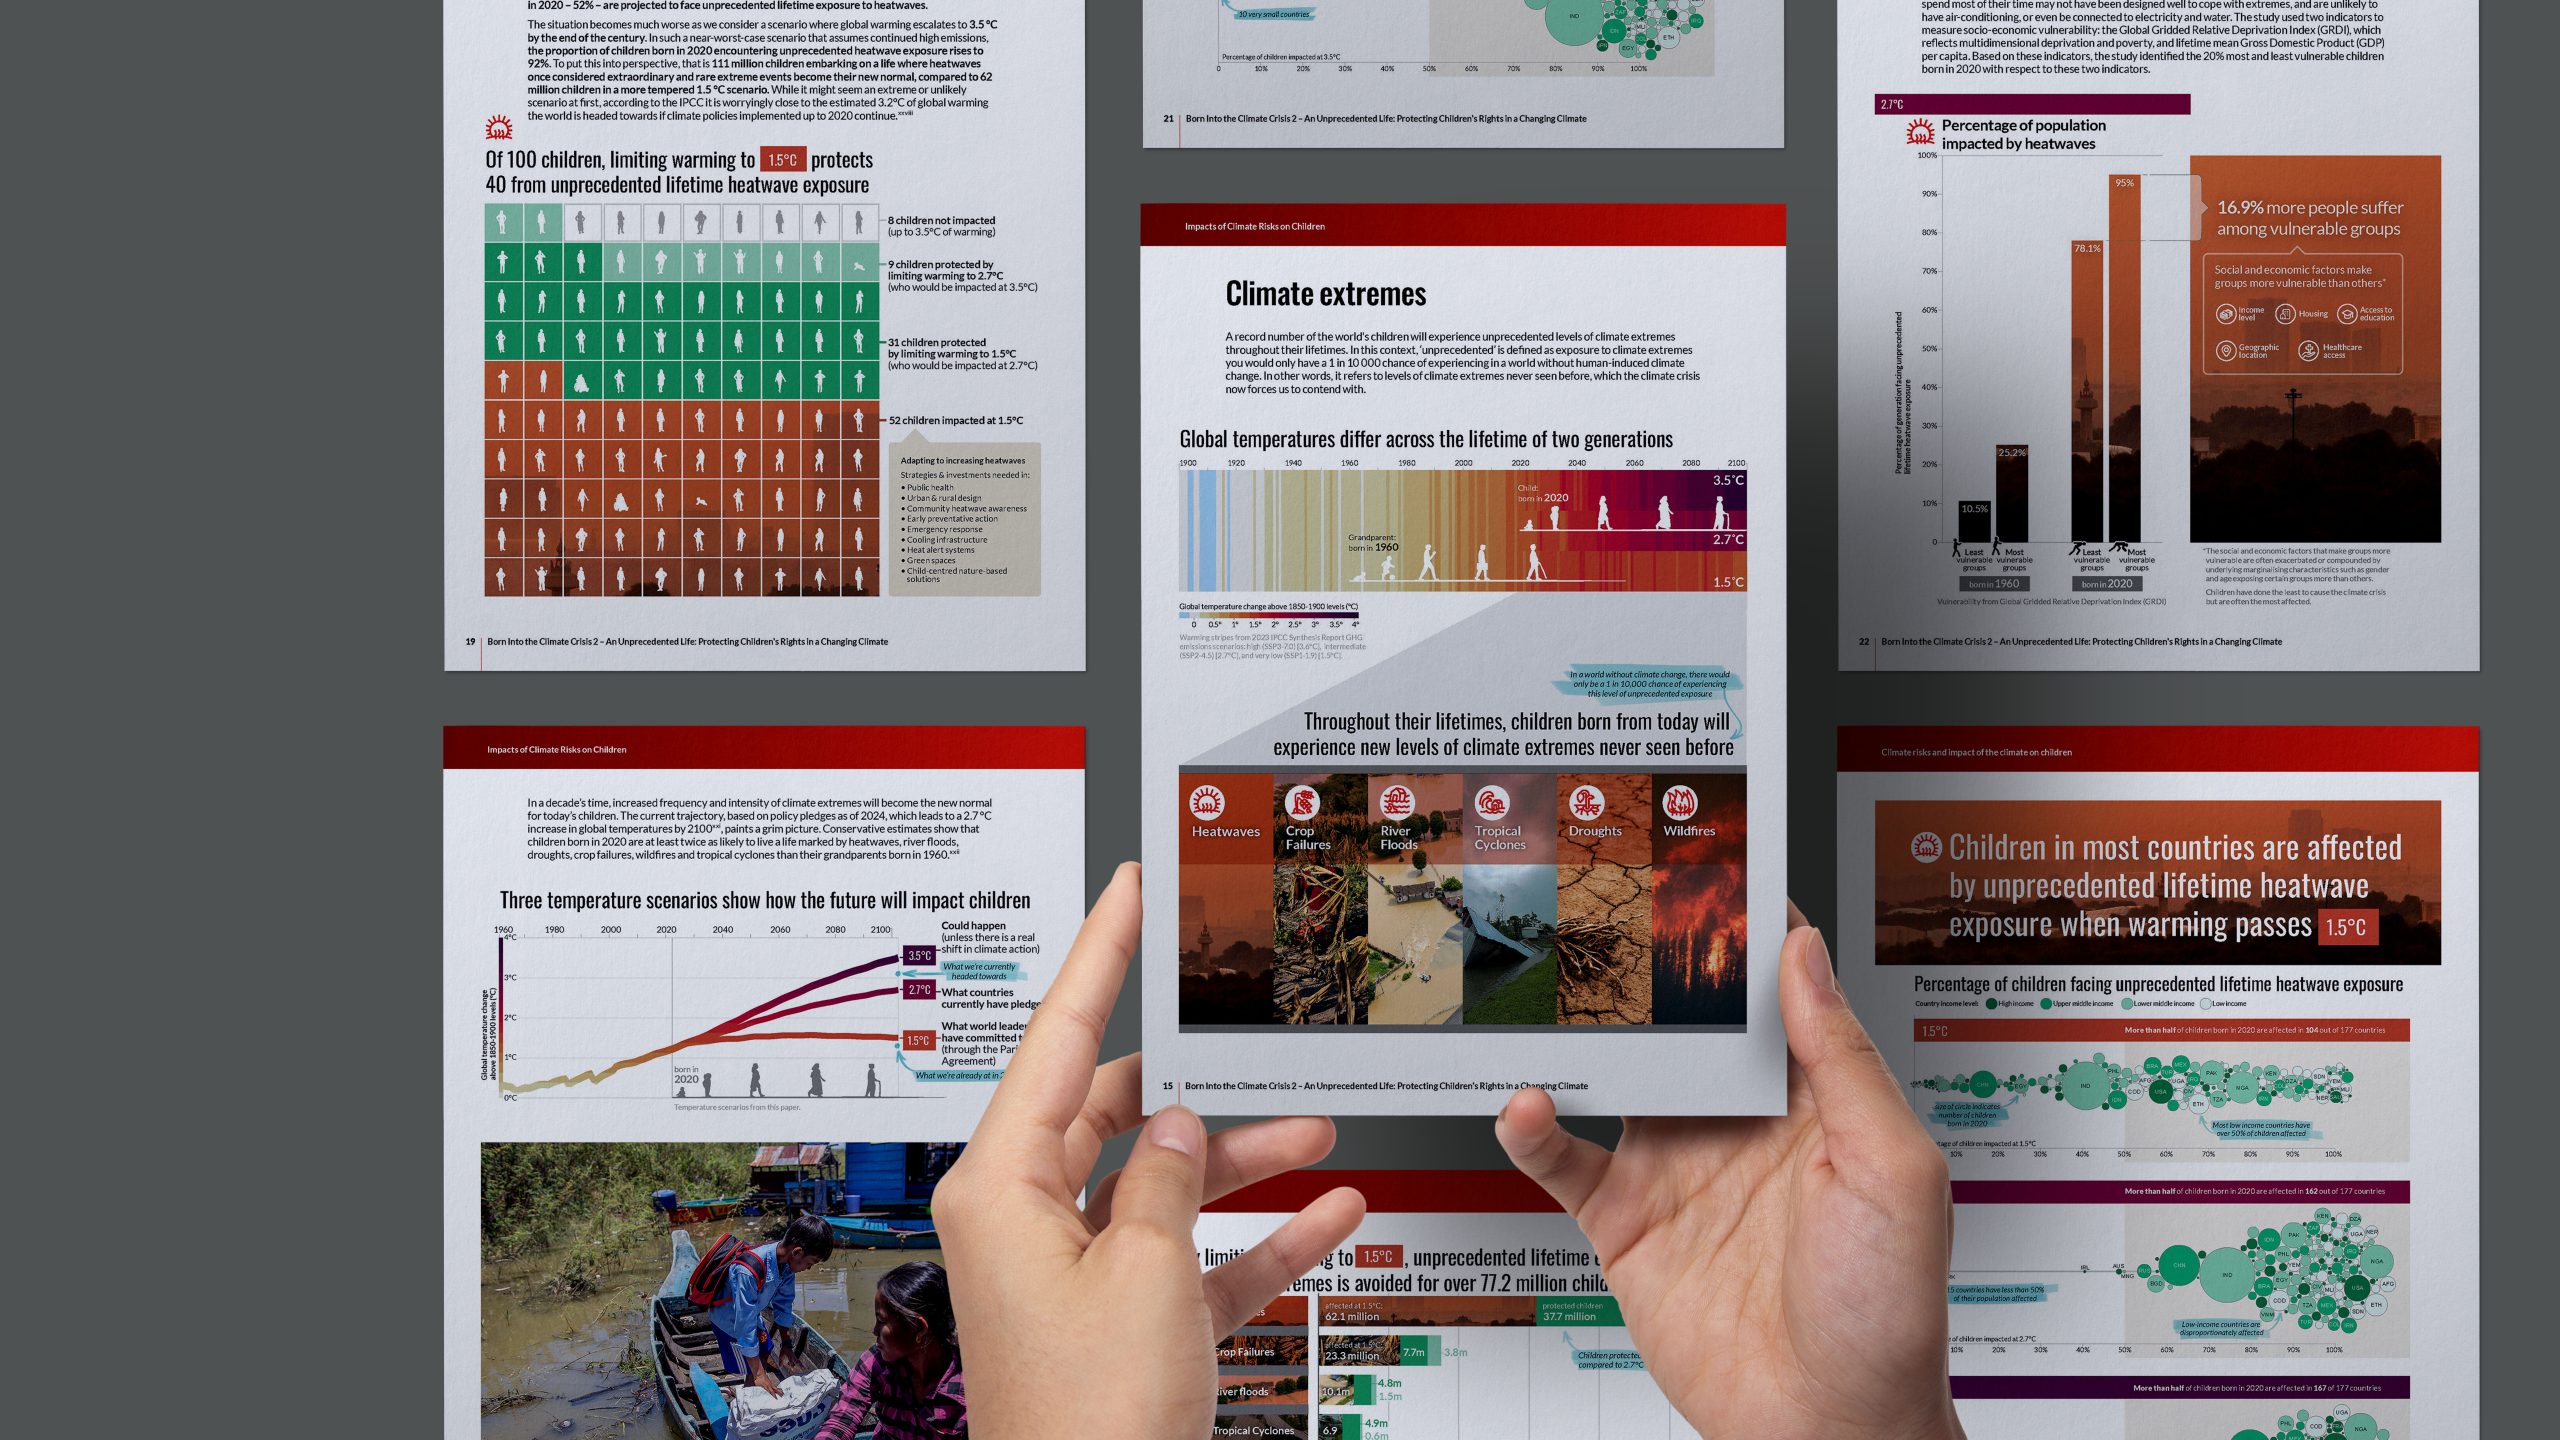
Clear, compelling visuals spotlight the impact of climate change on children and help policymakers, advocates, and the public grasp the scale of the crisis.
The visuals were designed to balance urgency with clarity—making the scale of the crisis feel more personal, while using positive framing to avoid overwhelming audiences.
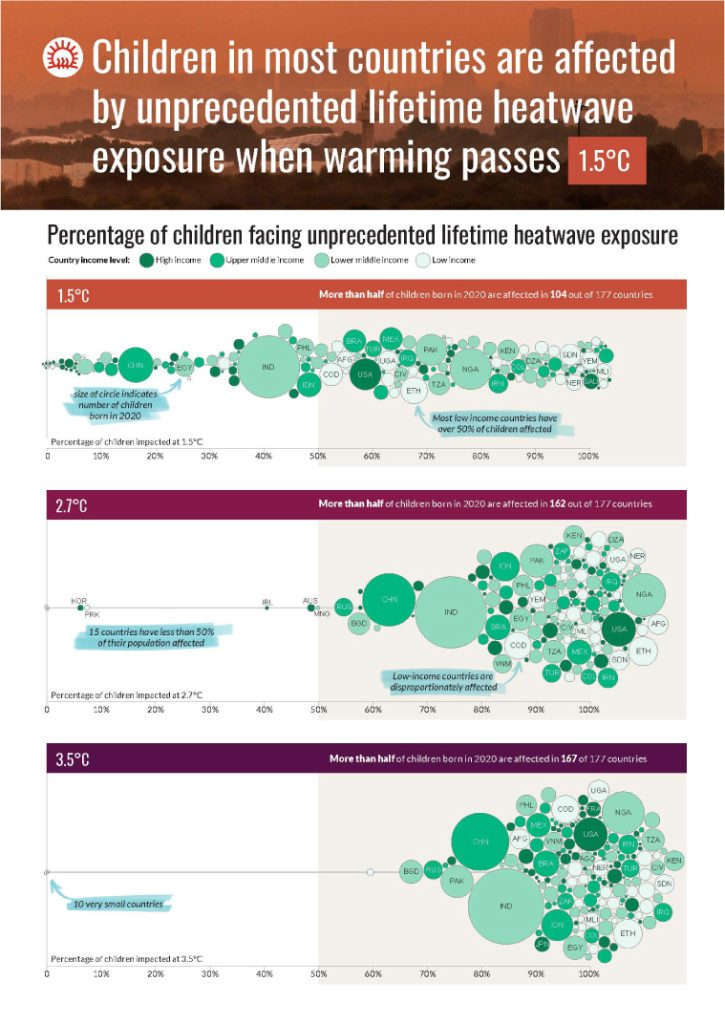
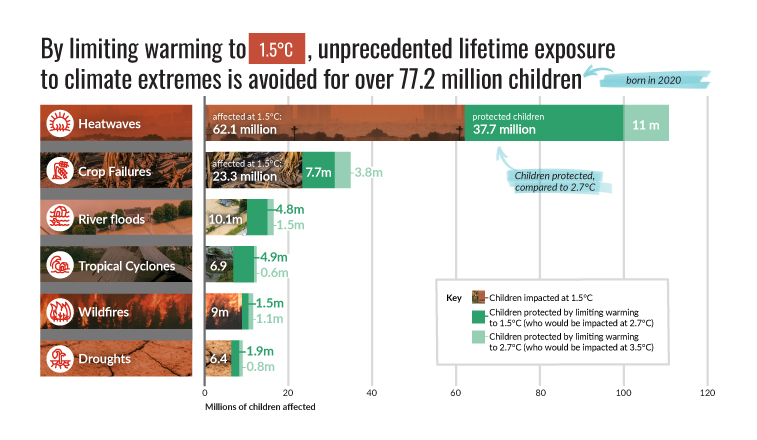
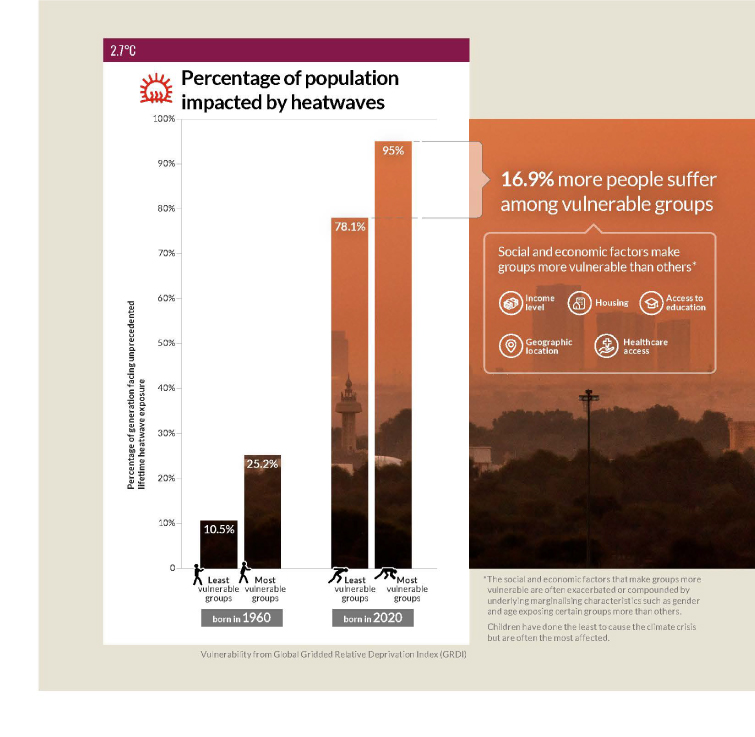
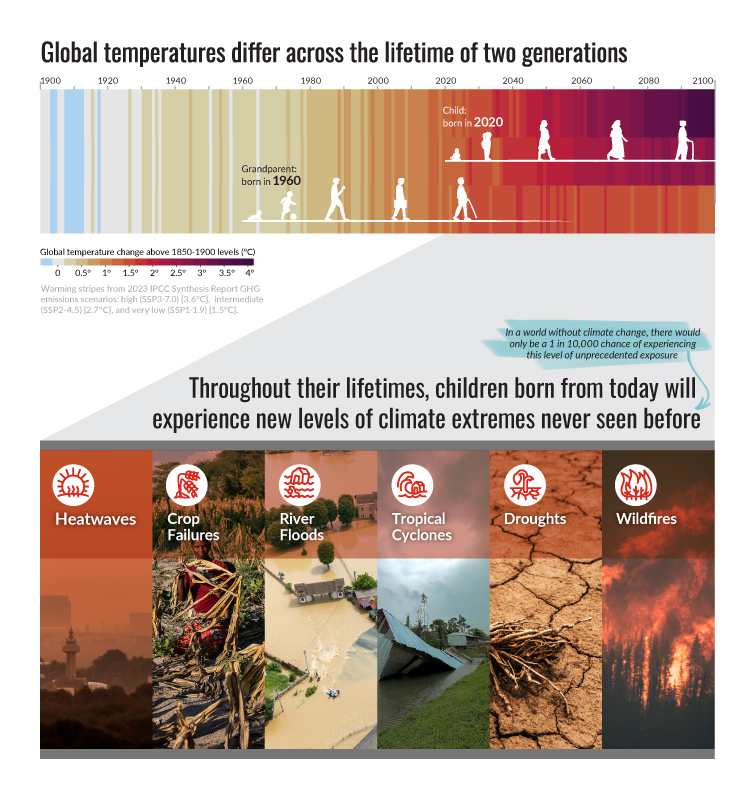
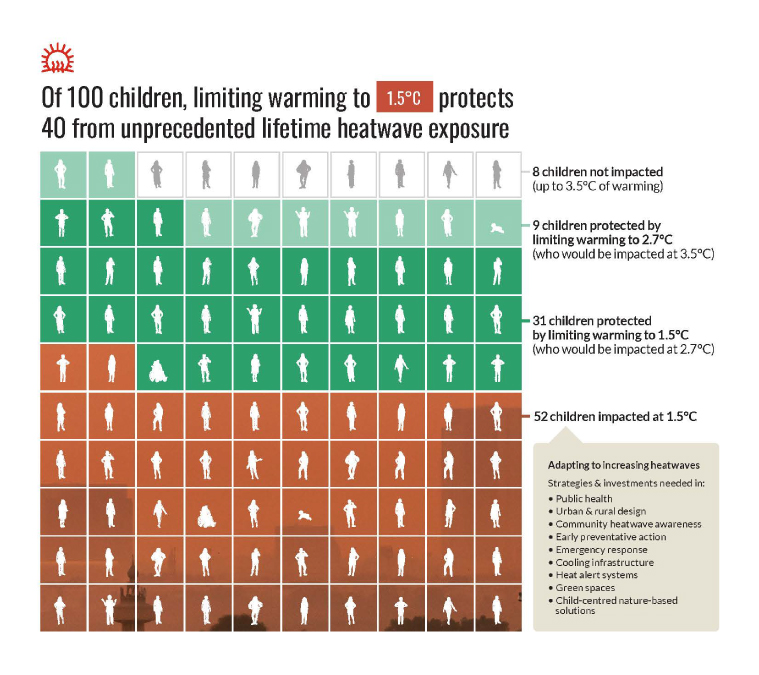
These visualizations interpret complex climate data into human-centered narratives that support understanding and decision-making. By framing impacts through groups of 100 children and across generations, the work makes global projections more tangible and personally relevant.
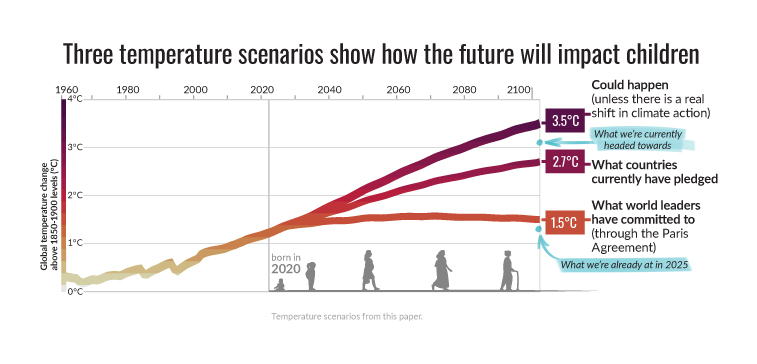
Building on visual approaches we developed for the UN IPCC (the generational climate stripes), the designs compare warming scenarios over a child’s lifetime. Plain-language annotations guide interpretation, balancing urgency with clarity while highlighting both risk and the life-saving potential of action.