Timberland

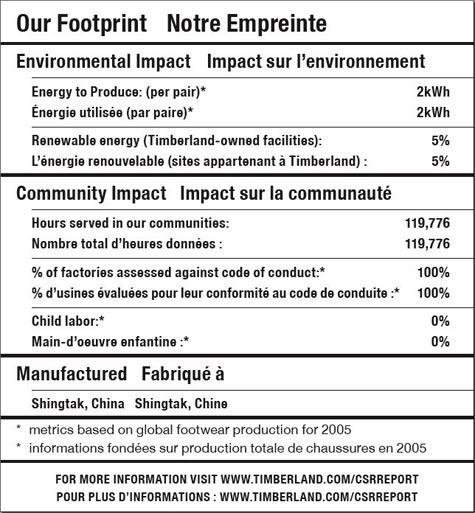
Timberland footprint label

This much-hailed label from Timberland was one of the first to label a product with details on the social and sustainability footprint of the product. It was a good start, but not nearly the level of detail that is possible – nor the level that consumers are clamoring for.

It’s a laudable first effort — in theory, at least. In real life, it’s not very helpful. Simply put: there’s less going on here than meets the eye. –Timberland Reveals Its “Nutritional” Footprint, Worldchanging

Though approachable because the label is created in the format of a nutrition label, beyond that, it’s not very visually satisfying. More depth and emotion could have been portrayed had they gone more into infographics.

Water that Talks

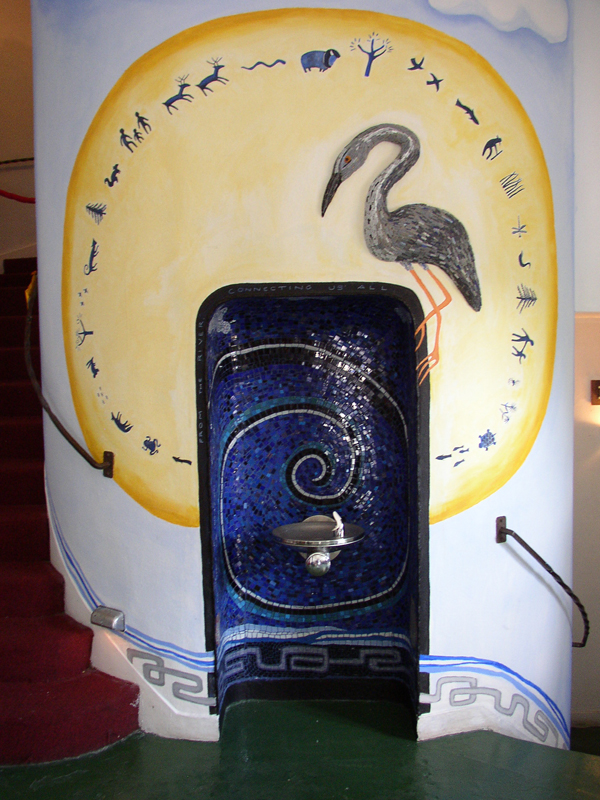
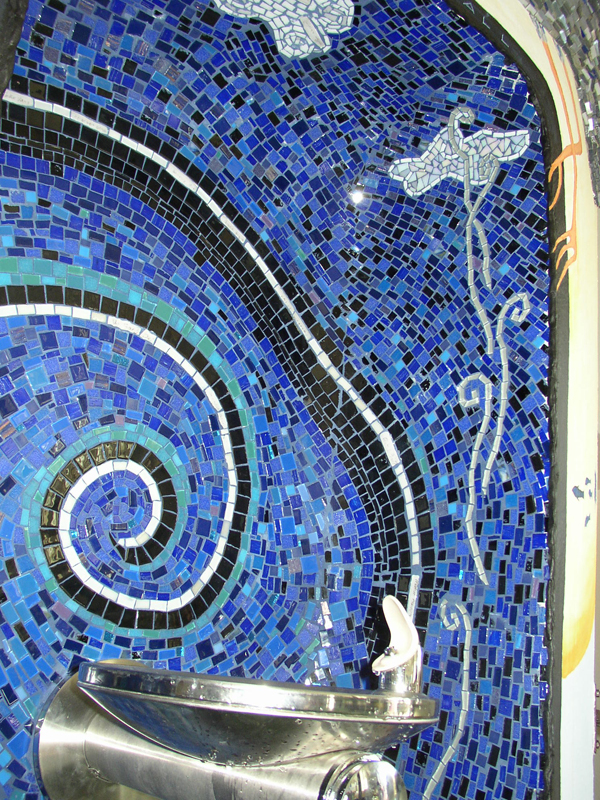
Water Fountain Alcove Water Mosaic

Heart of the Beast theater in Minneapolis held a festival to welcome the water back into the lobby. – For years, the drinking fountain in the building’s lobby had not been functioning. To support their belief that water should be a clean, free and part of the public commons, the theater has focused on water-themed programming to raise funds to repair their fountain. And at last, what a fountain it is.

This is an example of a background story taken to the forefront: the mosaic visual magnificently overwhelms the source of initial inspiration. This is fitting as the concept the theater highlights is that water is the source of all life: direct from mother earth herself. The mural haloing the fountain quasi-indicates to the spirituality surrounding water.

If not entirely straight-forward, the visual illustration allows the viewer to create their own story about water: Whether that story is a quest for spirituality, native tradition, or catalogs the historical significance of H2O.

CNN BackStory

CNN BackStory screengrab

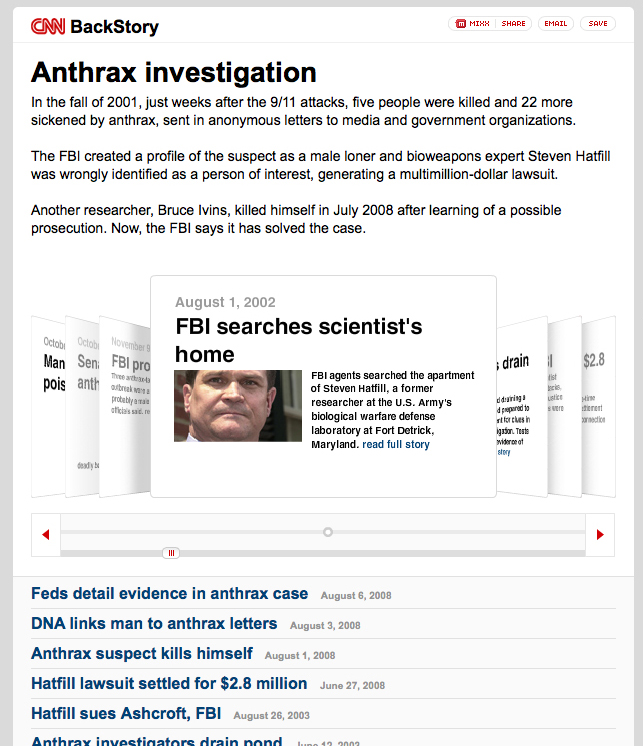
CNN has launched a new application to show how a story has developed over time. This is basically a collection of all CNN-posted stories associated with a particular event. The example they give is the Anthrax case. http://behindthescenes.blogs.cnn.com/

This allows readers to easily dig into the recent history of a story. The impact of a news service that offered such a view into history -AND incorporated stories from other key news media (CNN, BBC, and New York Times for example)- could be extremely powerful piece of online media to showcase varying perspectives. It will be interesting to see if partnerships emerge in this area – also incorporate other online media (video in addition to text-based stories).

Apple Card

Greeting Card with graphic of Apple life-cycle

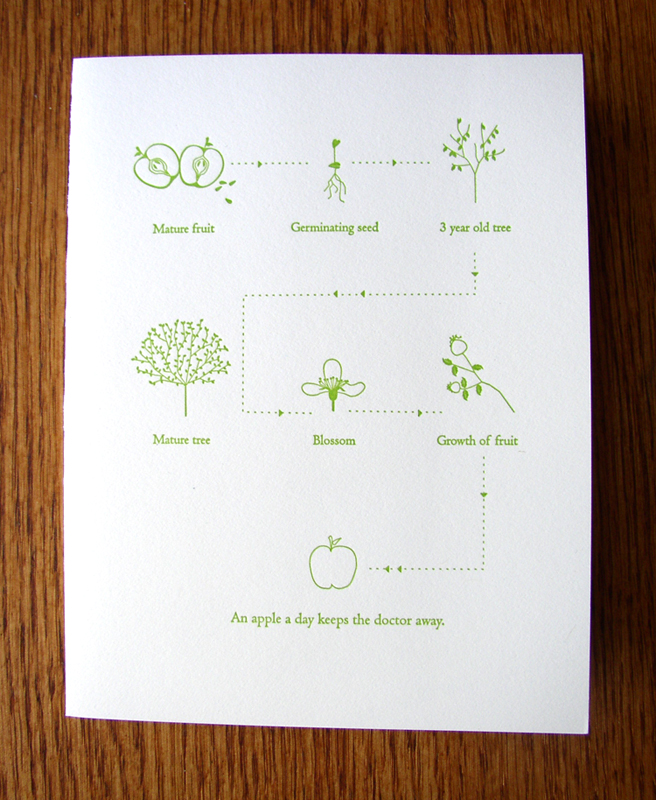
If an apple a day keeps the doctor away, this card is worth an entire year doctor-free.

The graphic on this greeting card describes the life-cycle of an apple seed/tree/fruit. The scale of each element is irrelevant because segment of illustration concentrates on the most important component of that part of the cycle; giving the viewer the appropriate zoomed-in or zoomed-out view.

The key words are a bit redundant (especially “Blossom”). Without these words the viewer would still understand that the story is about the cyclic growth of the apple. However, if the subject in question were more complex or unusual than the common apple, keywords would become essential.

Take it one step further: imagine how the graphic could get even better connected if the paper its printed on was made from apple tree pulp…then embed an apple seed inside so the disposal of the card grows another tree. The graphic could then expand to include the tree trunk’s second life as this card.

Card by Pancake & Franks.

Patagonia’s Footprint Map

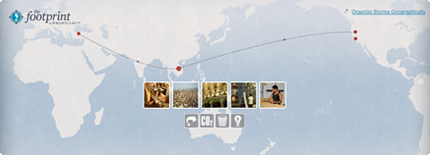
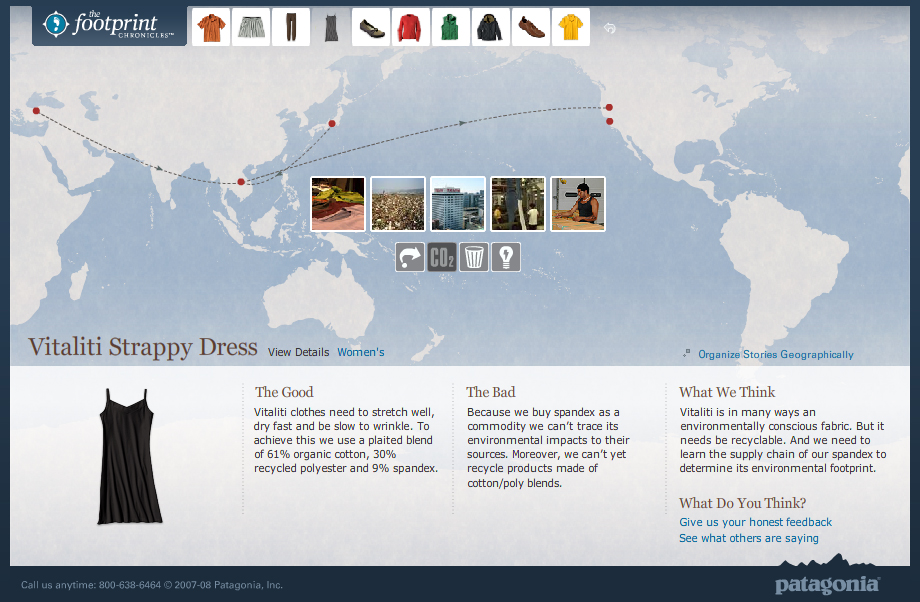
Footprint ChroniclesTravels of a Patagonia Dress - Footprint Chronicles

Companies are increasingly able to track the life of their products through their supply chains and trace the origins of even the smallest notion.

Patagonia’s Footprint Chronicles outlines the potential for a company to unveil its transparency in the name of promoting sustainability (and hence, appearing as a sustainable company). From an information standpoint, Patagonia is open about “The Good” and “The Bad” – admitting that, like any human, they’re not yet perfect, but they know where they need to improve.

The online tool carries the viewer through design, materials, manufacture, distribution (among others) of a handful of the company’s products, allowing the user to explore info both sequentially or geographically. Based on google-esque maps, the tool is well-designed as both a piece of information design and as an interactive tool.

Though included are a handful of data and other numbers, I’d like to see these numbers presented in a more visual way – nice parallels are drawn to perceivable concepts to make abstract quantities real. For example: where they say the CO2 generated from a specific shirt is equal to 100x the weight of the shirt, it would be nice to have a more standard reference: such as how many miles average driving…or how many trees need to be planted to counteract this release of CO2. This reference could in-turn, be illustrated in a more graphic format that would enable more direct comparison between various products.

Fritos don’t grow in fields

Fritos grow in fields (or so they\'d like us to believe)

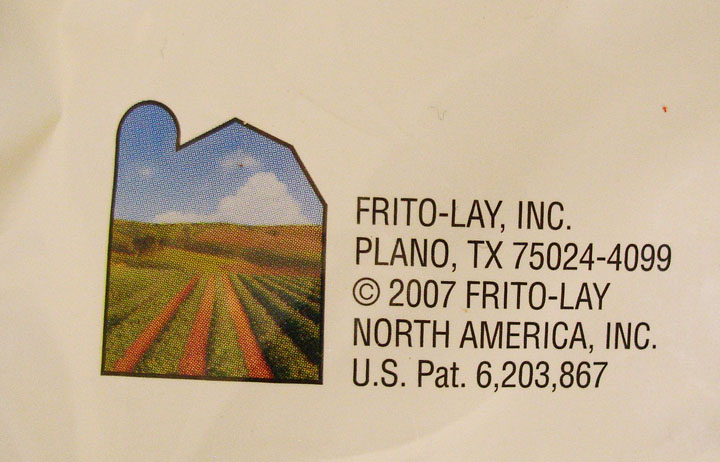
This graphic from the back-side of a Fritos chip bag seems to say that the company is farming-focused. The visual of peaceful farm landscape framed within the outline of a traditional barn is in direct contradiction with the accompanying address. (It’s also common knowledge that the company’s chips are about as processed and far from the farm as they can get.)

This is a case of graphics gone deceptive. Though Plano sounds like a perfectly nice place, from it’s wikipedia entry, it doesn’t seem to agricultural as this graphic suggests.

Plano (IPA: /ˈpleɪnoʊ/) is a city in Collin and Denton Counties in the U.S. state of Texas. Located mainly within Collin County, it is a wealthy northern suburb of Dallas. The population was 222,030 at the 2000 census, making it the ninth largest city in Texas.”

If Frito-Lay was trying to follow the criteria of corporate transparency by revealing their address in Plano, the company has also under-estimated the power of graphics. Their packaging’s contradictory stance will make any visually-aware consumer doubt their mixed messages.

Visual cues can add new dimension to text-based information, but when text and graphic are in direct contradiction to each other (and obviously wrong for the context of the product), the addition of visual information can do more harm to the image of the company than good.

Icy “ICE” sign

Ice for sale sign

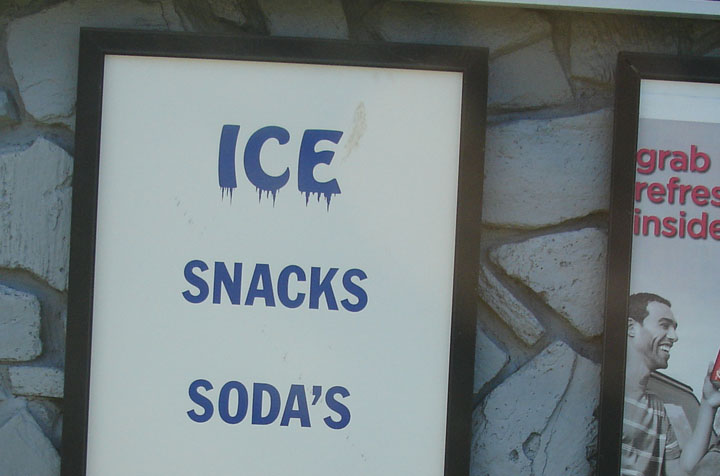
The “ICE” on this sign gives visual cues to the effect of the product itself.

Where the viewer may have understand what “SNACKS” and “SODA’S” mean, they will feel the meaning of “ICE”. This technique can also aid in understanding for low-literacy audiences.

Strawberry Yogurt Sketch

Iowa Strawberry Yogurt IngredientsDistances of Strawberry Yogurt Ingredients

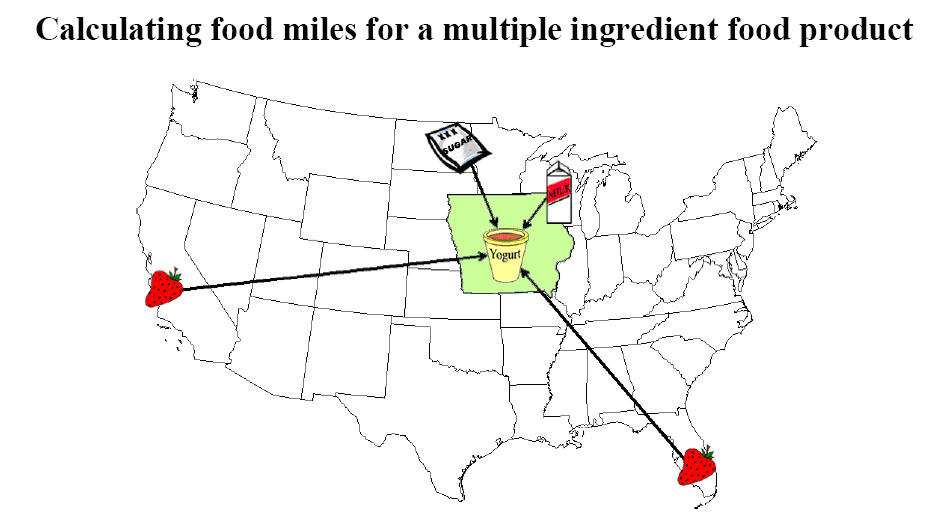
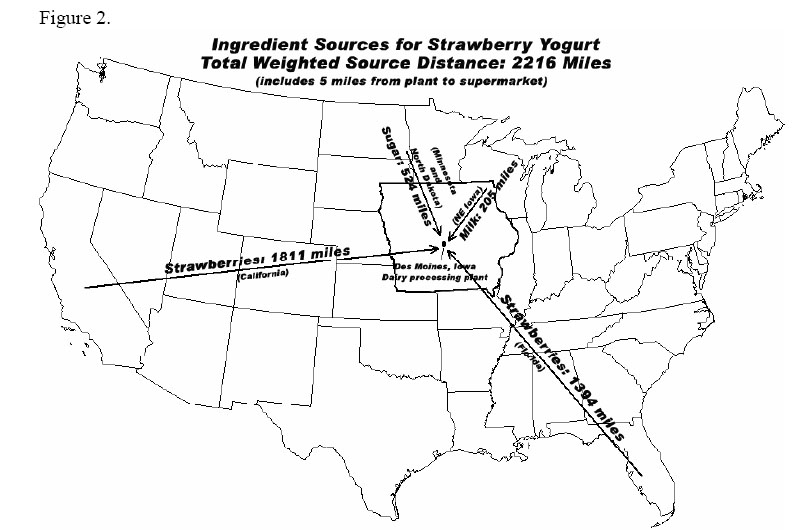
This pair of straight-forward graphics appear on separate pages of “Calculating food miles for a multiple ingredient food product” – a white paper from Iowa State University’s Leopold Center.

The graphics show where the ingredients of a specific Strawberry Yogurt have come from.

The first graphic is more visual, and thereby more enticing at first glance, but it does not convey the useful information of the 2nd graphic. The first graphic could be expanded to incorporate the detail of the second graphic: exactly how far each ingredient has traveled. And it could be further expanded to specify which method of travel (plane, train, truck, etc.), and with what carbon footprint.

A more detailed report (including stats on this yogurt’s Life-Cycle Assessment [LCA]) accompanies these graphic. Source: http://www.leopold.iastate.edu/pubs/staff/files/foodmiles_030305.pdf

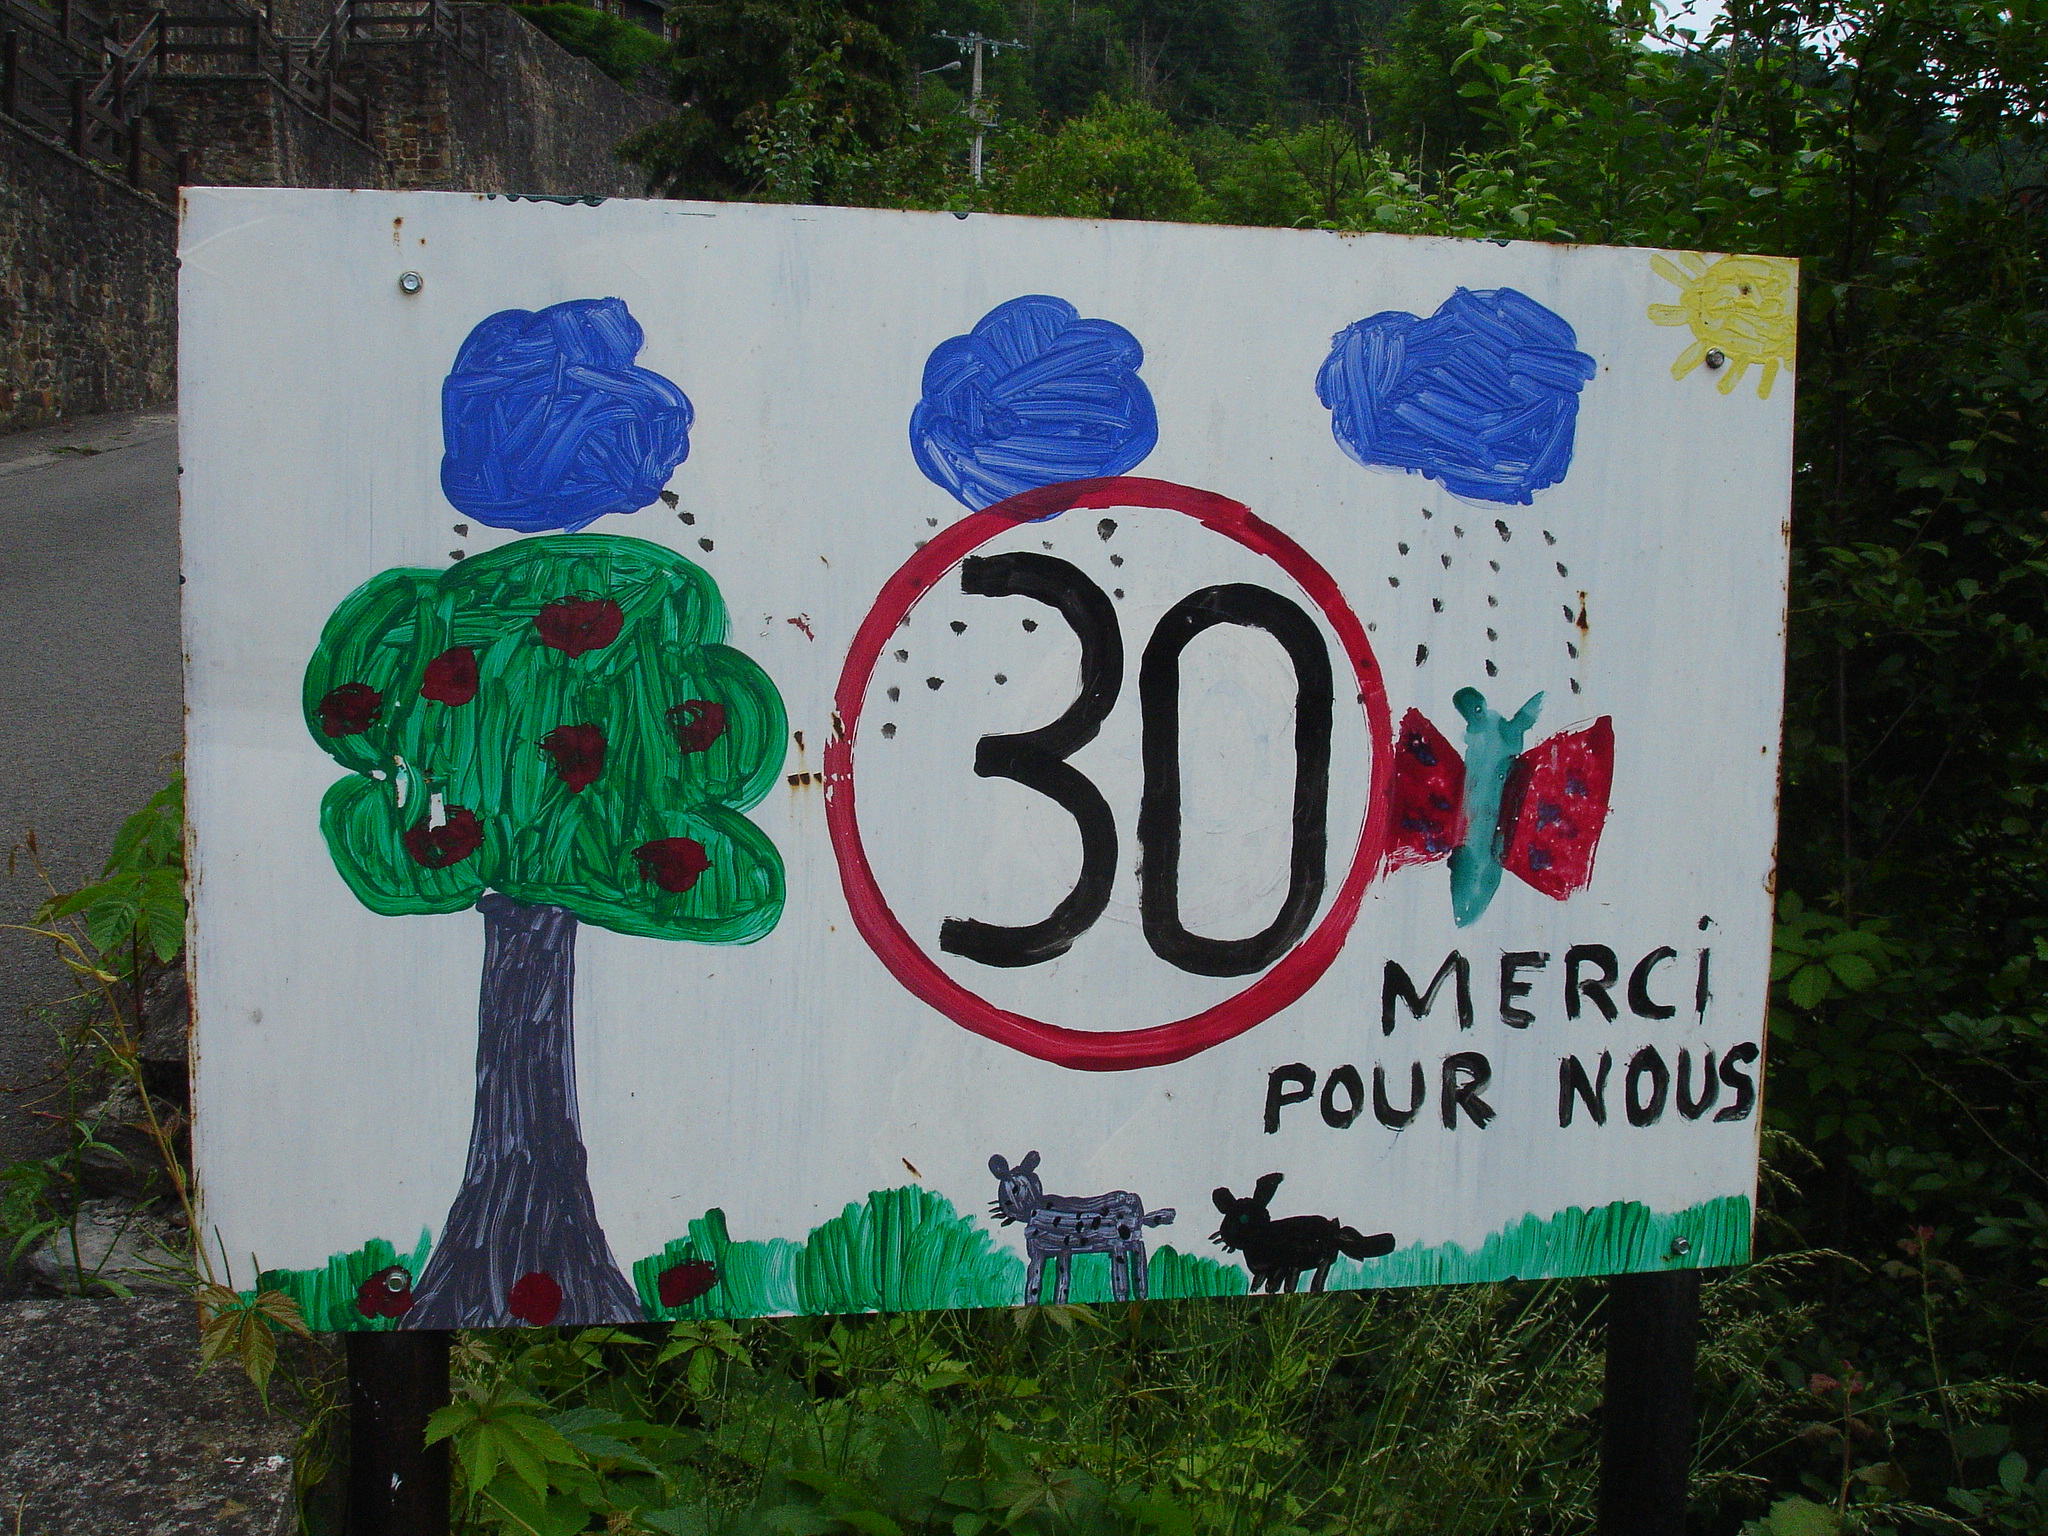
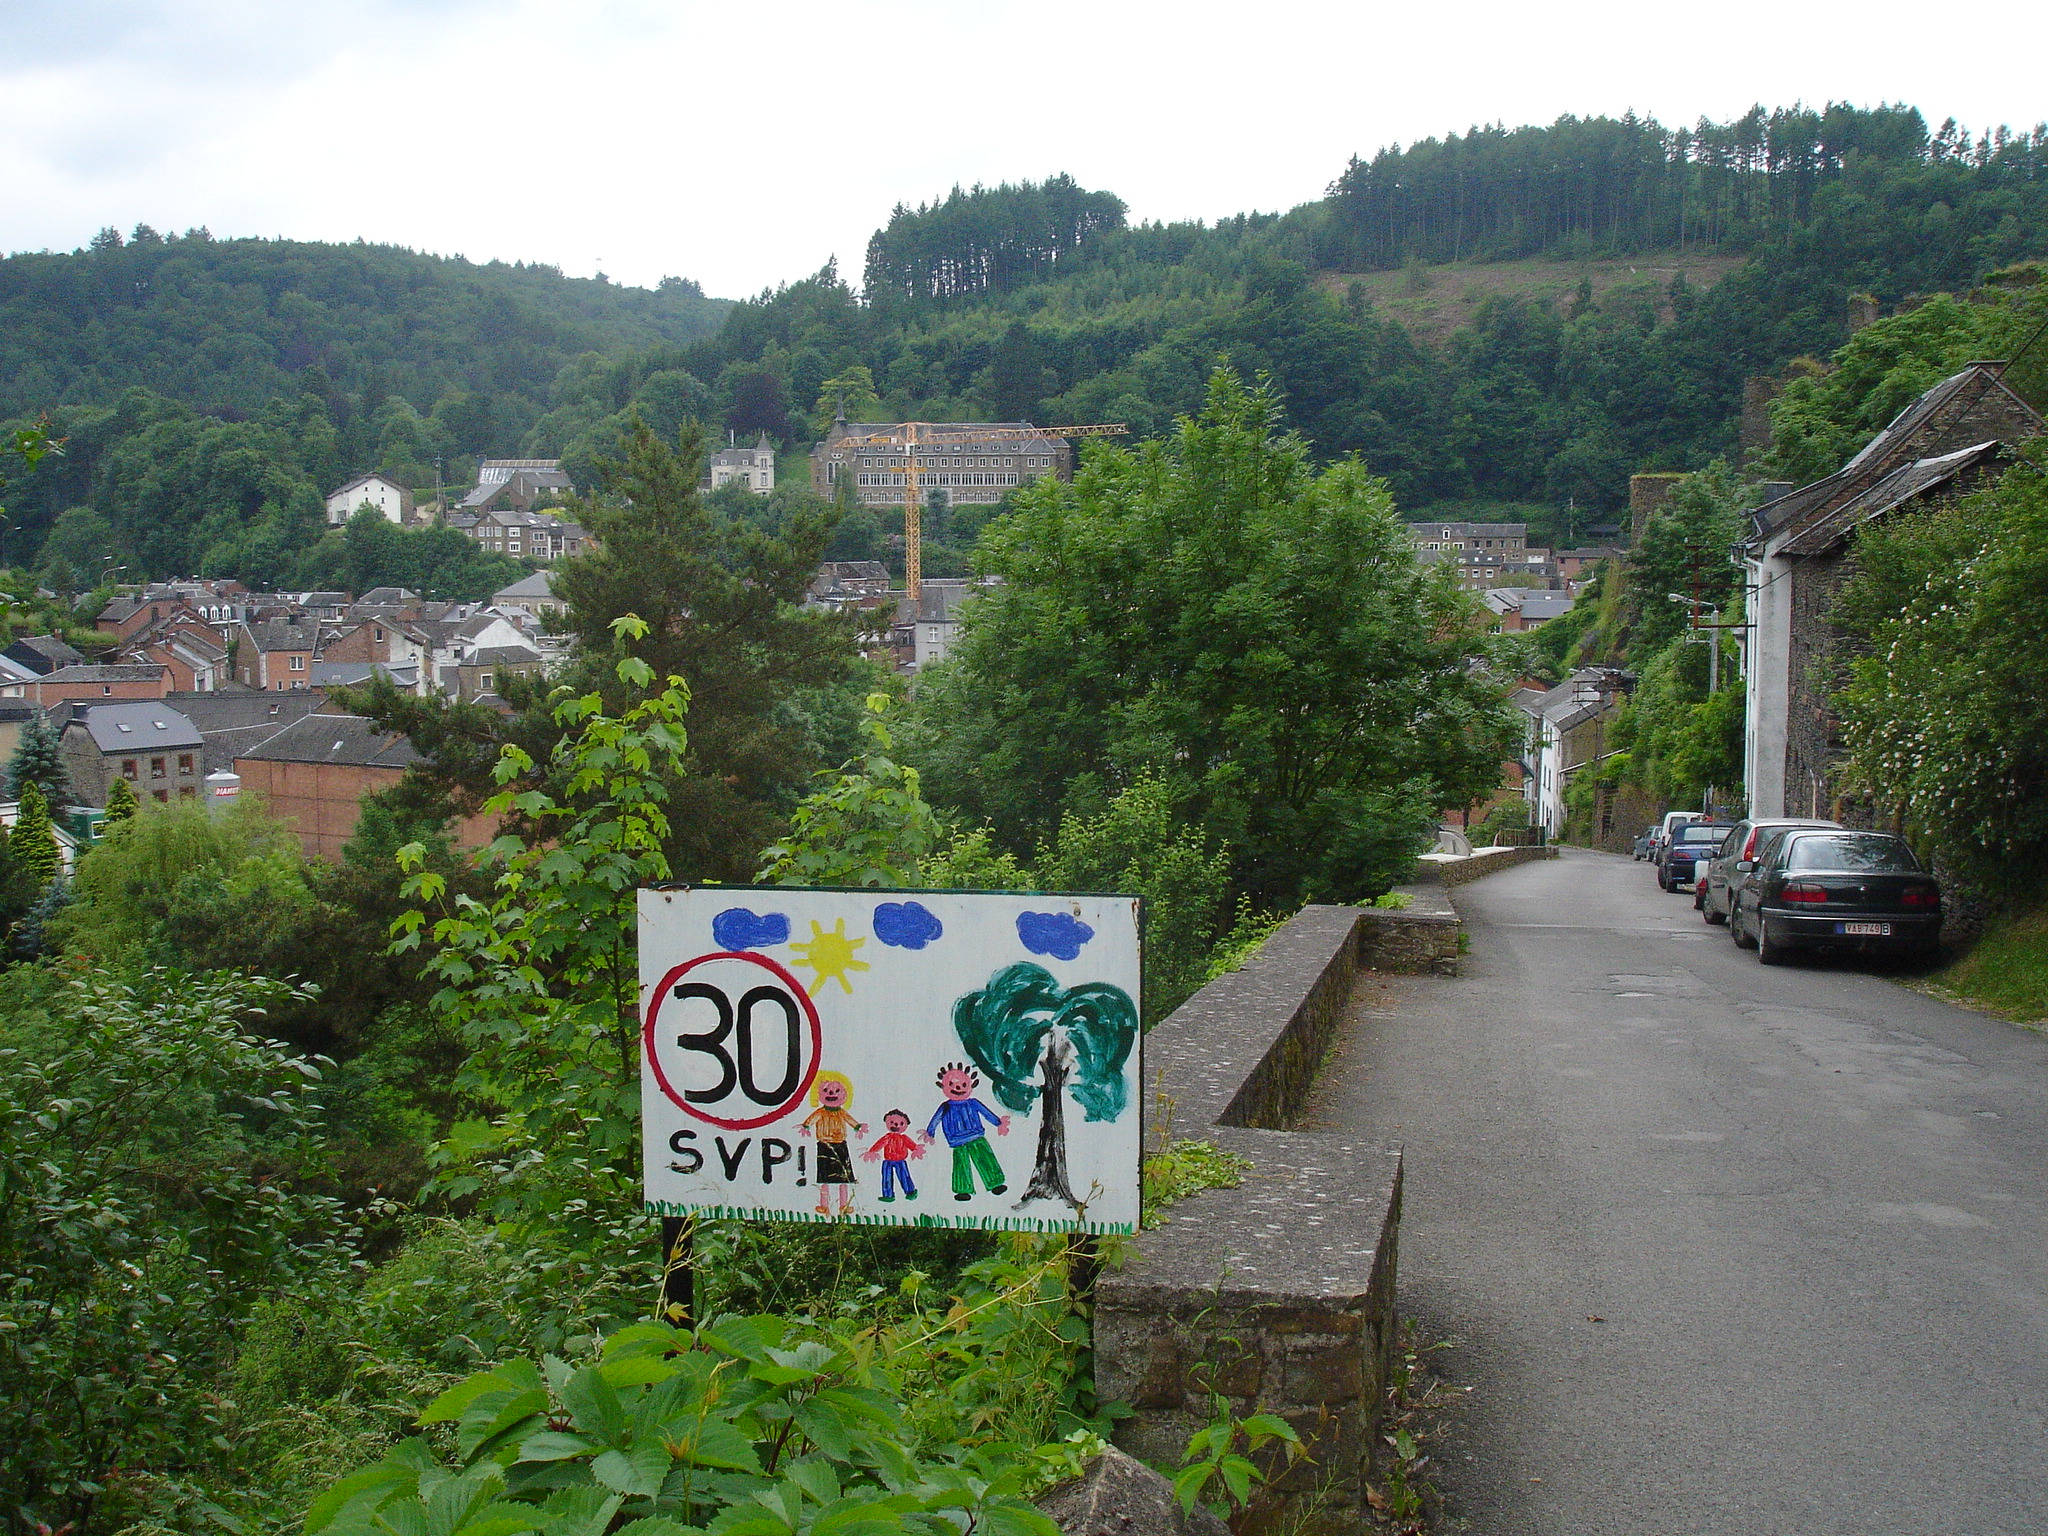
Slow down for the children

30km/hour Thanks. It\'s for us. 30km/hour Please!

We came upon several of child-designed ‘slow down’ in a neighborhood area of this picturesque Southern Belgian village.

Not only do these signs get you to slow down to enjoy the art, they also are strong reminders of the reason one should reduce speed:as one sign distinctly puts it “for us”.

The circled ’30’ (the European symbol for speed limit) is consistent on sign. Painted on the white board surrounding this ‘slow down’ symbol are the happy indications of childhood in the area: sunshine, trees, swings, families, dogs, cats, and a myriad of other animals. Personalized, these tell the story of neighborhood life from kid-view.

Such a request for speed reduction is more effective and easier to obey when it comes direct from the pint-sized residents of the street than from the typical sterile government-issued signs. These factory-stamped signs only serve to remind a driver that there are staunch rules to conform to. Sure, the objective of each style of sign is the same, but by including an indication of the reason ‘why’ behind a request for conformity, drivers are more likely to adopt the concept as their own and ride the breaks.

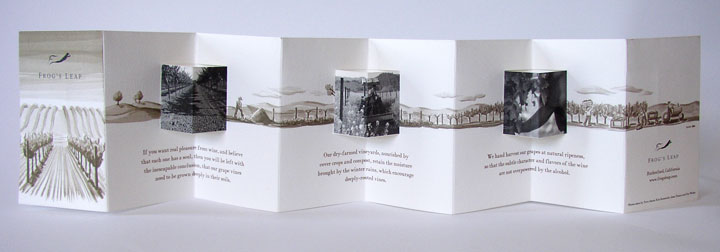
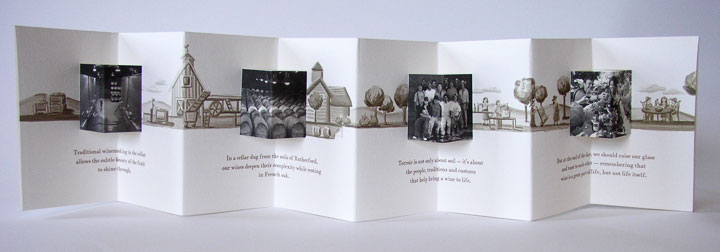
Illustrated Story of Wine

Story of wine at a vineyard - frontStory of wine at a specific vineyard - back

This accordion-fold brochure from a vineyard pulls the viewer through the story a bottle of wine from planting to enjoying – in 3 parallel formats: written storyline, photographs and a background illustration which ties the piece together. As a viewer, I’m right there walking with the grapes as they pass from farm to glass. Definitely more of a marketing piece than data-driven information design, but the brochure makes creative use of folding and visual design elements to evoke an emotional response.