Resources
Tips and Tricks for Visual Storytelling & Sustainability Communication
Presentations
Sustainability Visualized
Arlene Birt at TEDxFulbright
The Visual Vocabulary of Sustainability
Interaction Design Association
MEDEA Artist Talk
MEDEA New Media Institute in Malmö, Sweden
Blog Posts
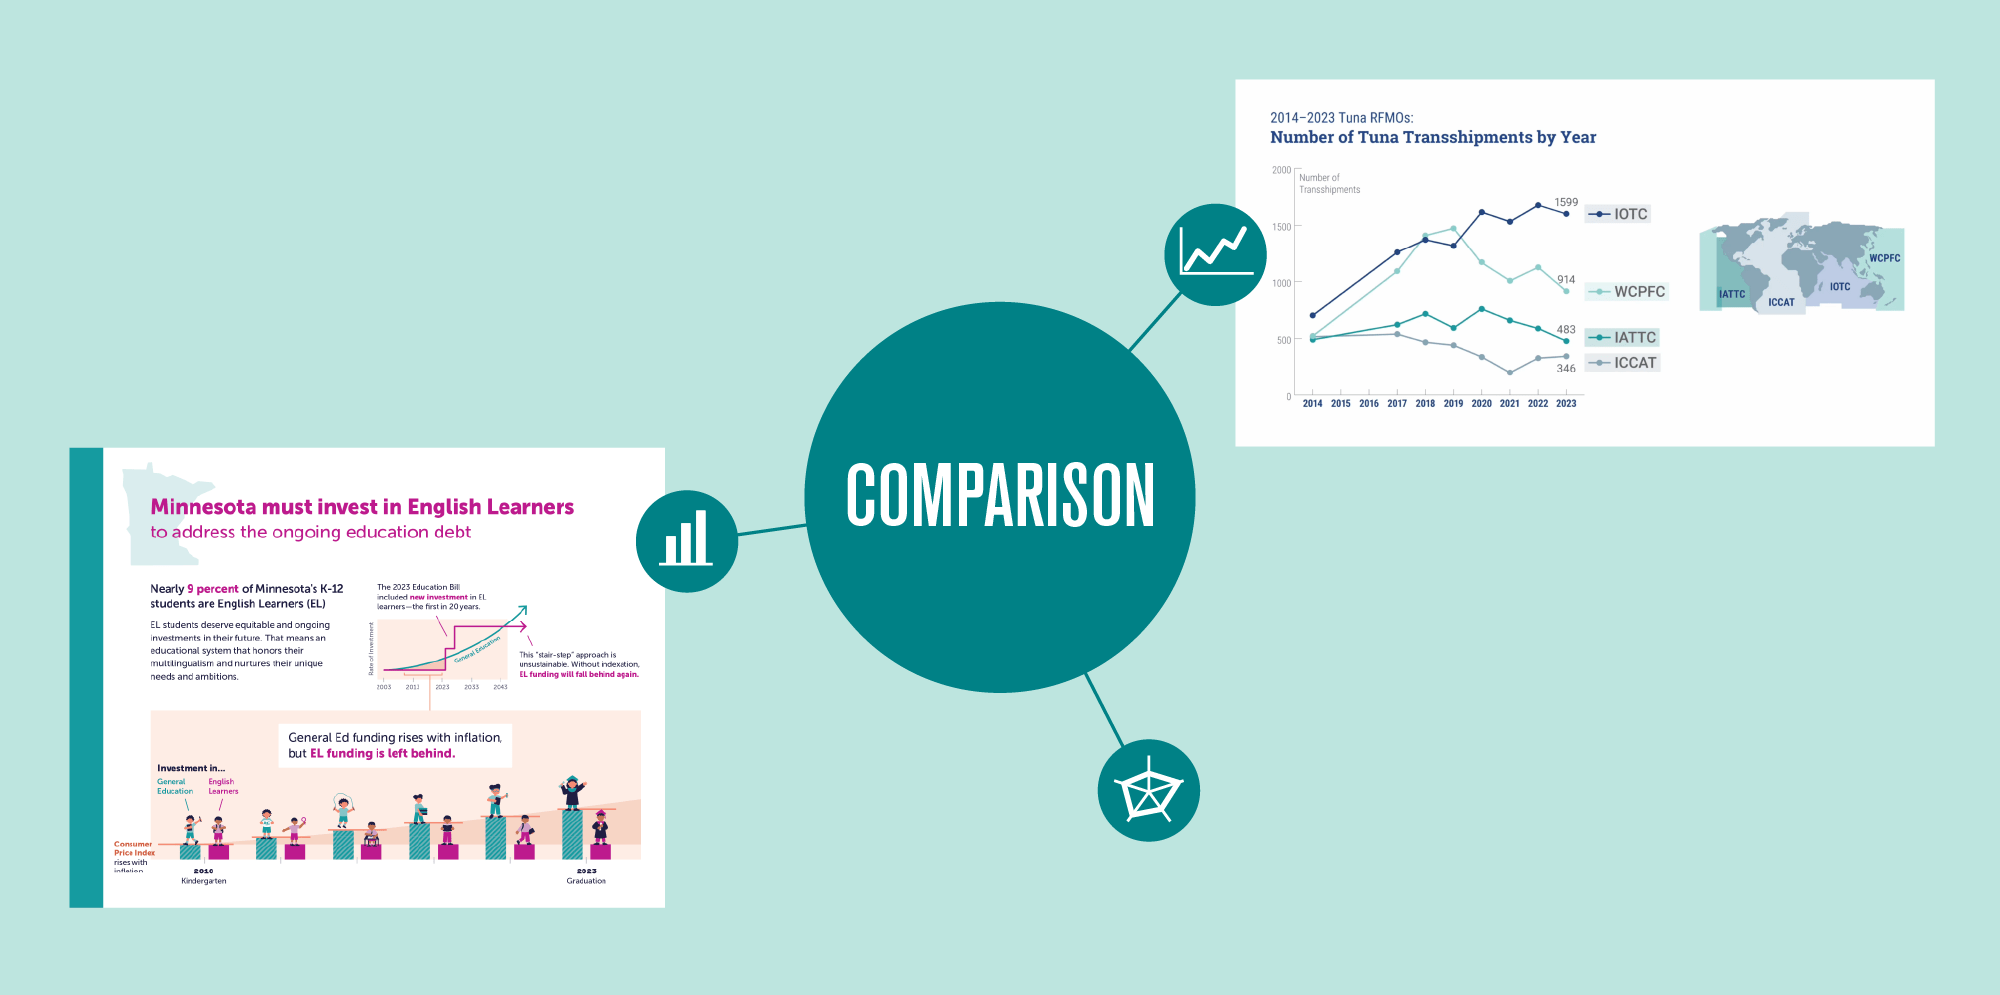
How we convey the meaning behind the numbers When exciting data is released, it's tempting to share the numbers directly with your audience. But there...
Congratulations on finishing your Theory of Change! Capturing the heart of an organization in a single model is no small feat. Now that it’s finished,...
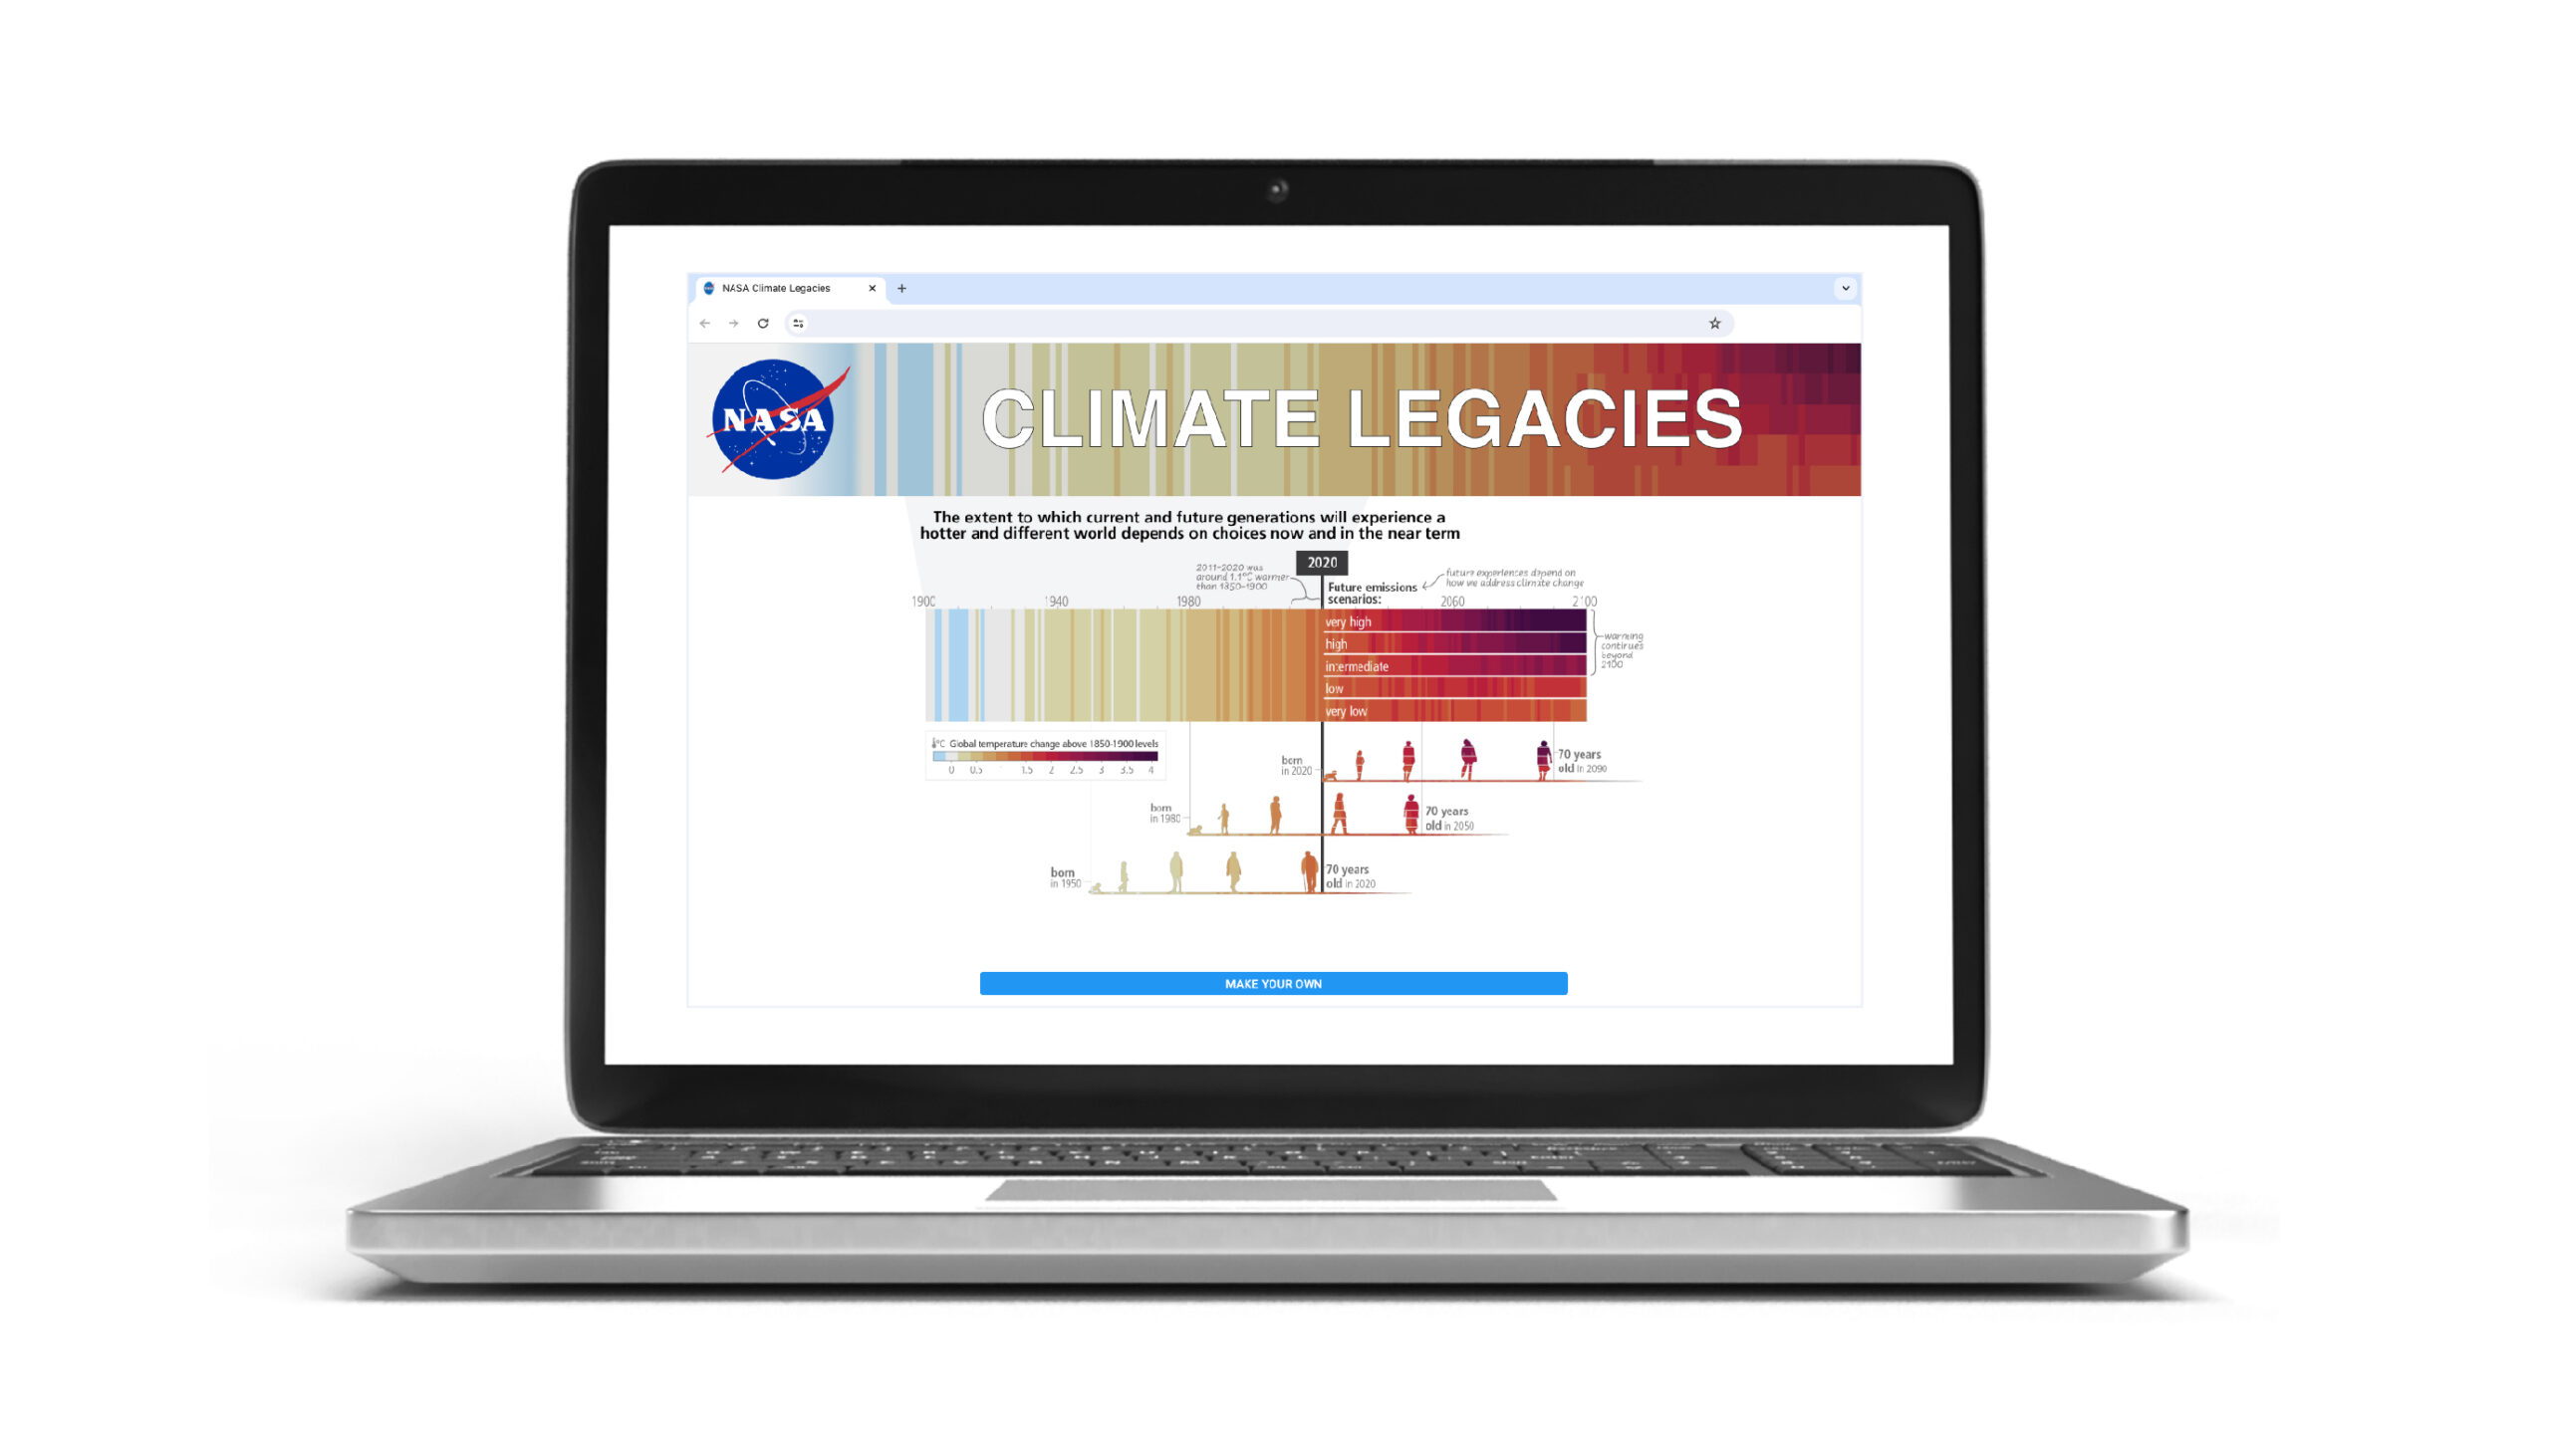
Map your family's climate legacy We're excited that a UN Intergovernmental IPCC figure designed by our creative director has been adapted into a customizable digital...
We're excited for another year of creating visuals people ‘get’ at a glance. Looking back at 2023, we’re really proud of the work we’ve done...
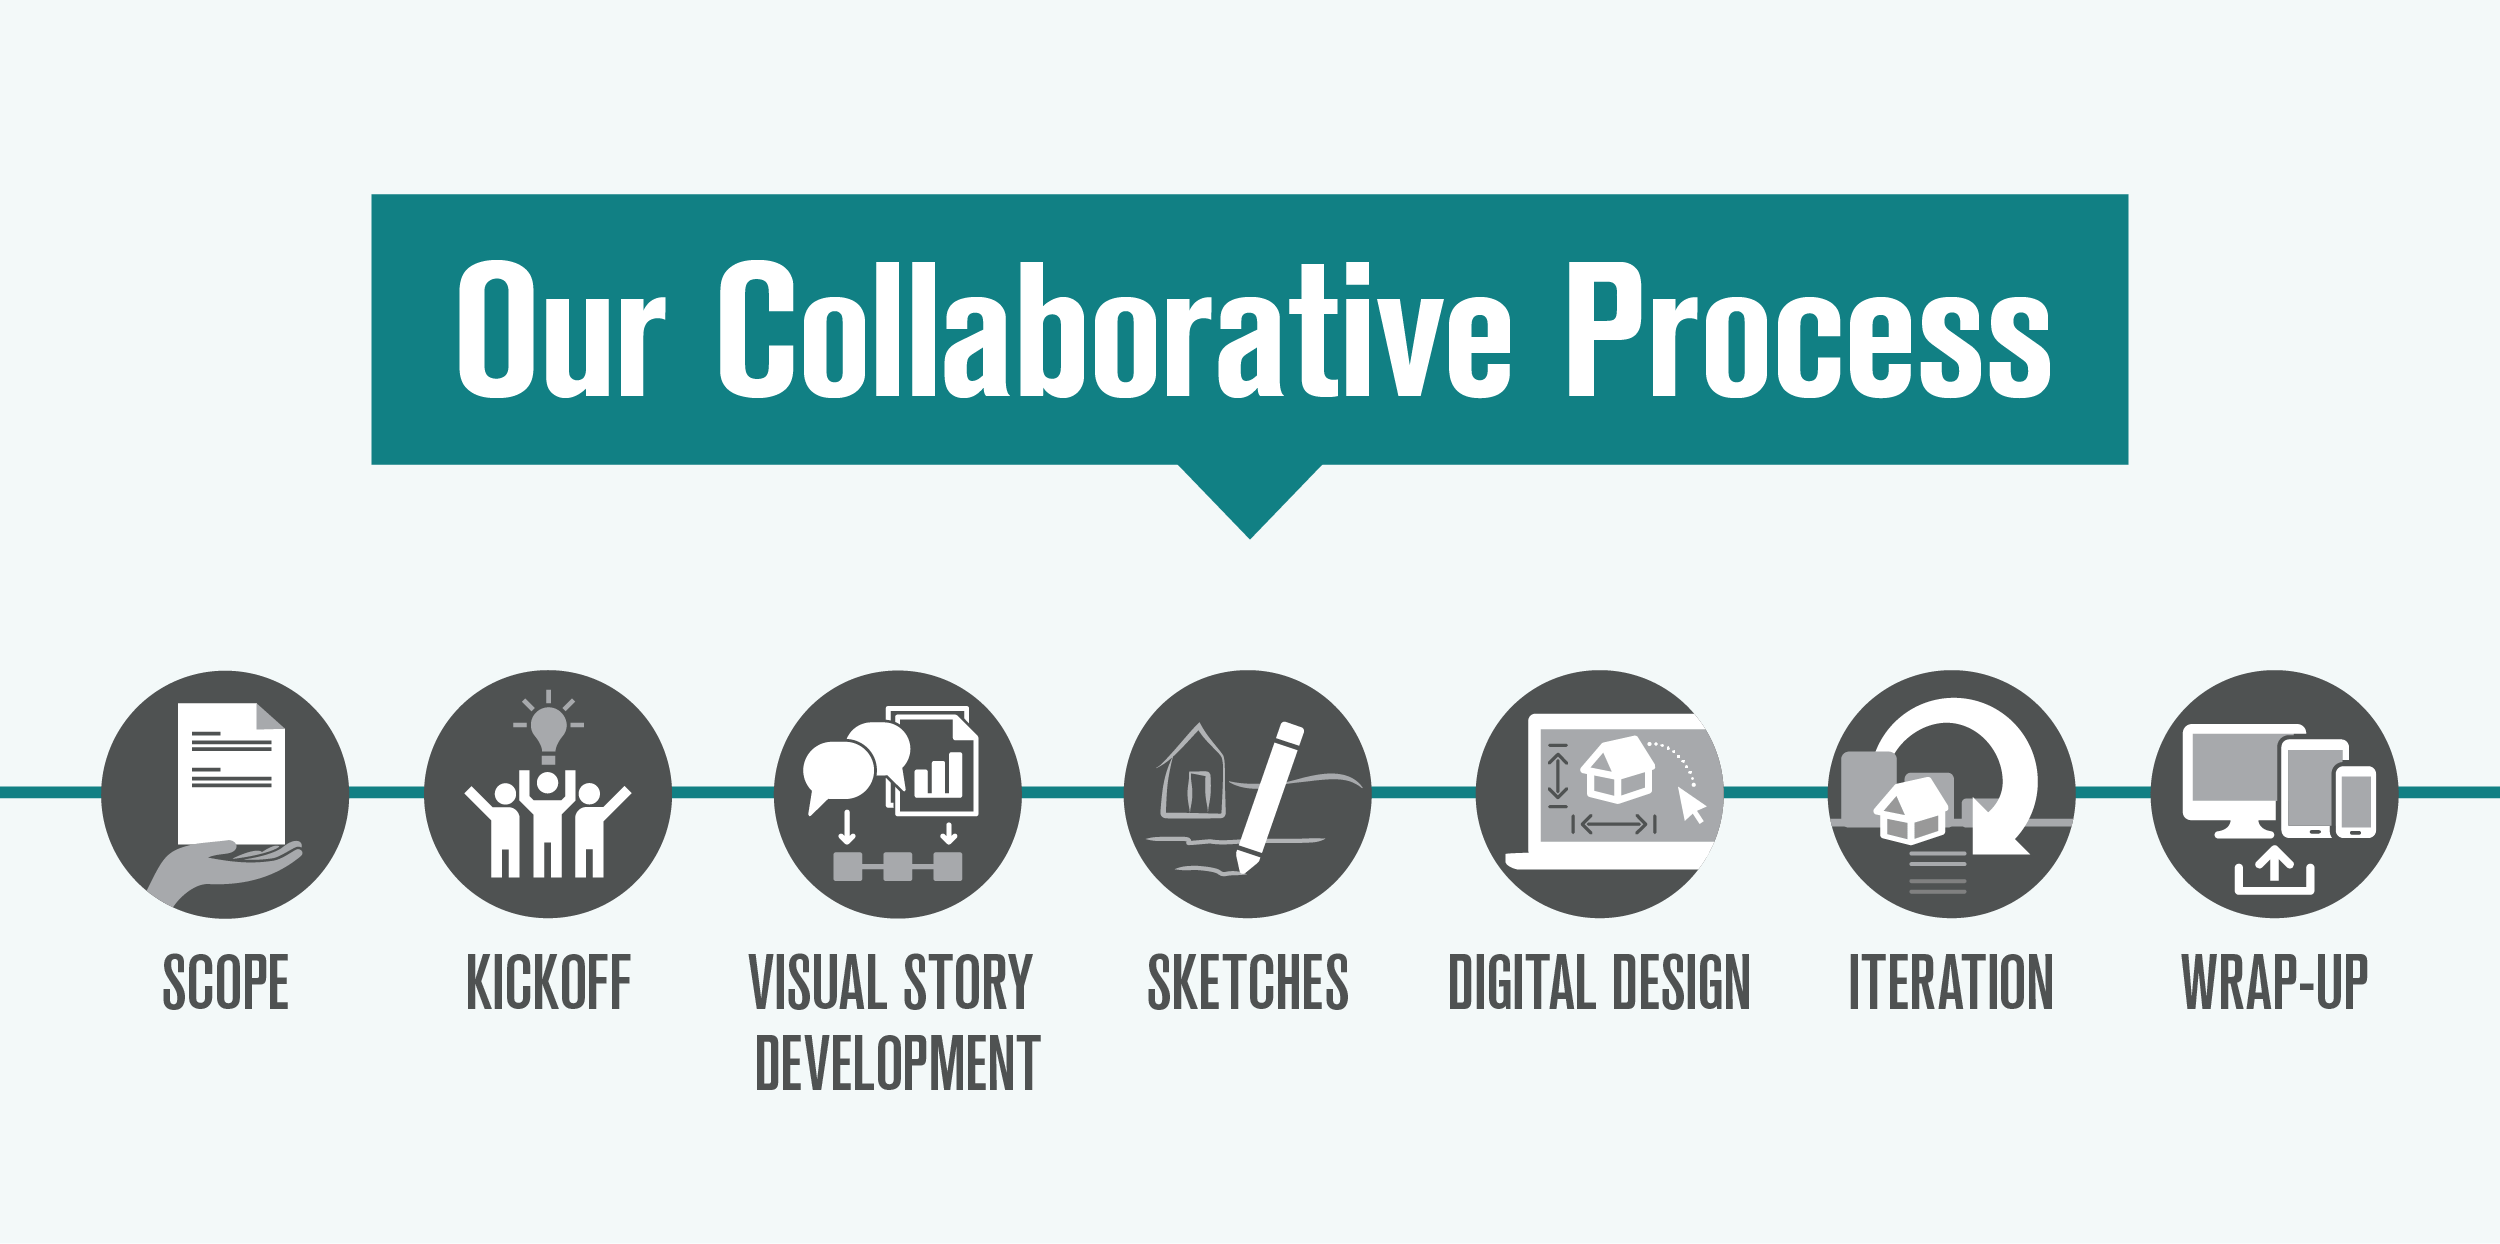
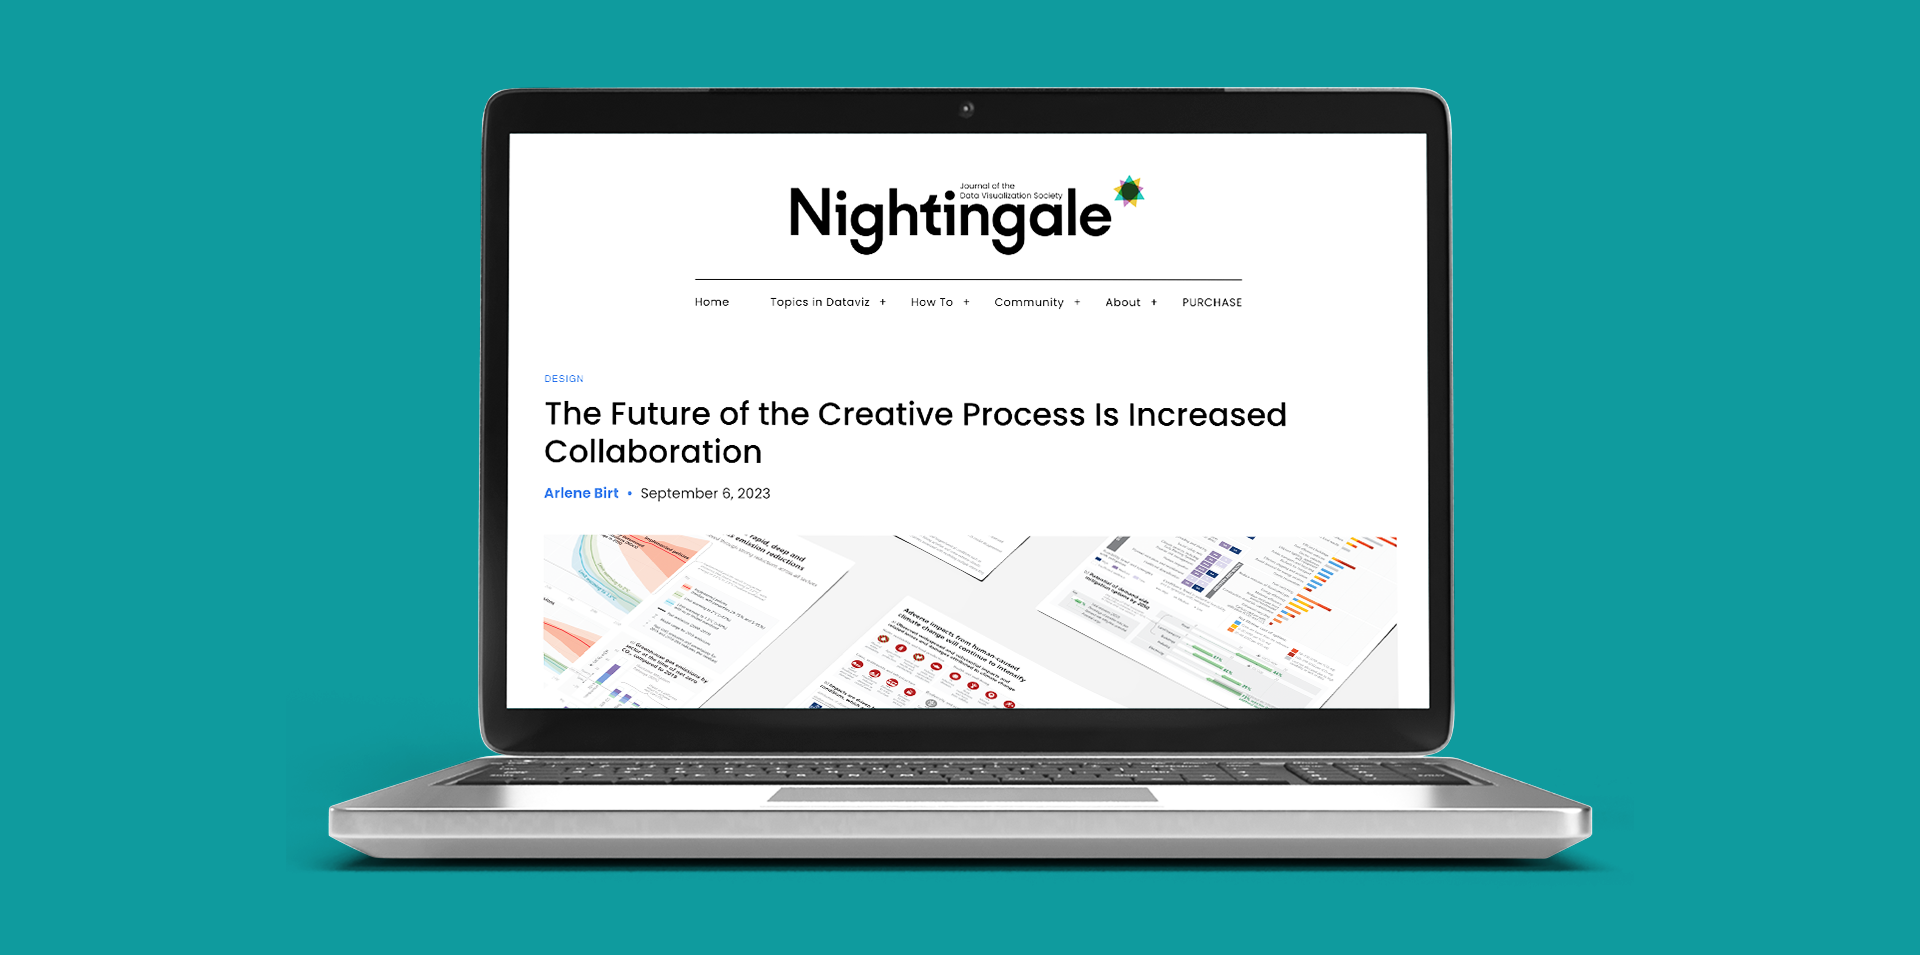
A step-by-step guide to our collaborative process Visual storytelling is a powerful tool to help people understand and engage deeply with complex information. Whether developing...
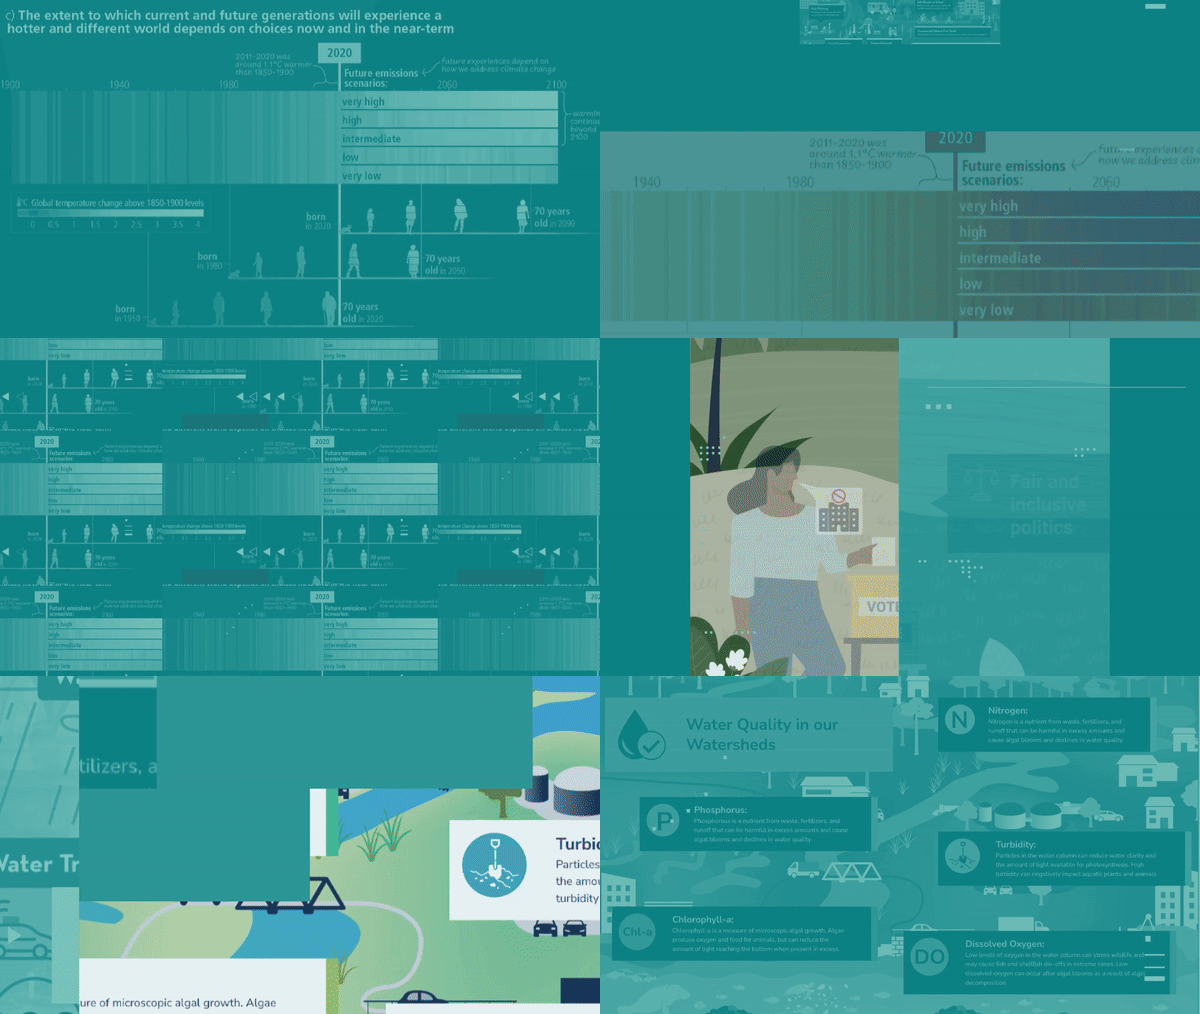
Our founder/creative director, Arlene Birt, collaborated with more than 60 scientists on data visualizations for the Intergovernmental Panel on Climate Change (IPCC) climate report. She...
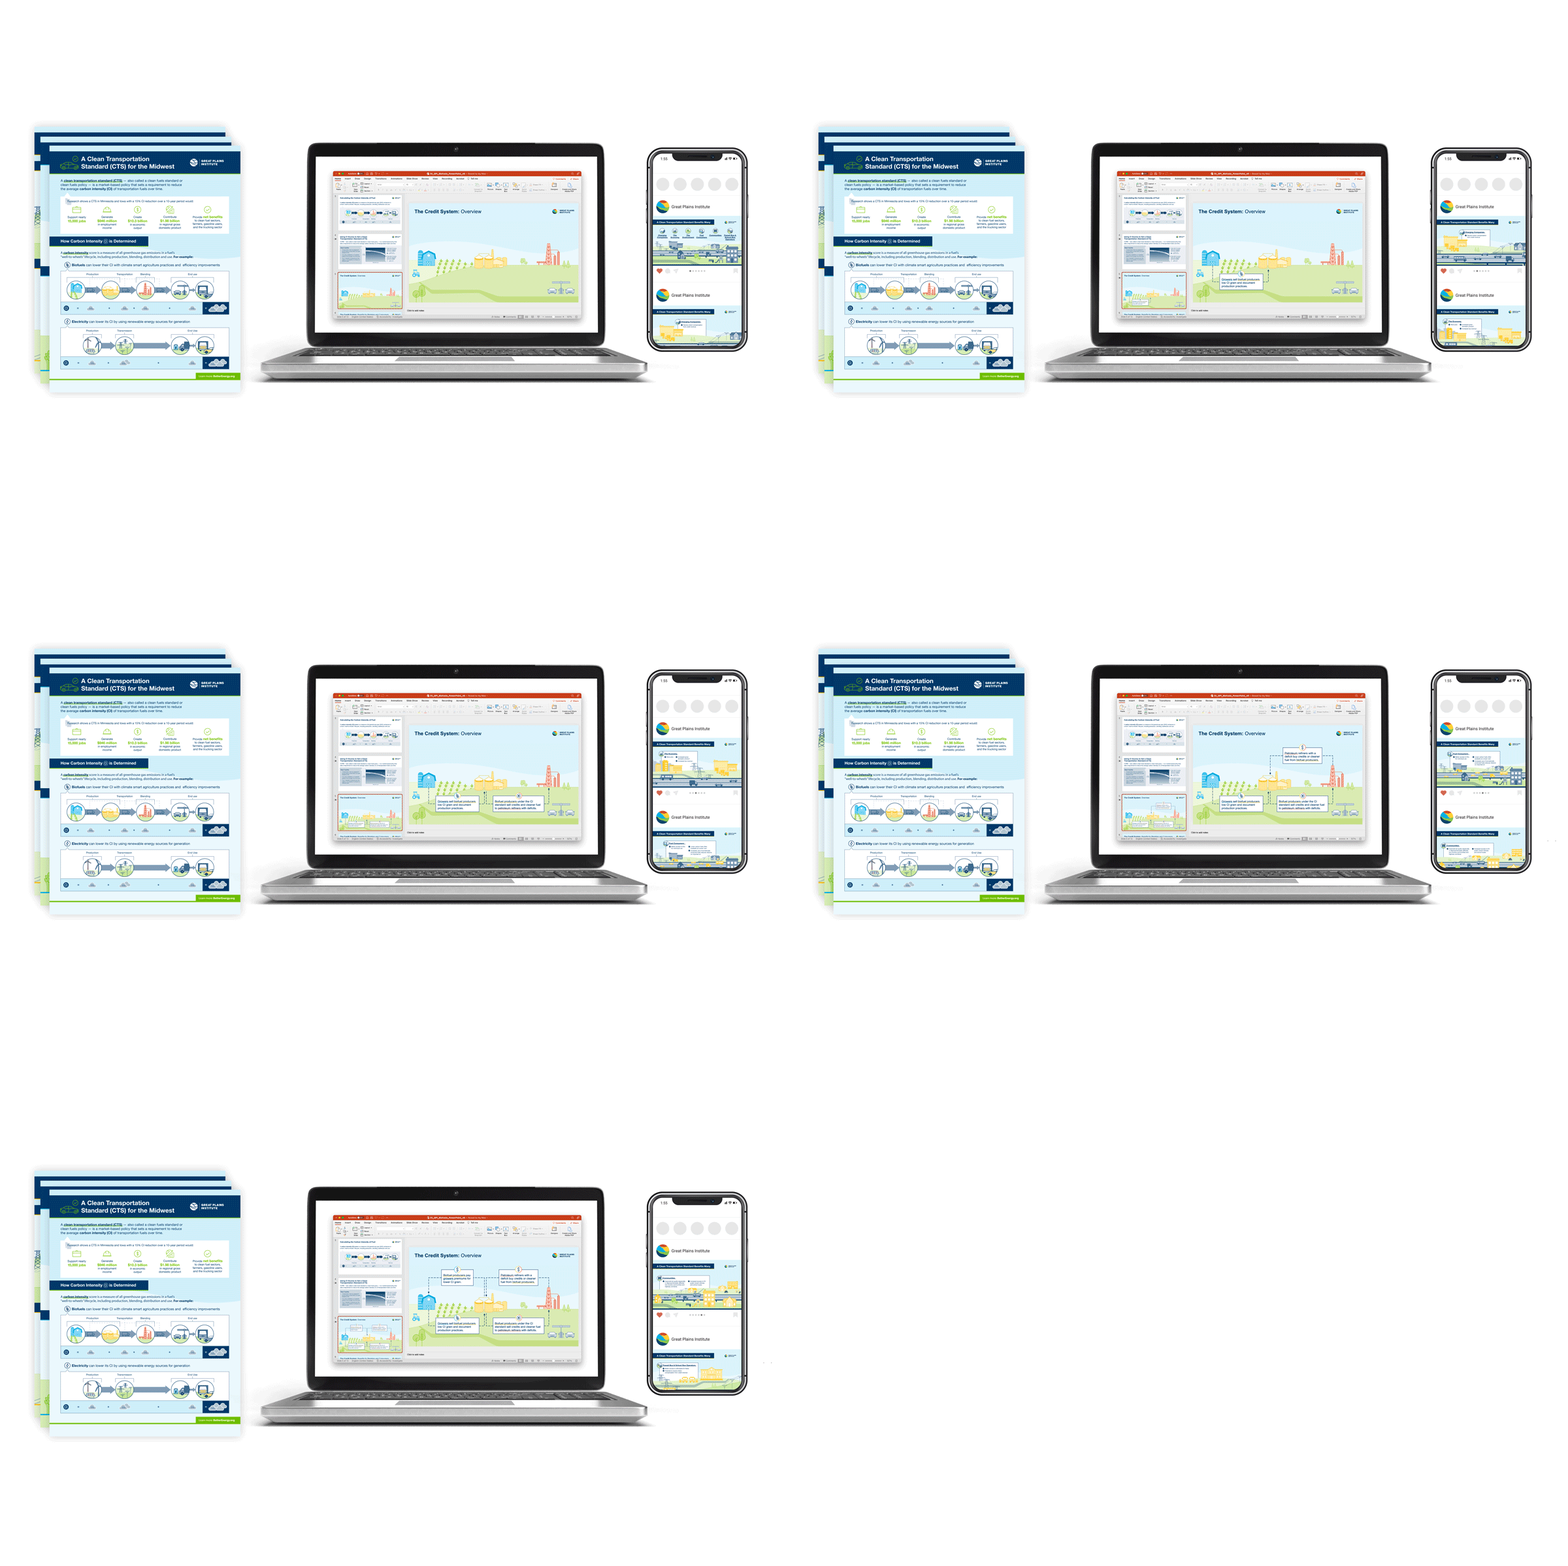
When you design for everyone, you design for no one. ...so the saying goes. And we often find understanding the variety of audiences and media...
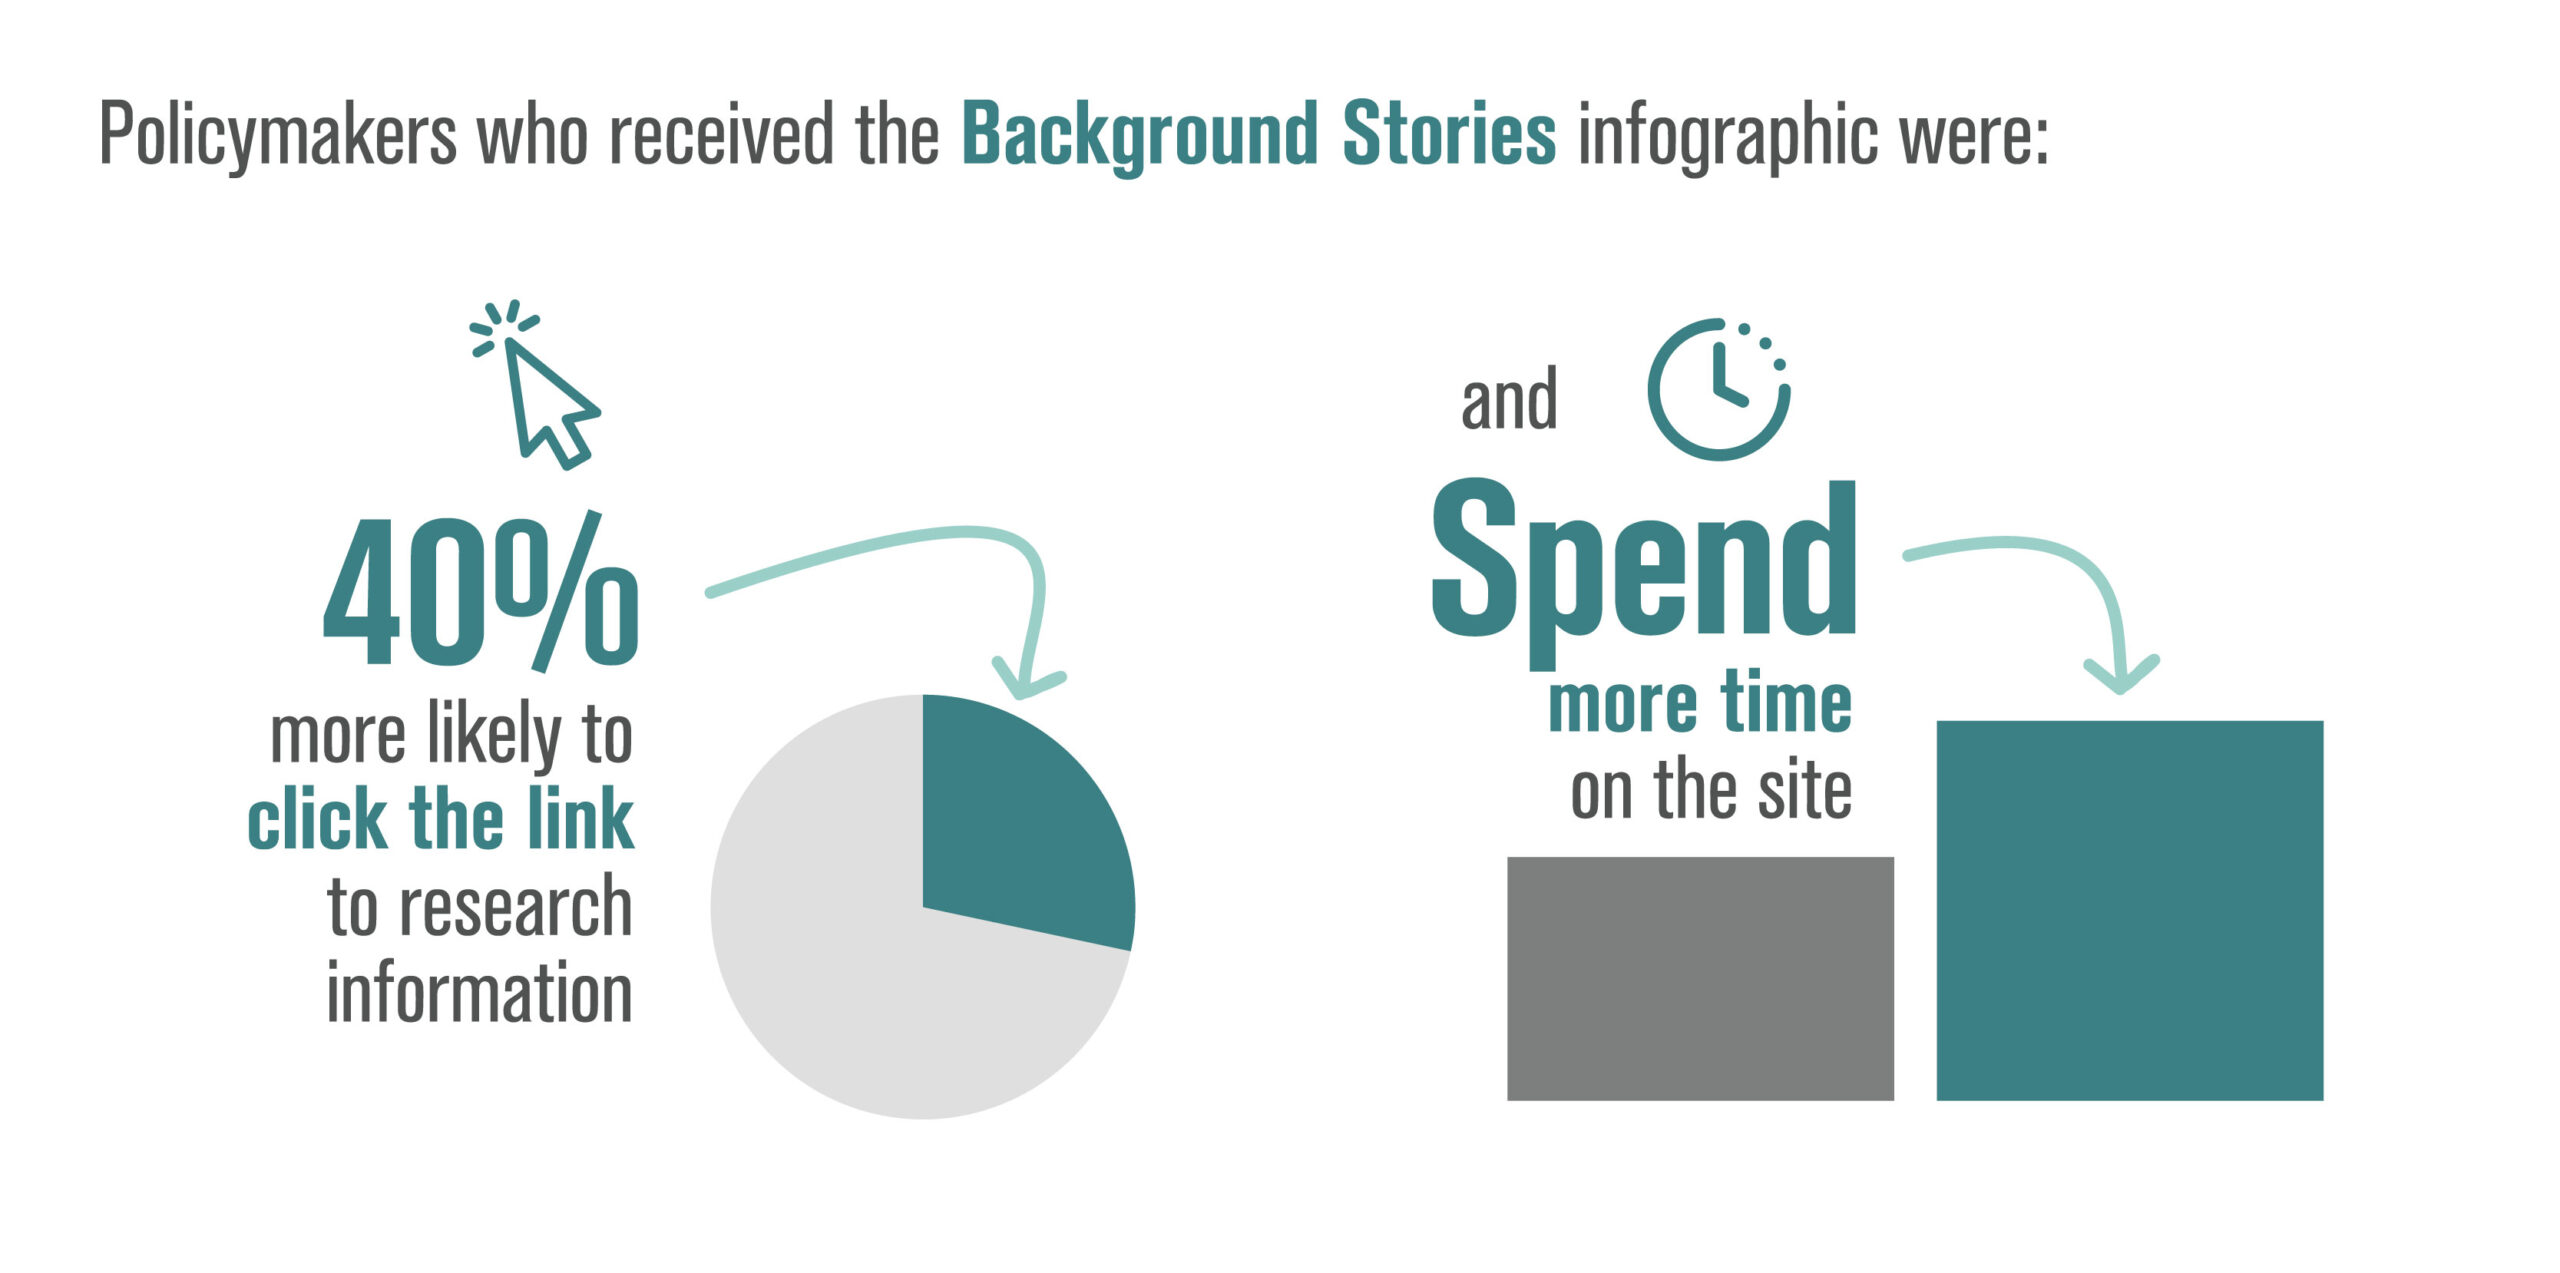
Our visual storytelling makes an impact…and the science shows it. To better understand how people engage with a highly-visual infographic compared with a written fact...
Numbers are a useful way to quantify and understand the world around us. What numbers alone can’t do, however, is provide an emotional connection between...

