When you design for everyone, you design for no one.
...so the saying goes.
And we often find understanding the variety of audiences and media for a project can lead to efficiencies in designing the same content speak across multiple audiences. By tailoring a design approach to suit the preferences, background knowledge, and expectations of different groups, —even while using the same content— we can enhance engagement, strengthen connections, and achieve communication goals.
The following case studies show the importance of selecting the appropriate communication method for a variety of target audiences and strategies for effective communication across different platforms.
Great Plains Institute (GPI)
OVERVIEW
- Audiences: Farmers, policymakers, general public
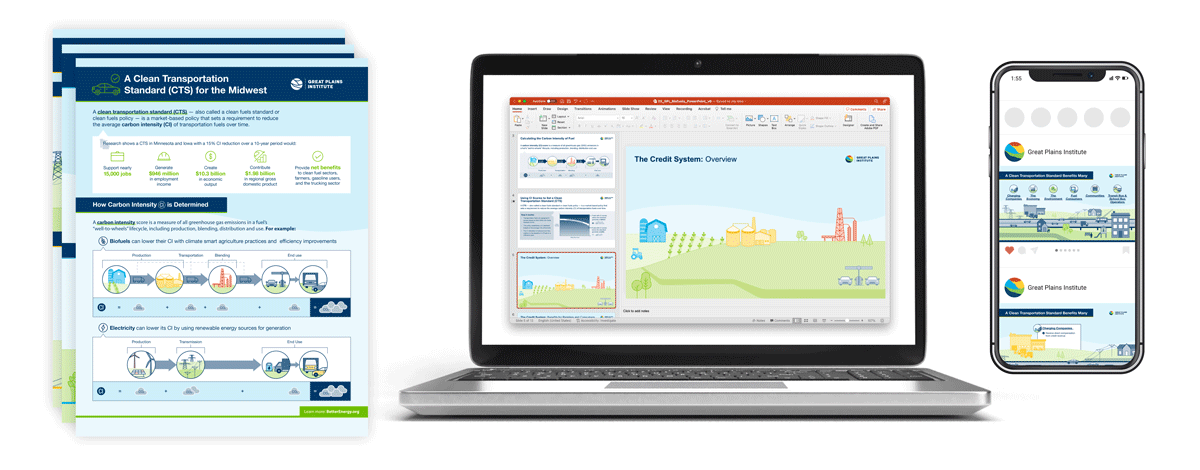
- Deliverables: Powerpoint presentation, one-pagers, & social media graphics
- Unique challenges: Complex scientific & economic concepts, nuances in perspectives, sensitivities of each target audience
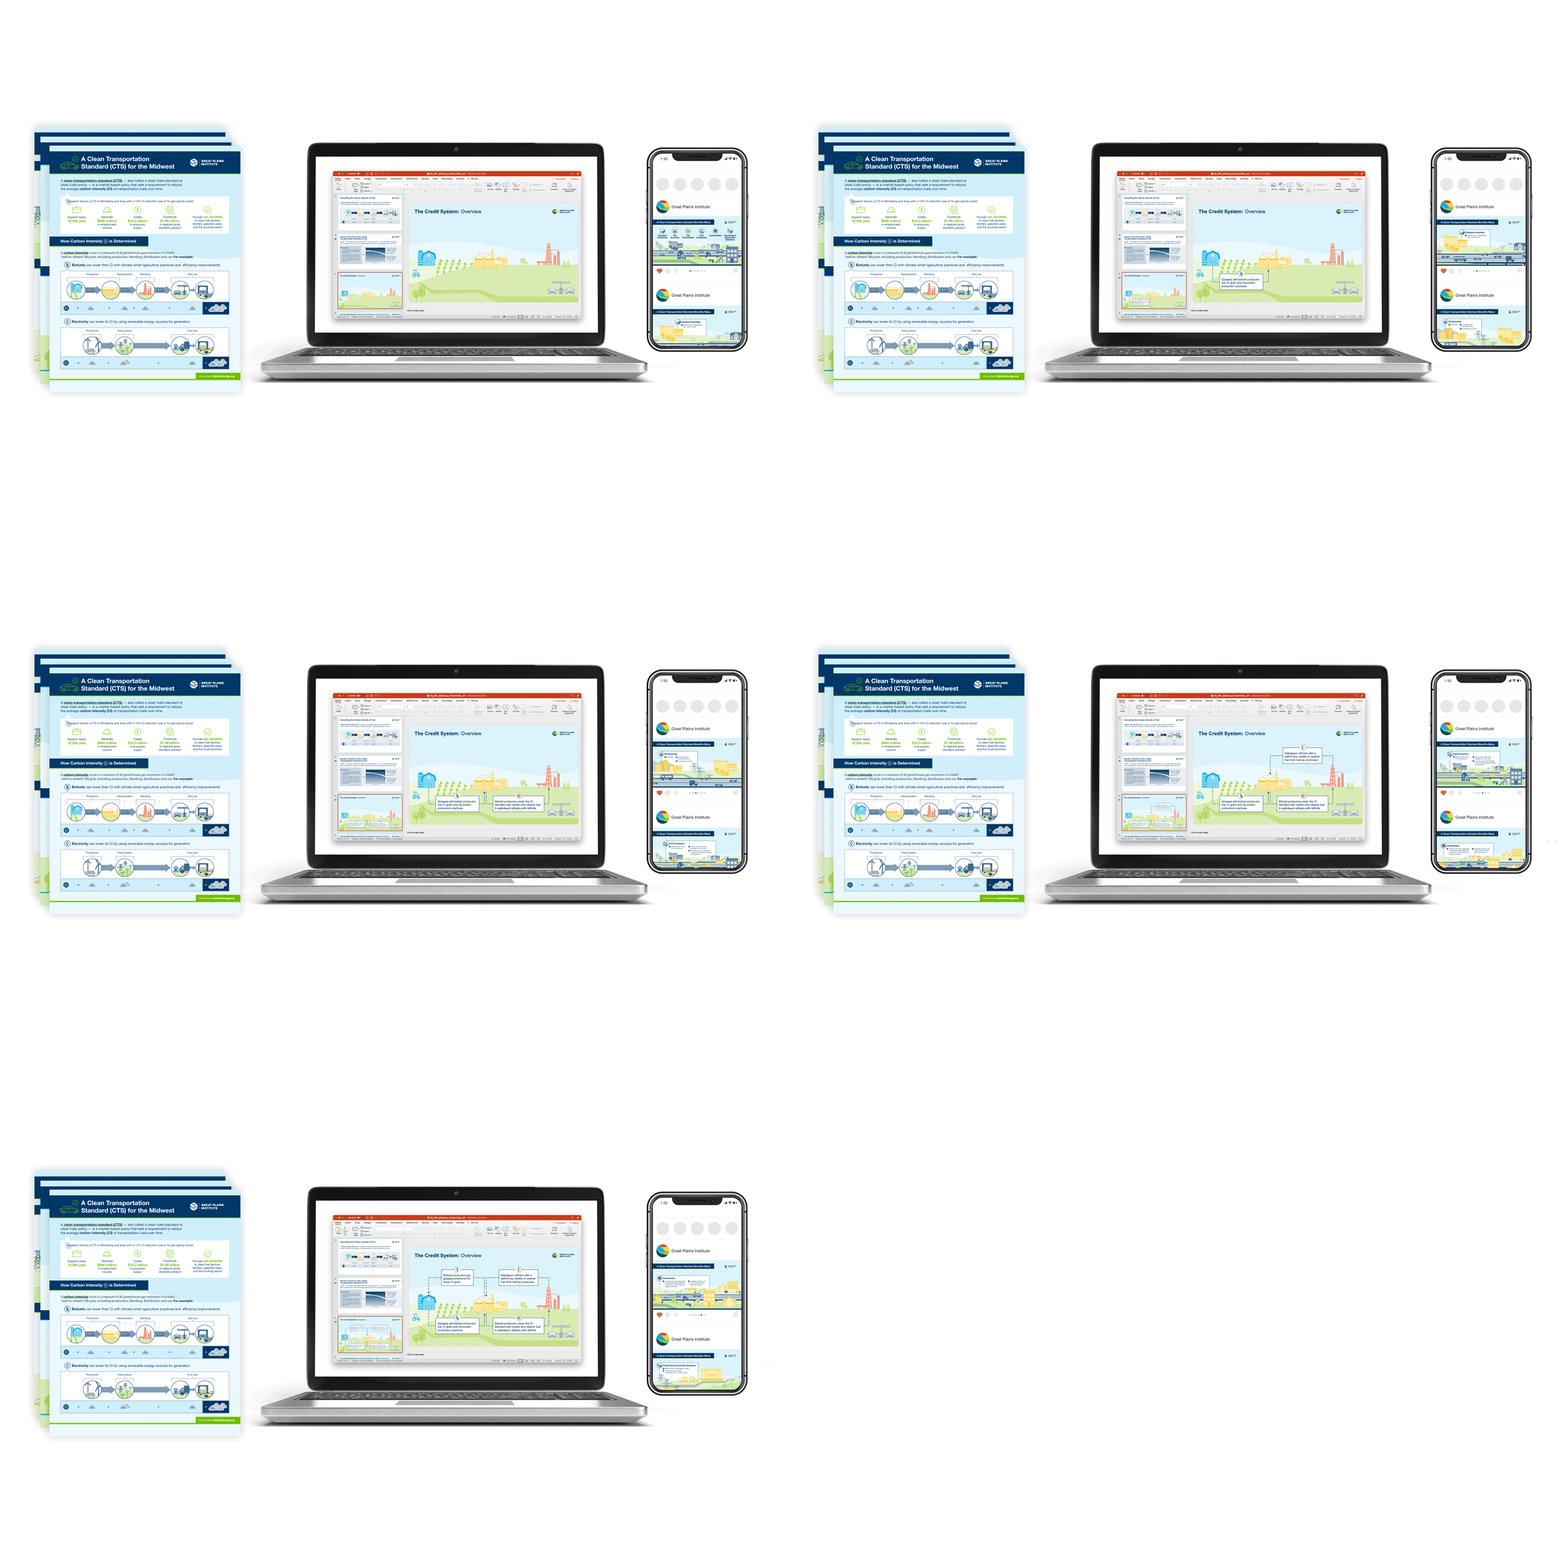
These infographics convey a Clean Transportation Standard (CTS): conveying complex information (including data, research, and policy details) through concise and appealing visuals. We worked directly with stakeholders to test the infographics for clarity and comprehension across audiences.
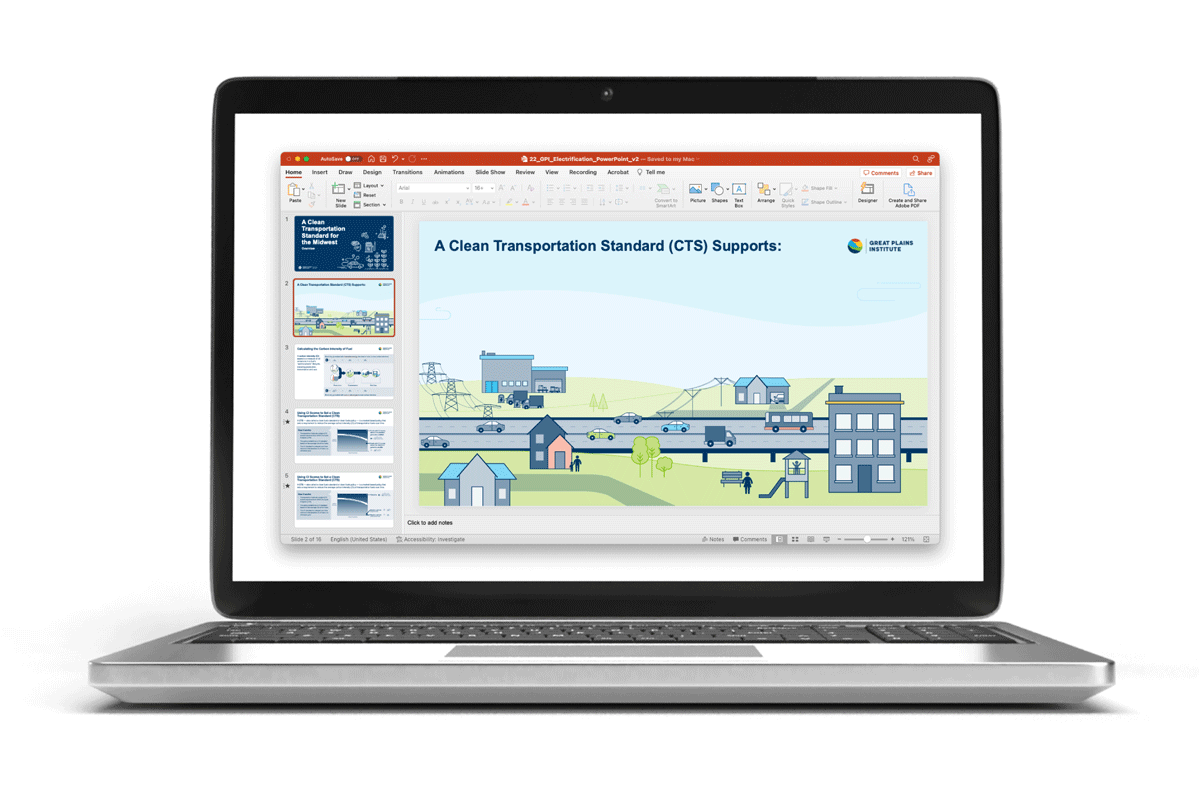
To communicate to farmers who grow grain for biofuels, we focused on potential cost savings, increased efficiency, and long-term benefits for farmers. Because there are nuances in what a Clean Fuels Standard (CFS) would look like state-to-state, all text in the design deliverables (presentation Powerpoints for meetings) was left editable so our client could make adaptations when sharing this resource across the Midwest.
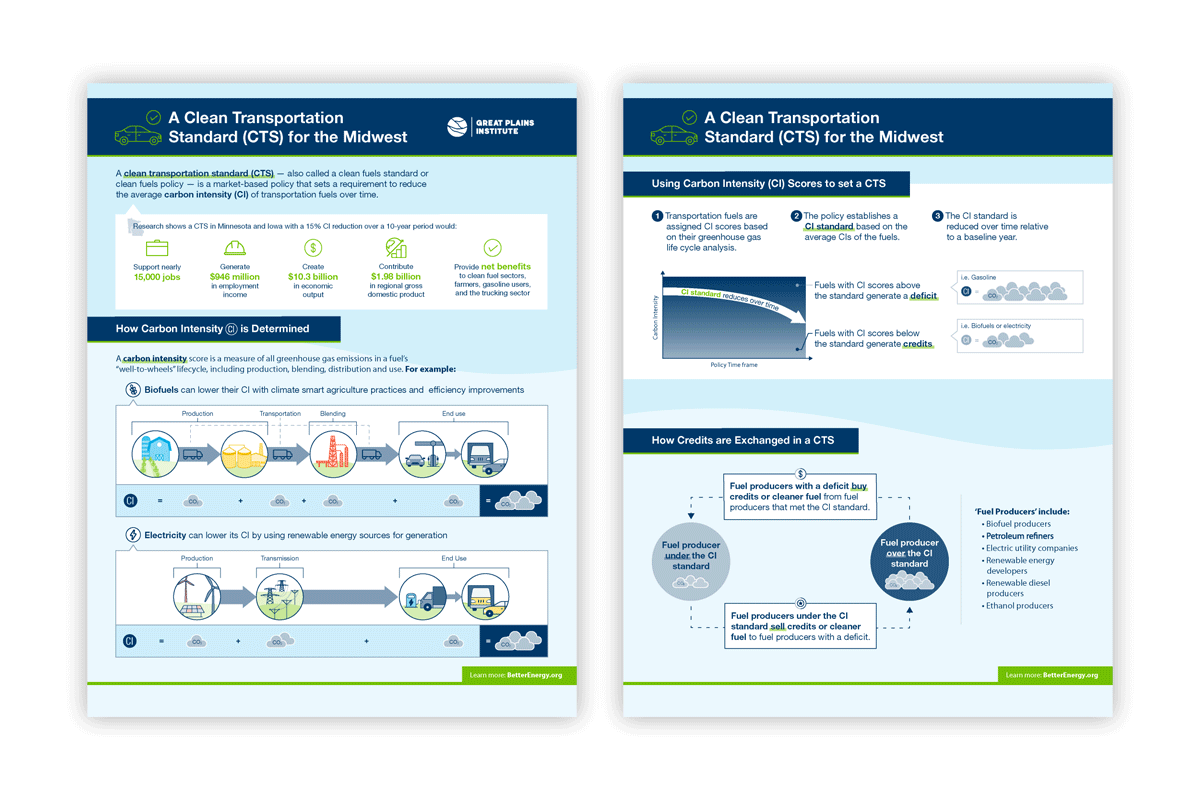
Policymakers have very little time to review new information and often do not have extensive background knowledge of new developments in environmental and social sustainability. To accommodate this type of audience, we worked with GPI to distill the most important content and structured it as a one-page document. This resource can be shared digitally, or printed and as a leave-behind for meetings with policymakers.
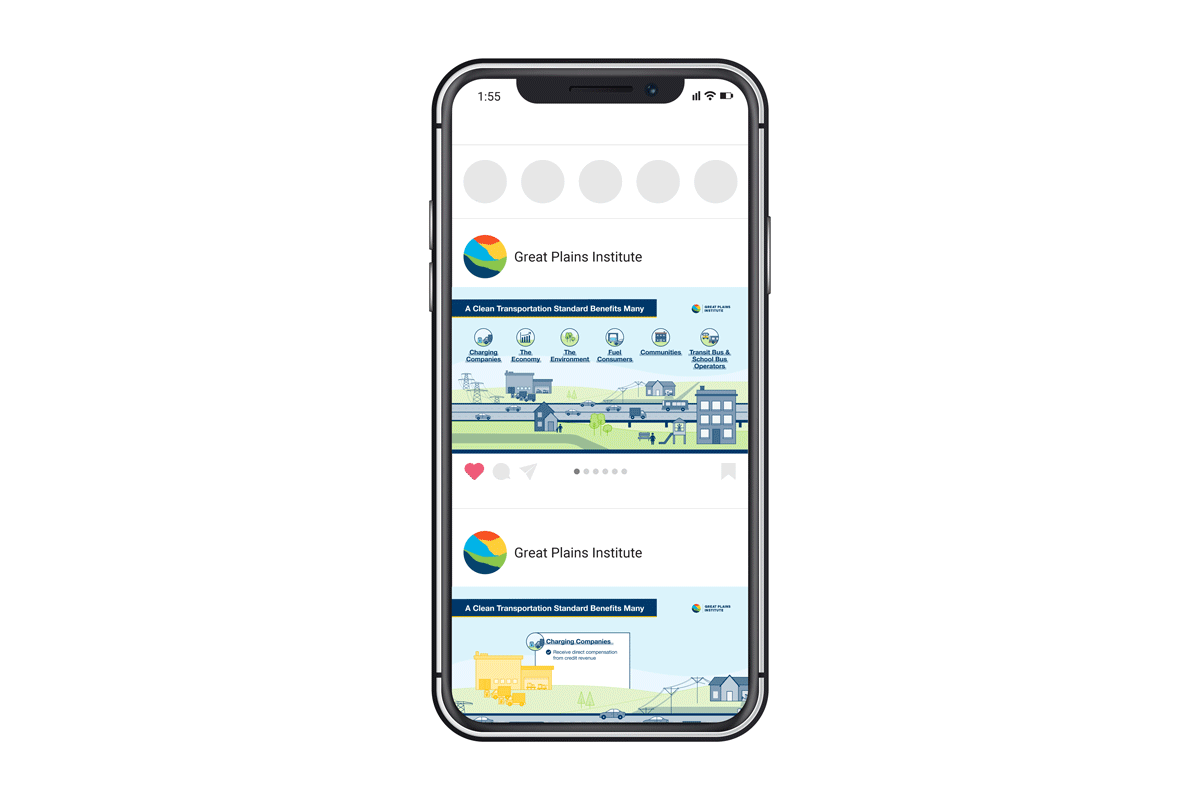
The expectations and background knowledge of a general audience varies significantly. If reaching people primarily through social media, it can be hard to compete with the large amounts of content shared daily. To combat this, we distilled the content of our graphics even further, pulling out only the most important, high-level content in small, highly visual graphics and short animations. Call to actions were added to visuals as a way to direct interested people to additional information.
International Institute for Democracy and Electoral Assistance (IDEA)
OVERVIEW
- Audiences: Regional & international policymakers
- Deliverables: Overview + conclusion infographics, infographic series for country-specific data, social media motion graphics
- Unique challenges: Some data points not available consistently from one country to the next
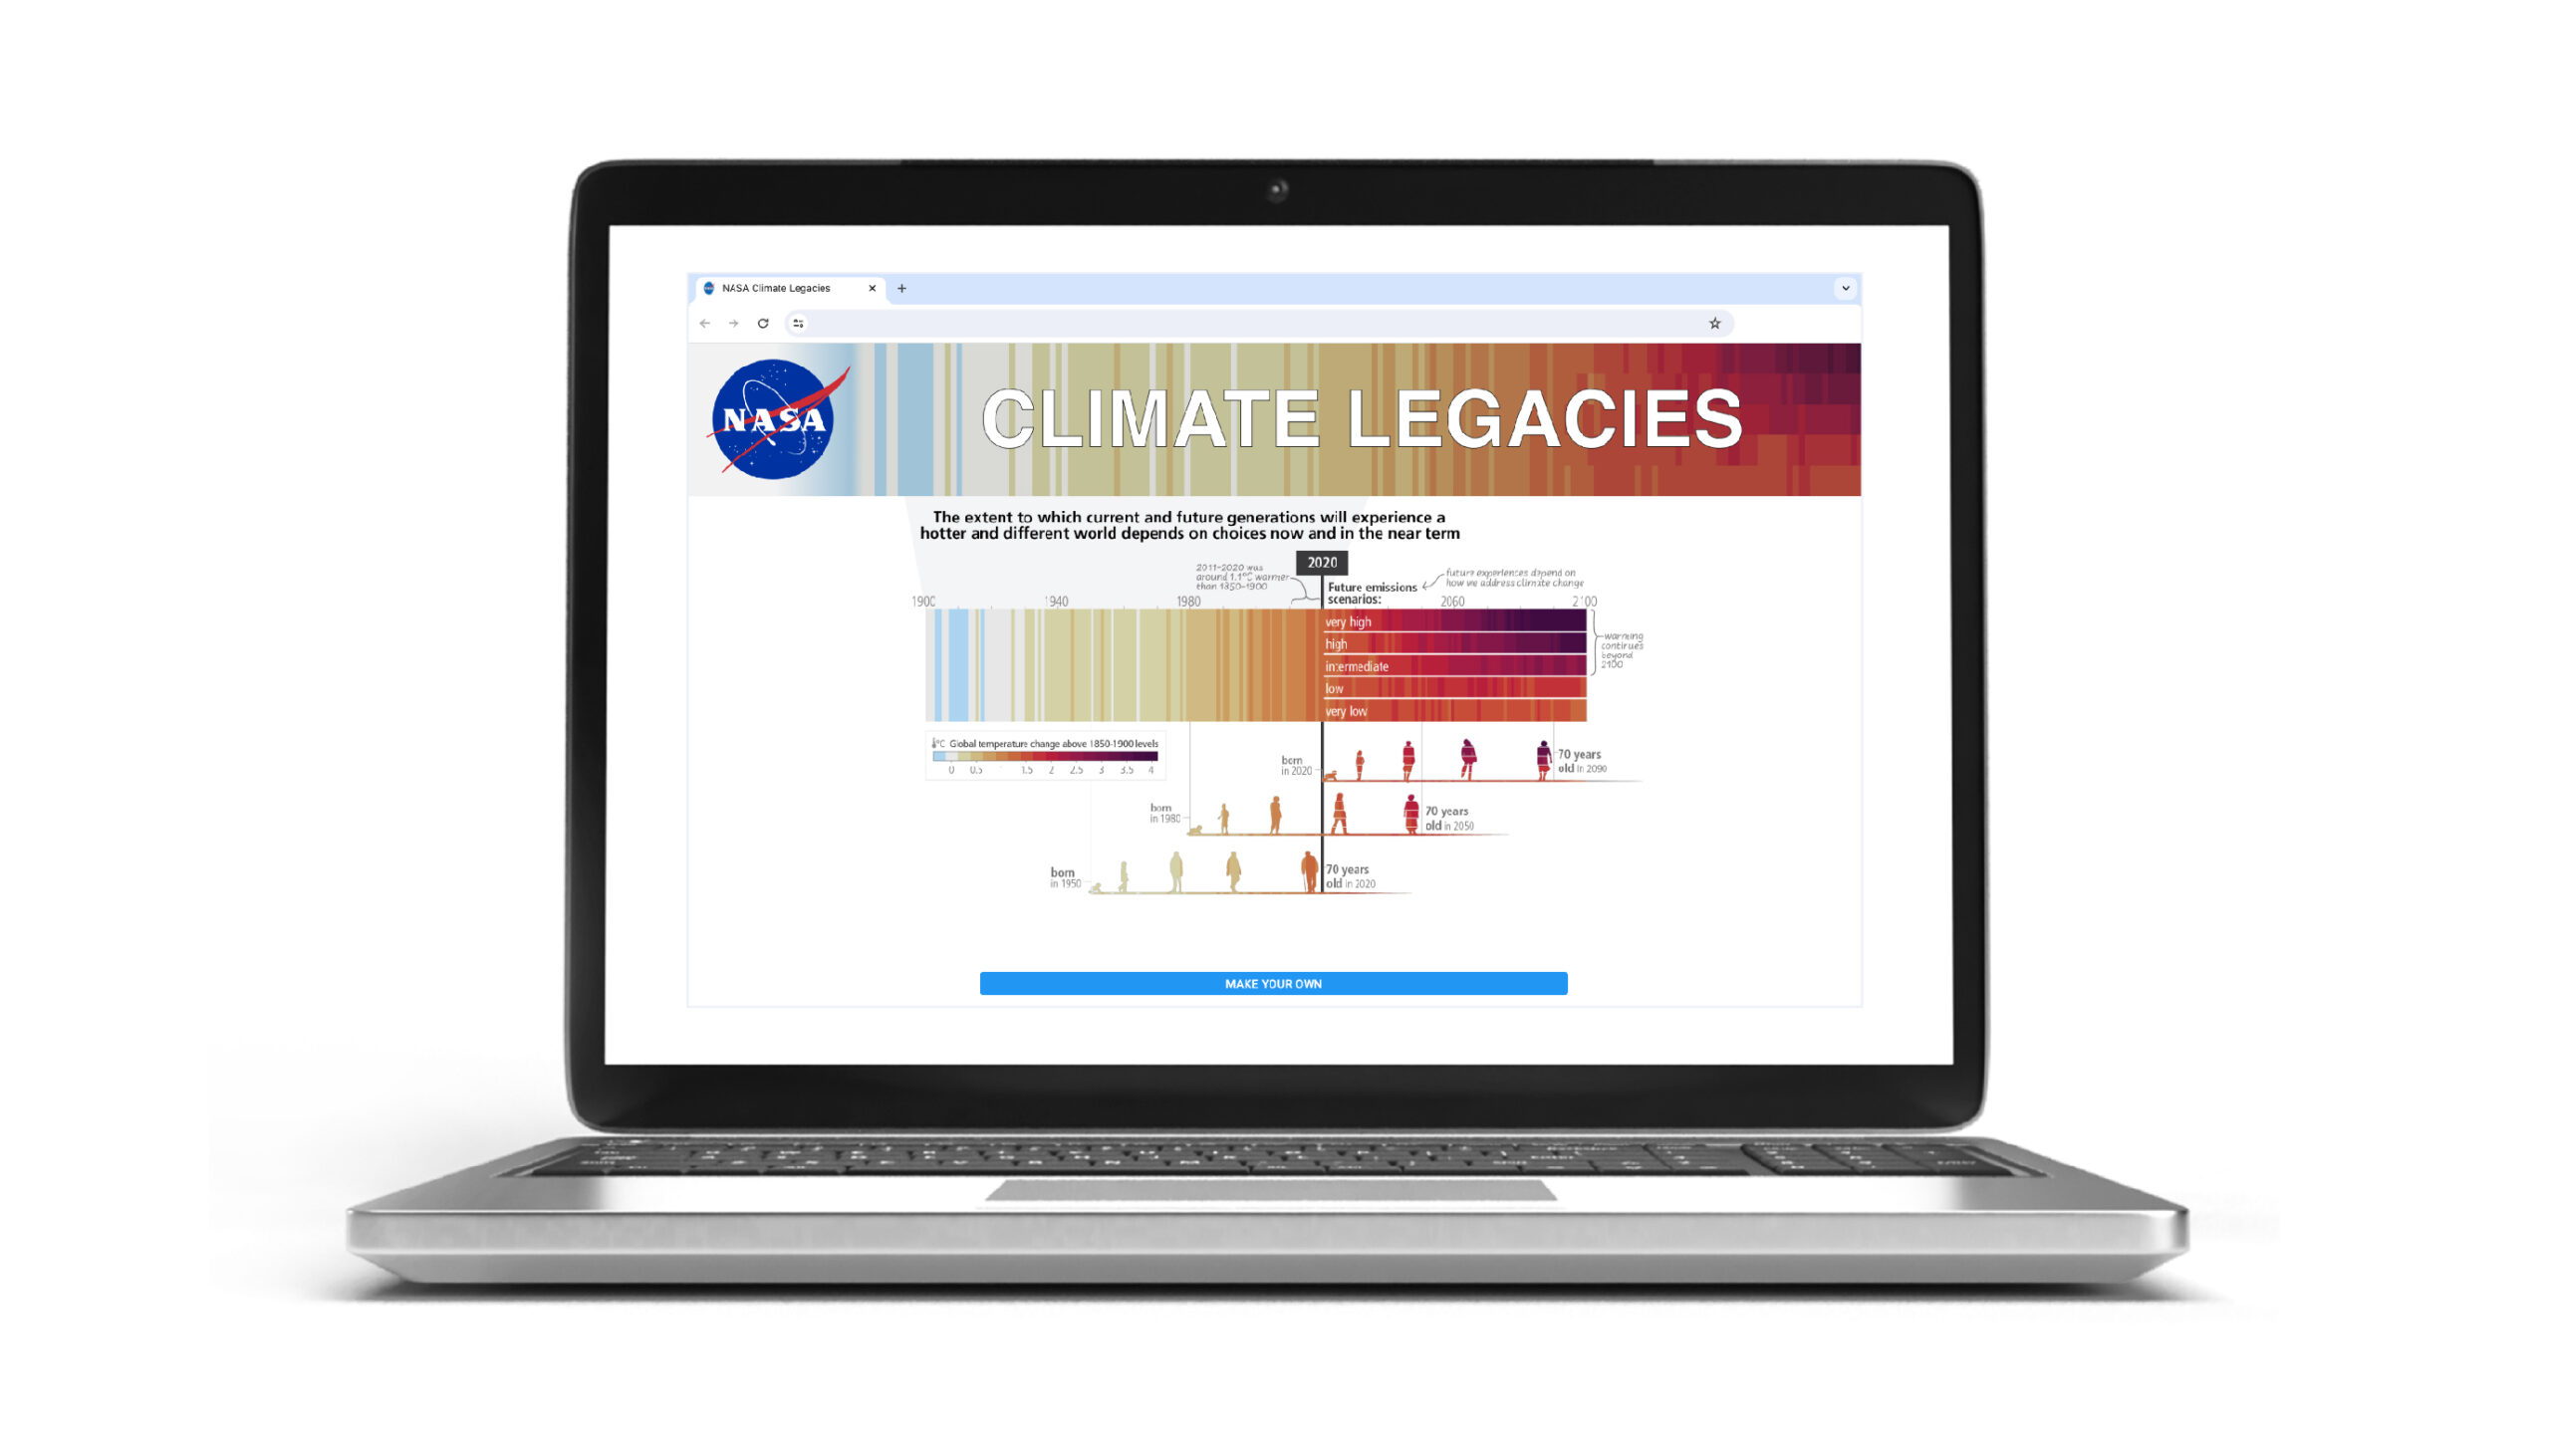
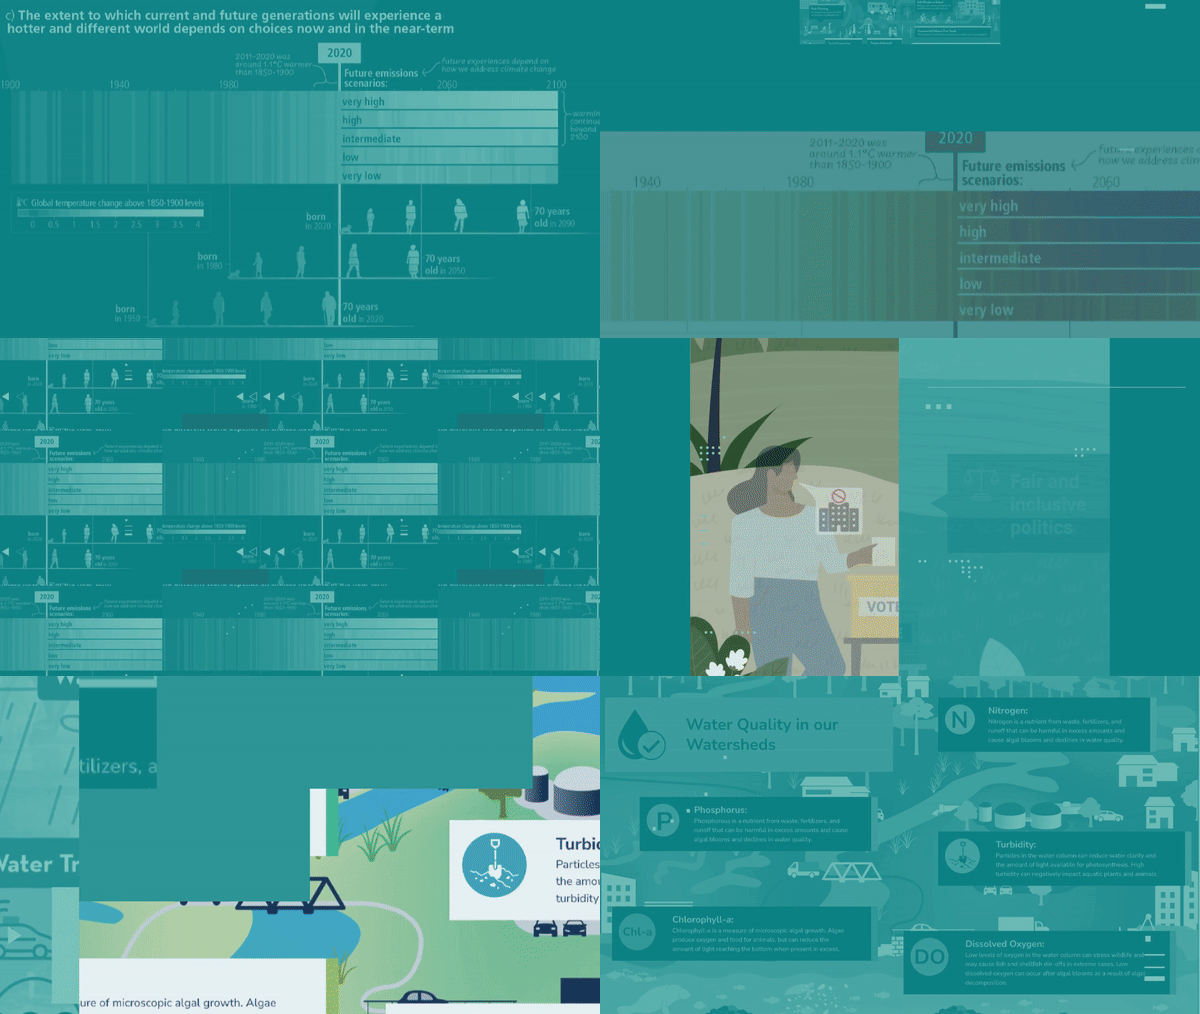
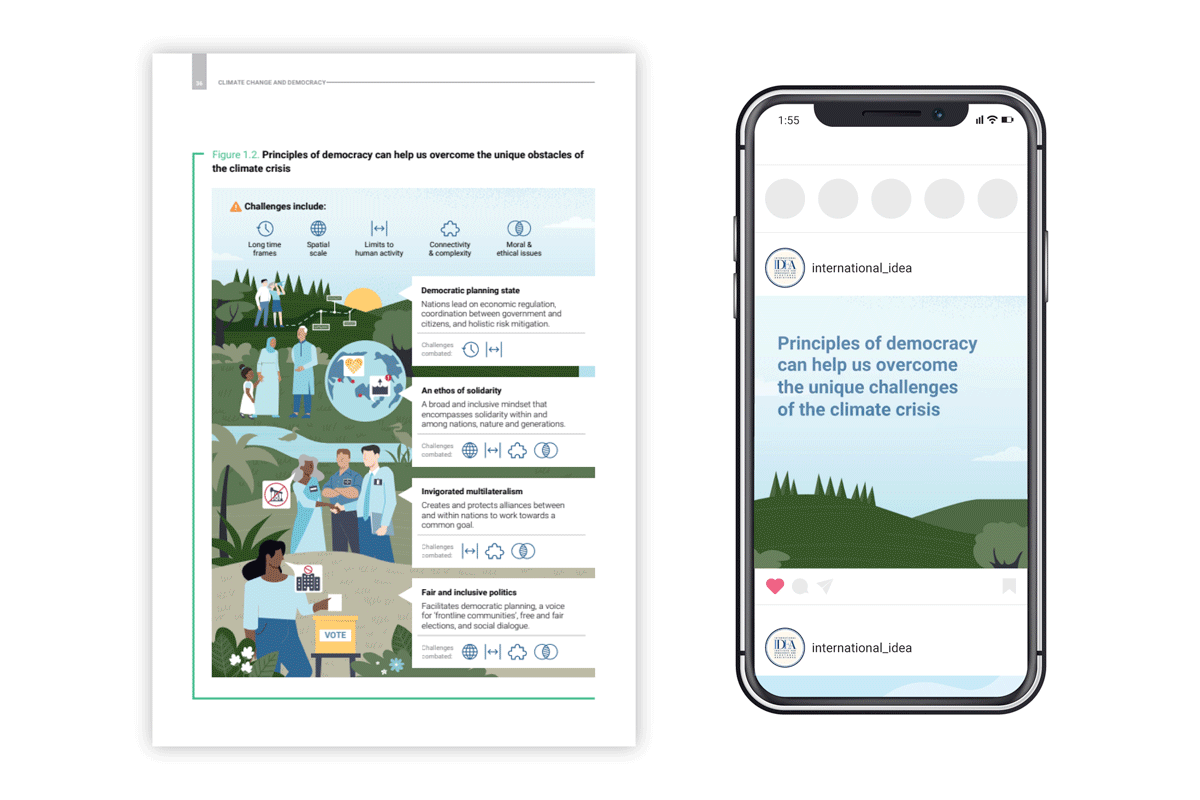
We were conscious of the needs of the audience (regional & international policymakers) when we designed the infographics summarizing findings of a report with the International Institute for Democracy and Electoral Assistance (IDEA).
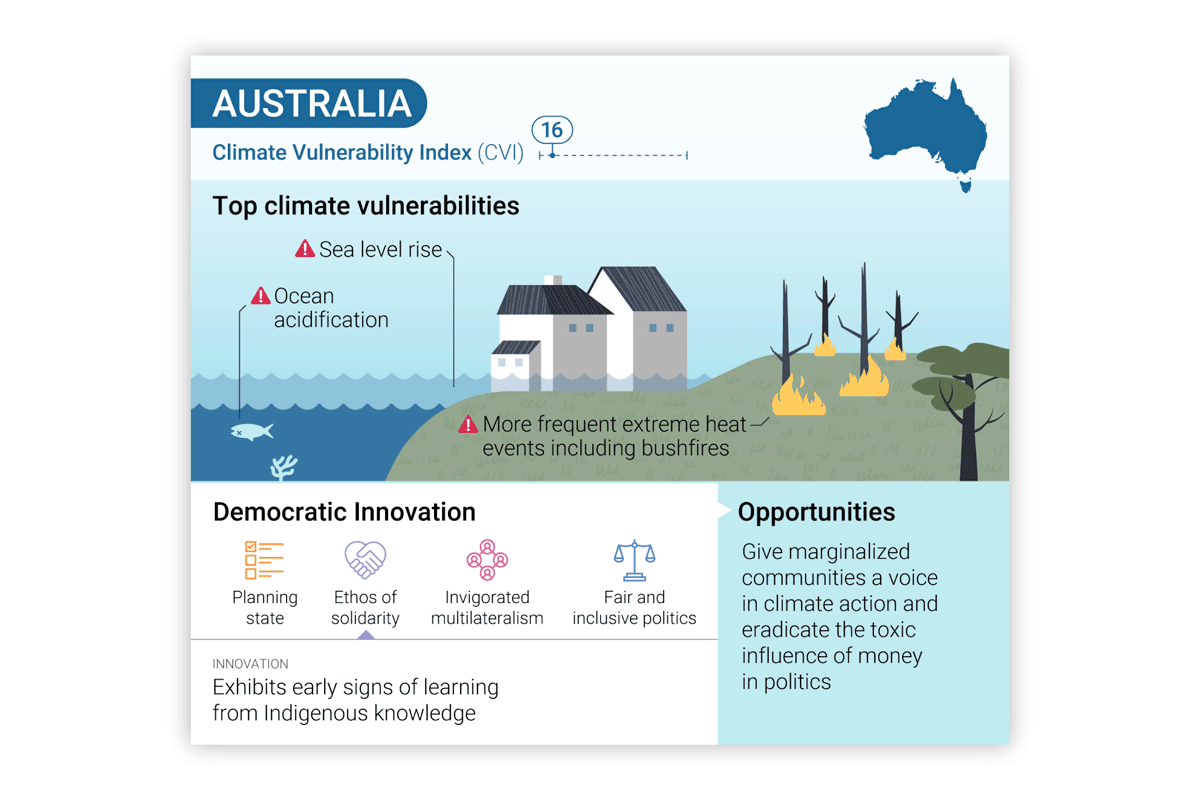
The series of infographics contain details on democratic innovation across 10 countries from the Asia and Pacific region and the audience needs both country-specific details as well as the ability to compare countries to one another. Our templated design facilitates this comparison and is structured so that data unavailable in some countries (due to the nuance of the information) doesn’t appear as a missing hole.
The infographics were developed so that a slight customization helps them work as both static graphics (for the report and presentations) as well as animated social media posts.
These 2 case studies demonstrate how –while it's impossible to design well for everyone– we can consciously design information and data to inform a variety of related audiances in an effective and budget-efficient manner.
