How we convey the meaning behind the numbers
When exciting data is released, it's tempting to share the numbers directly with your audience.
But there are two challenges with this approach:
- A non-expert audience may struggle to interpret complex data—or worse, they might take away the wrong message.
- Research* tells us that stories are more motivating than data and statistics alone.
This is where data storytelling is useful. After thoroughly understanding the message within the data, ask yourself: “How is this story relevant to my audience?” The right narrative and visual framework will help the audience understand and connect with the data, leading to behavior change.
Choose the right type of data visual
To choose the appropriate chart structure, identify the type of data (e.g. comparison, parts of a whole, distribution) and reference our data visualization flowchart or a resource like Data Viz Project.
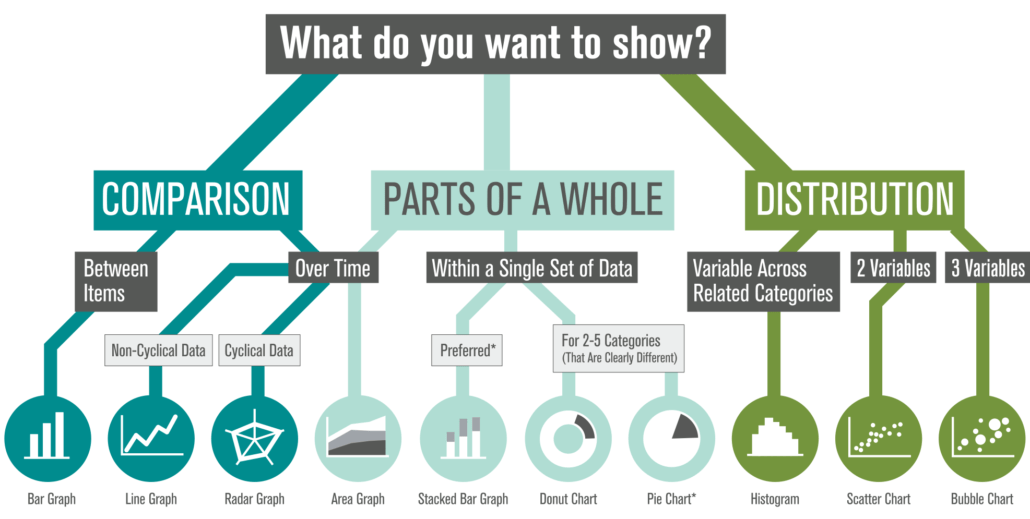
ABOVE: Follow the flowchart to identify an appropriate chart structure. This article covers examples related to Comparison.
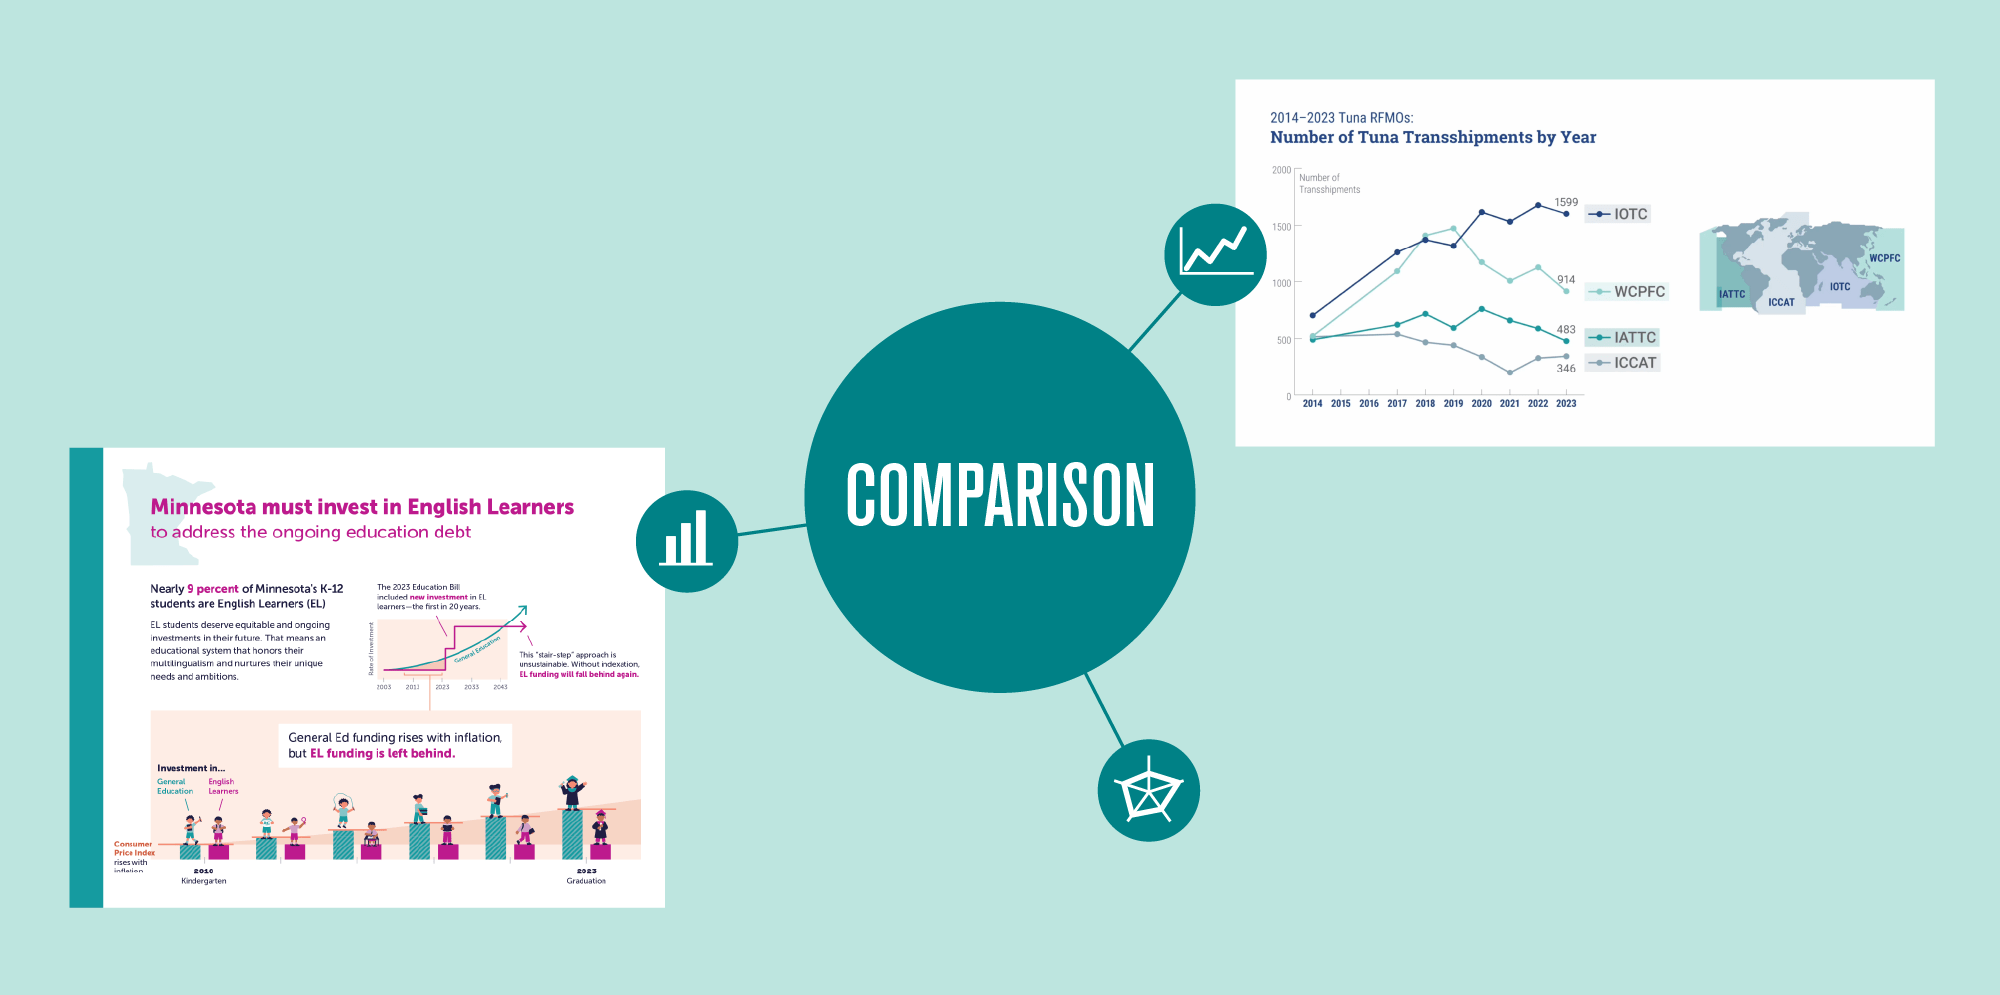
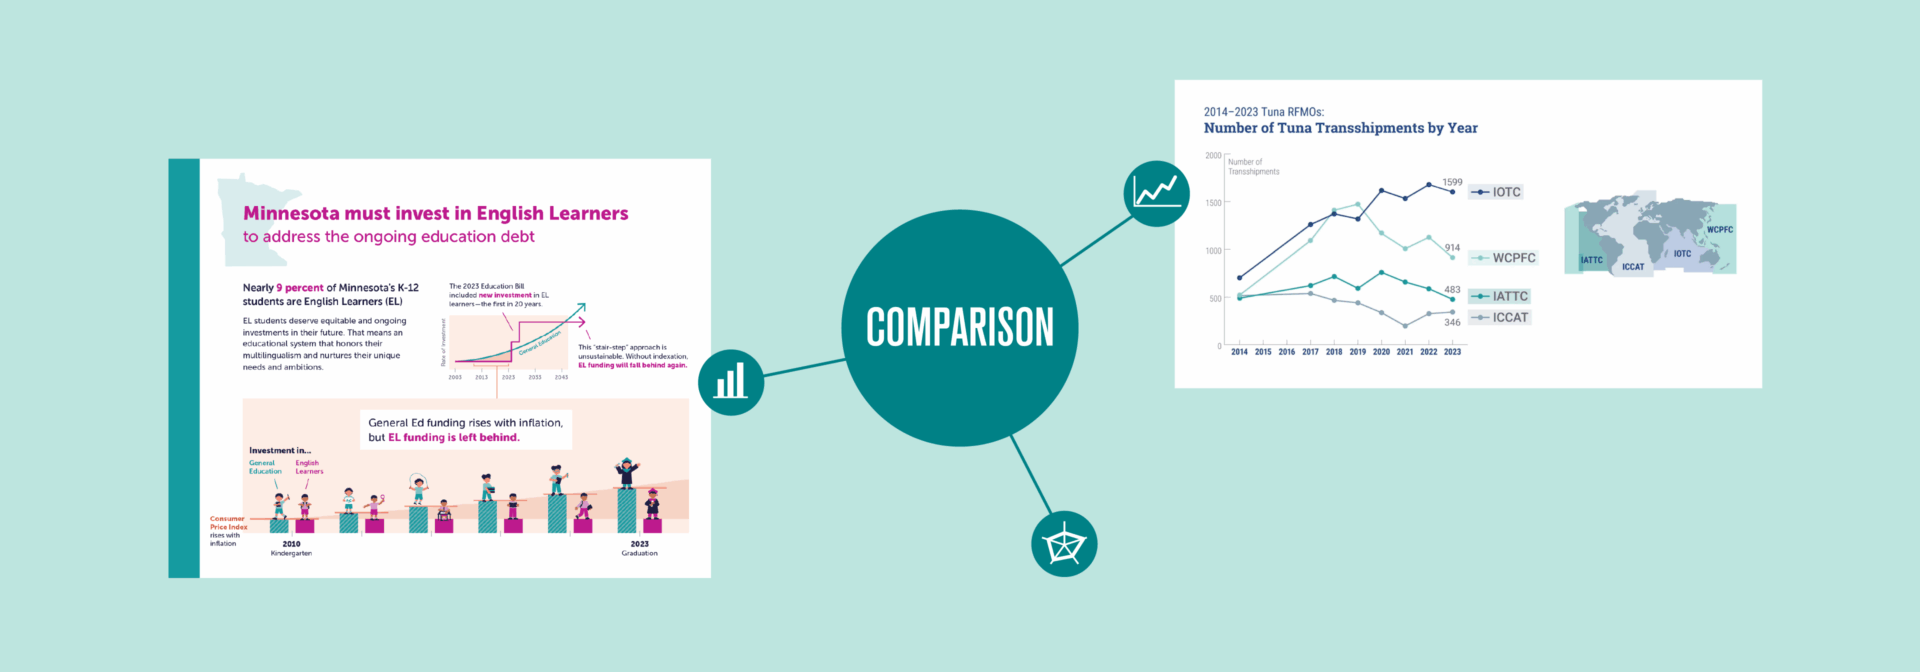
Once the structure is decided, we use storytelling to help the content come to life for the audience. Here are two case studies that show the story behind “Comparison” data.
Use illustration to show context and human impact
Case study: Minnesota Education Equity Partnership
The Story
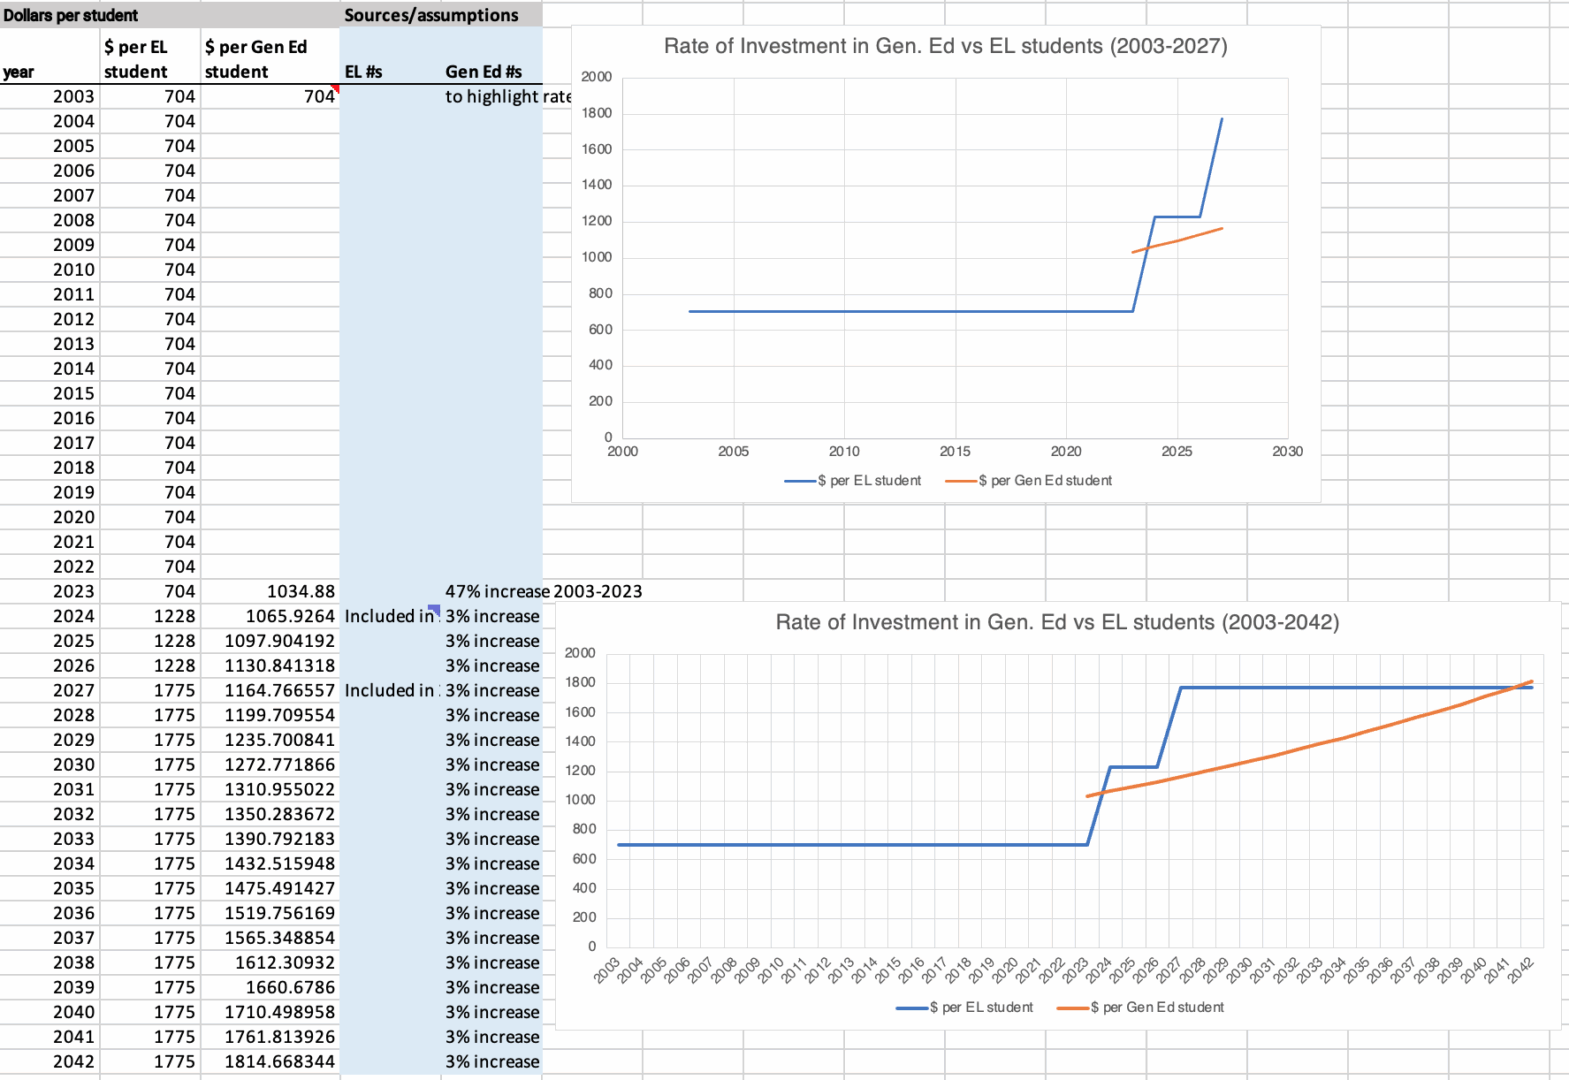
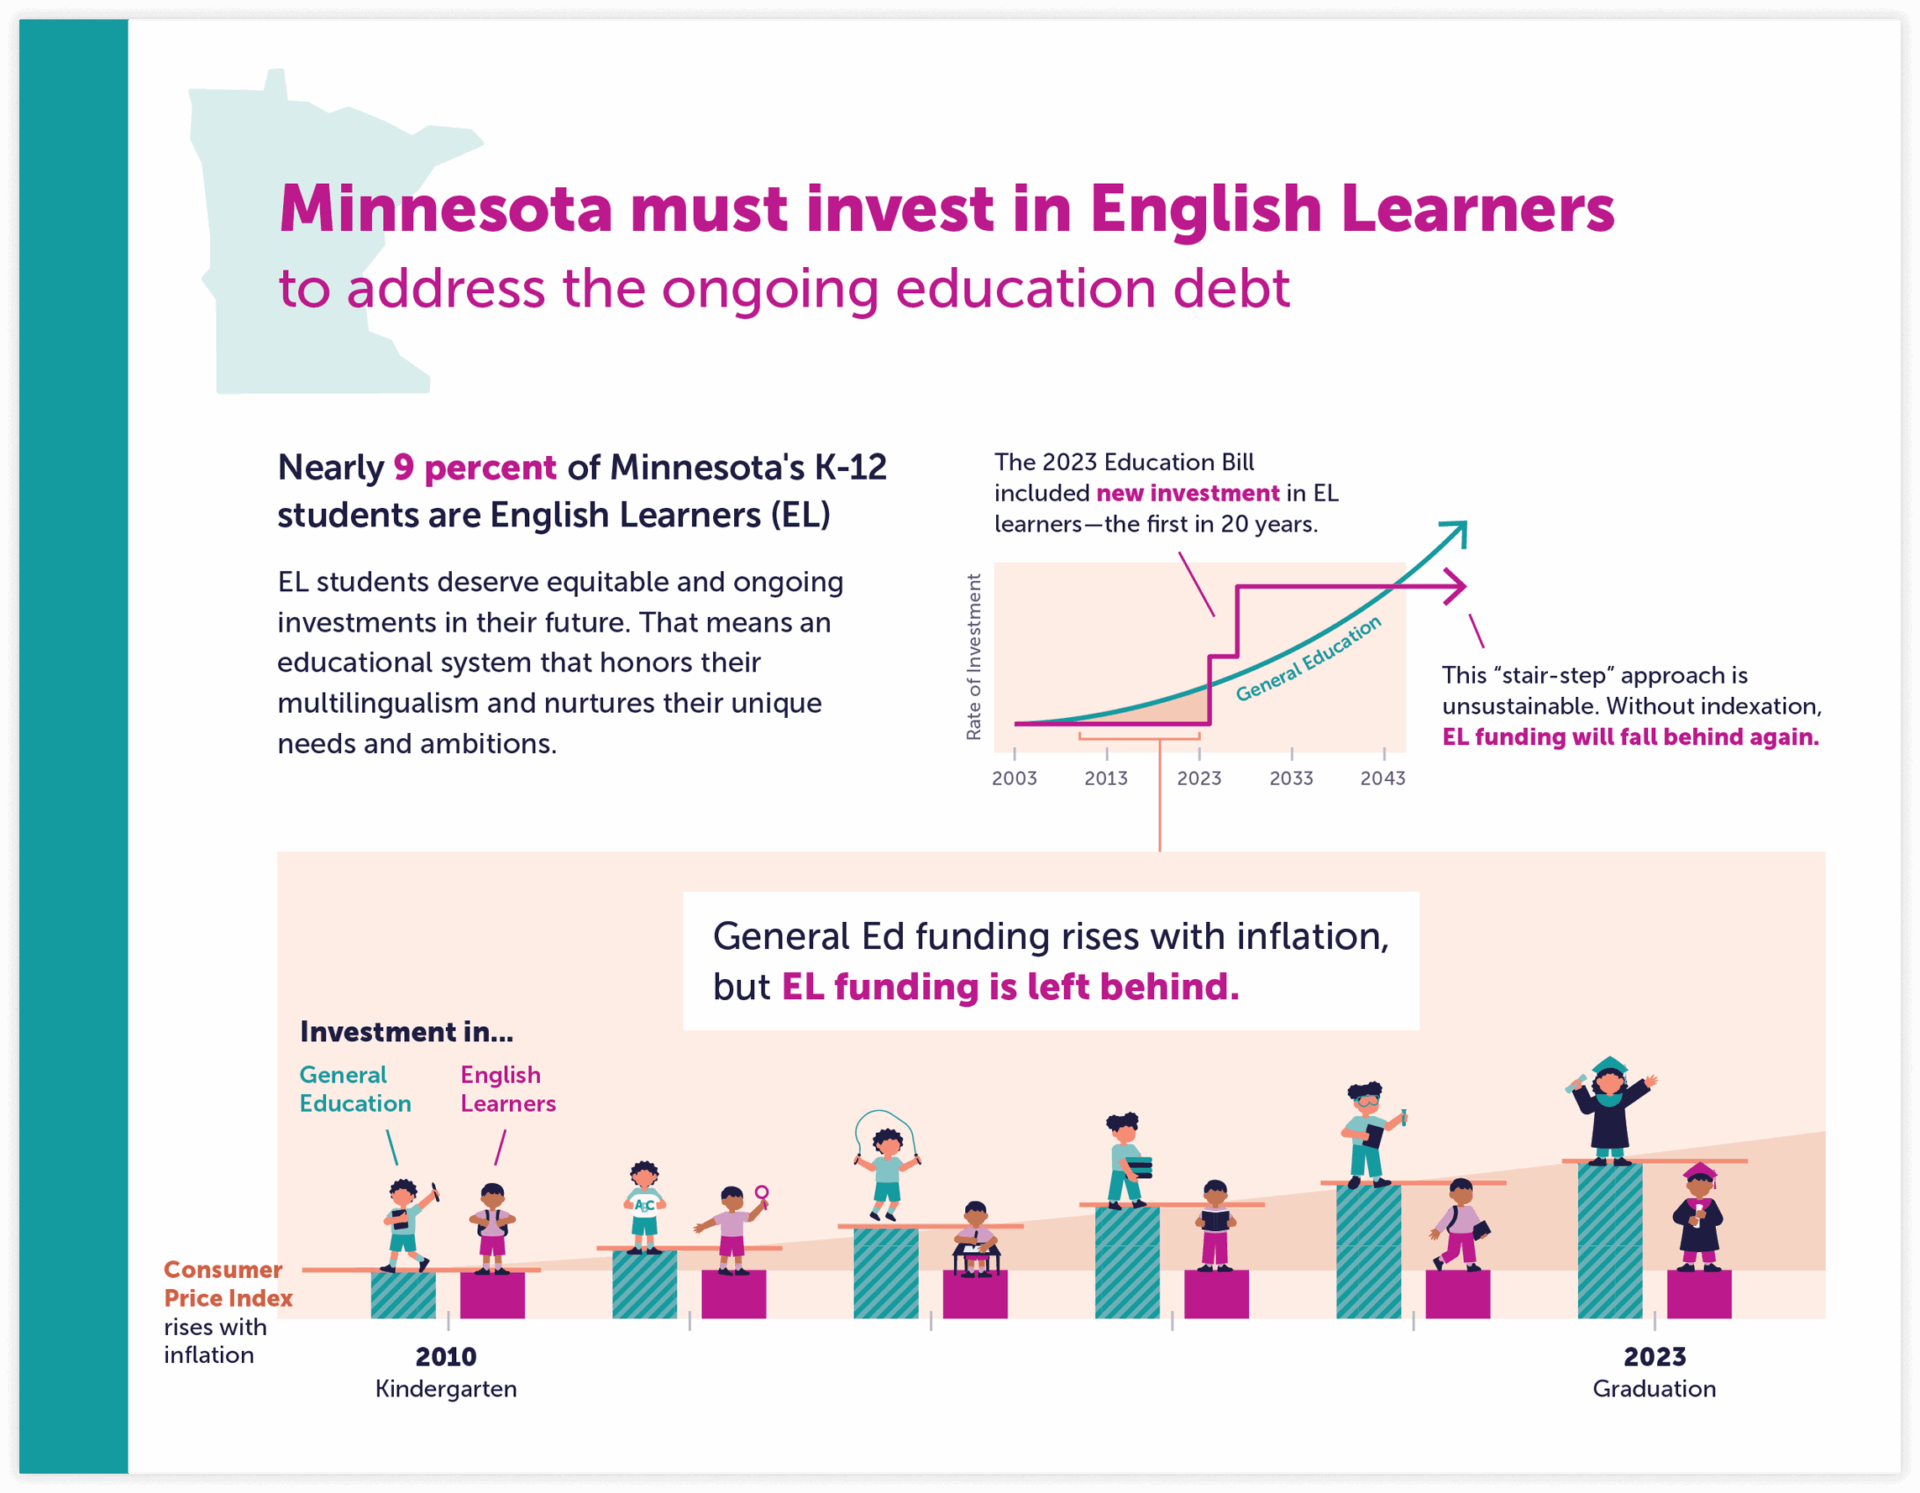
State funding for General Education—the pool of funds that supports all students—rises with inflation, but additional support for English Learners is dependent on one-off bills. As a result, funding for English Learners is consistently left behind as inflation grows. English Learner students will continue to be left behind until Minnesota ties the funding to inflation.
The Data
Minnesota state funding for General Education vs. English Learners per year
The Result
Knowing the data and story, our aim was to compare resource allocation for General Education and English Learner students over time. While a line graph can also be a good choice for this type of data, we felt a bar graph better showed the discrete differences between these two categories.
The resulting infographic shows the funding gap through two children’s journeys from kindergarten to graduation. With this framework, it’s easy to see how English Learners fall behind as the gap grows over time.
Visuals like photos and illustrations put numbers into context and emphasize the human impact. When our team combines data and storytelling, we often use illustrations to show the problem to the reader through an emotional lens, not just an analytical one.
Guide the audience through layers of information
Case study: International Seafood Sustainability Foundation
The Story
The number of tuna transshipments rose rapidly in the late 2010s, then decreased due to the COVID-19 pandemic. During that time, some RFMOs made changes to improve their oversight. But there are further steps they should take to align with best practices and close the oversight gaps.
The Data
Number of Tuna Transshipments per year by Regional Fisheries Management Organization (RFMO)
The Result
Knowing the data and story, our aim was to compare the number of tuna transshipments over time while providing context for the numbers. A line graph with “layered’ interaction is a great way to do this.
This line graph provides a backdrop for callouts that appear as the user scrolls down the webpage. Each callout highlights one piece of information, or provides one additional detail, to help the audience understand the data. We also gave geographic context by sharing a small view of each RFMO’s location on a map.
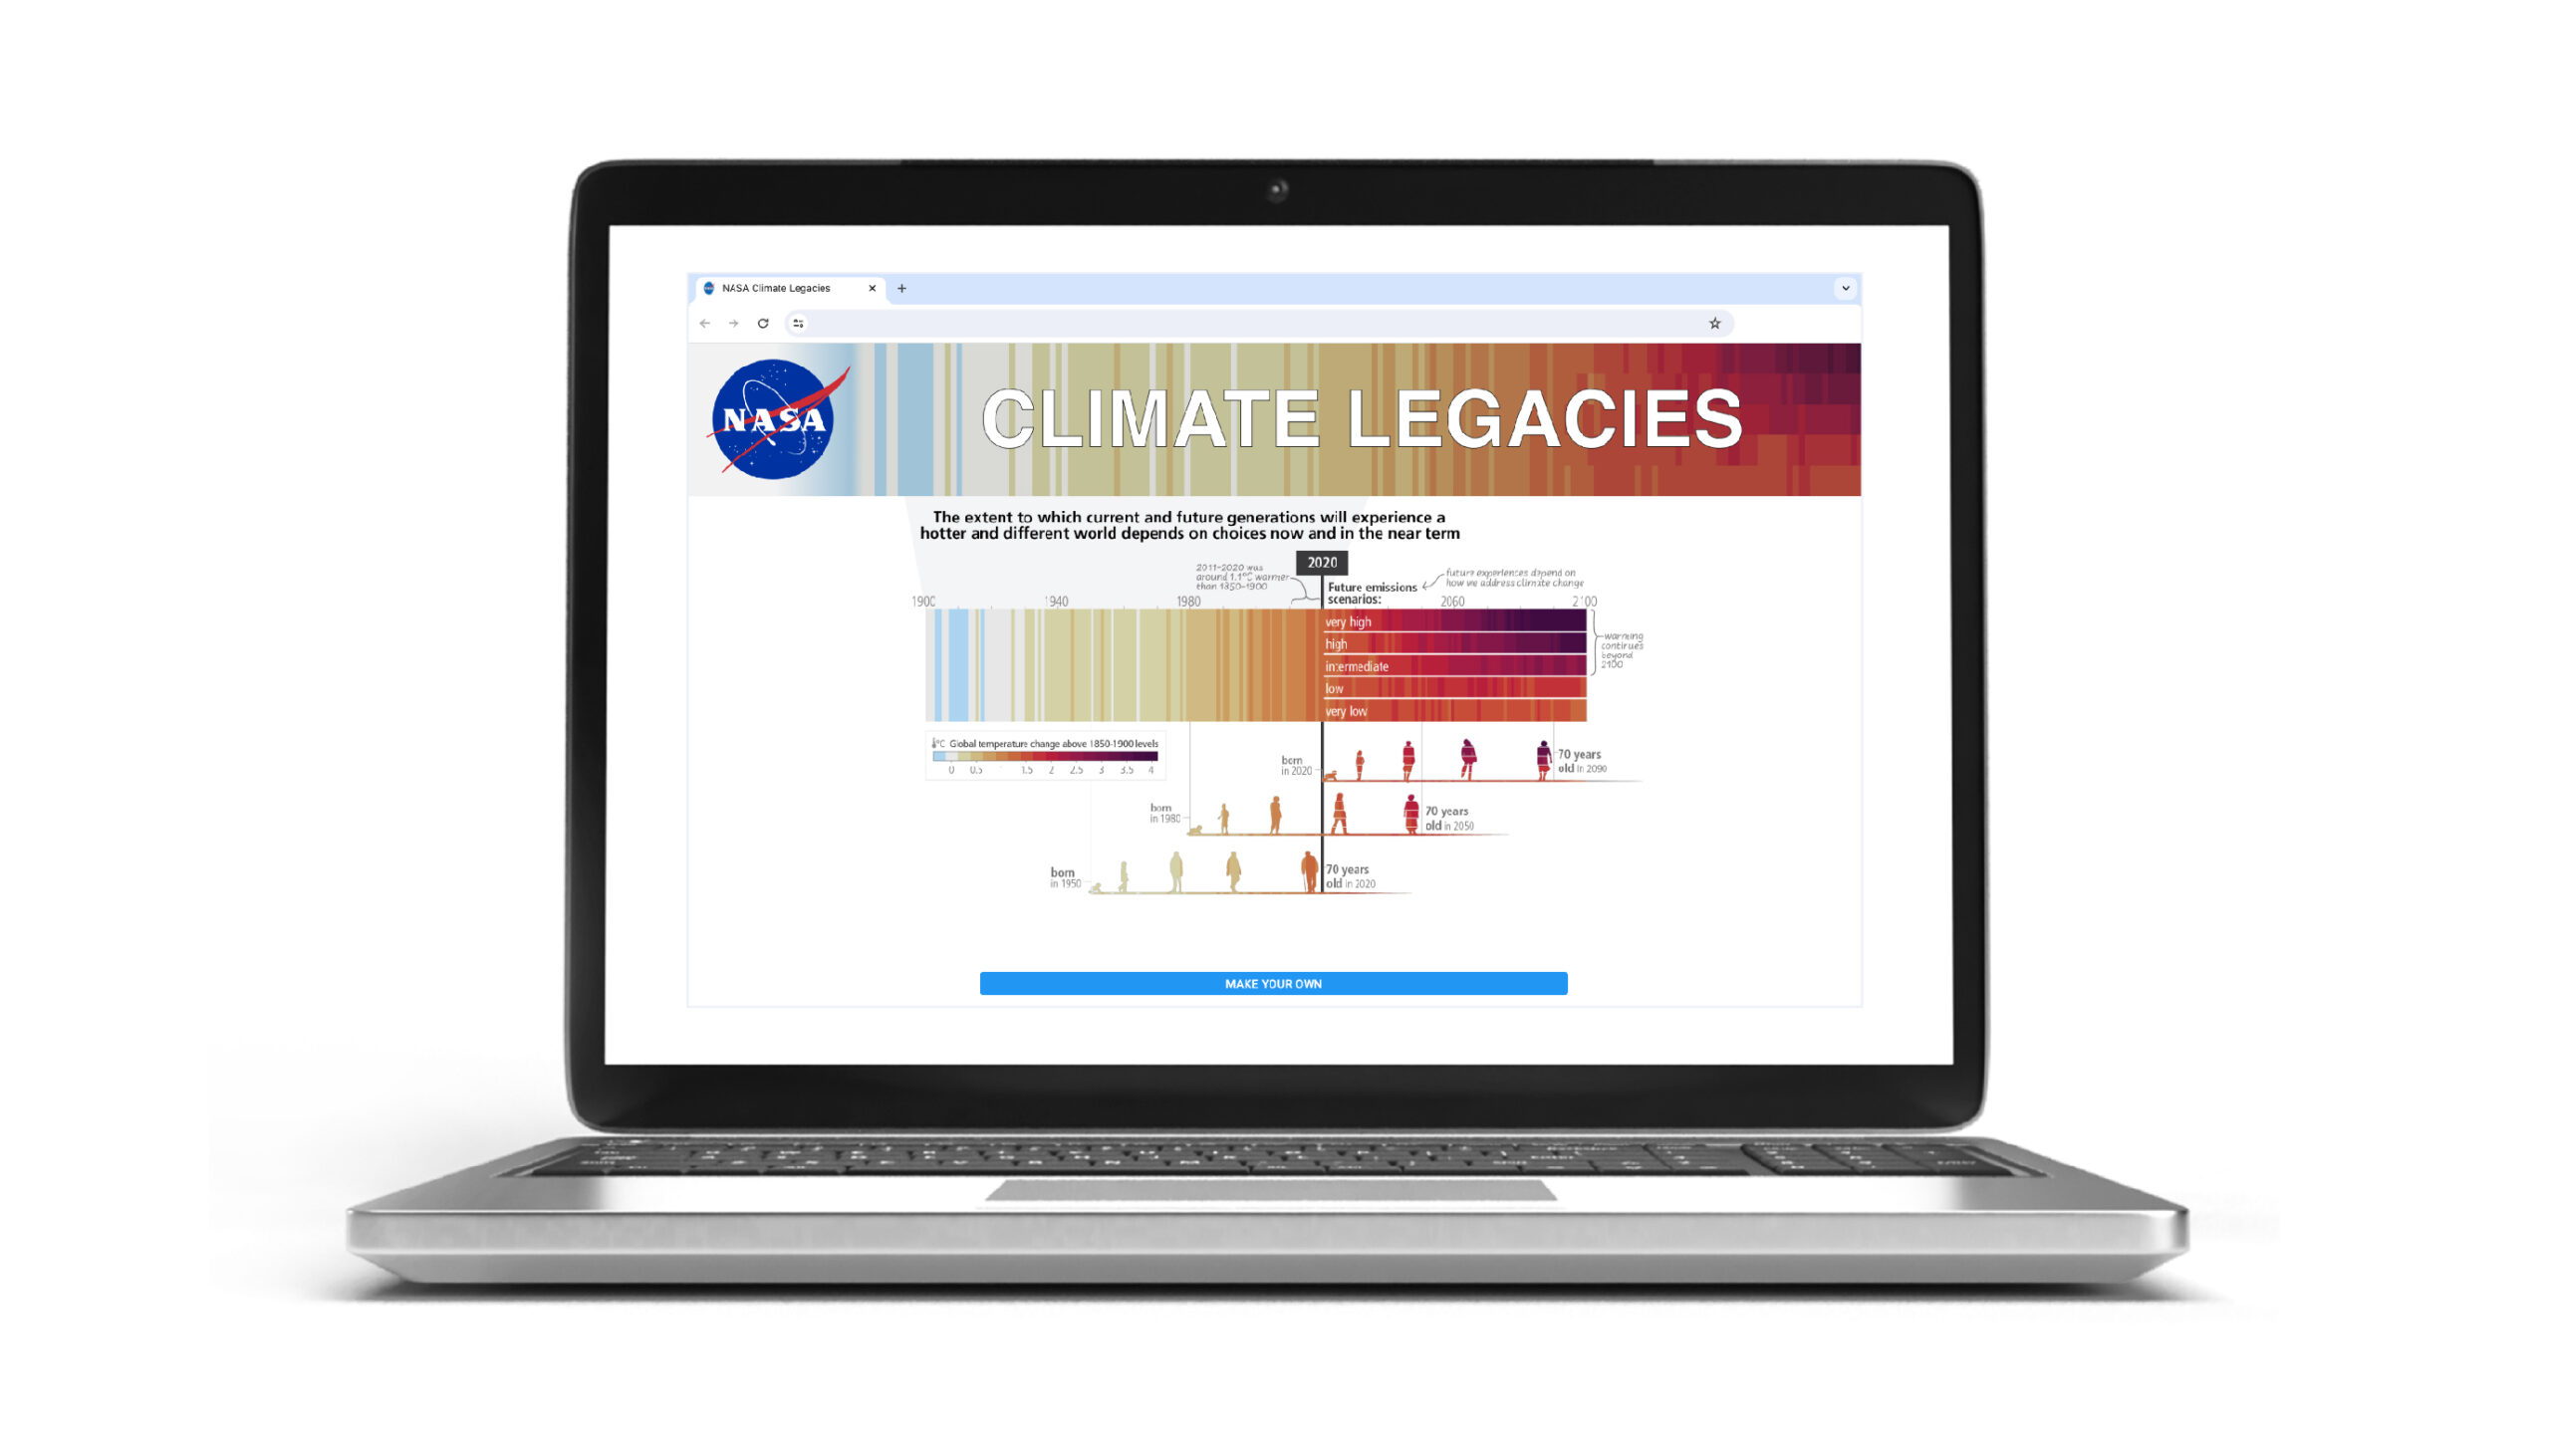
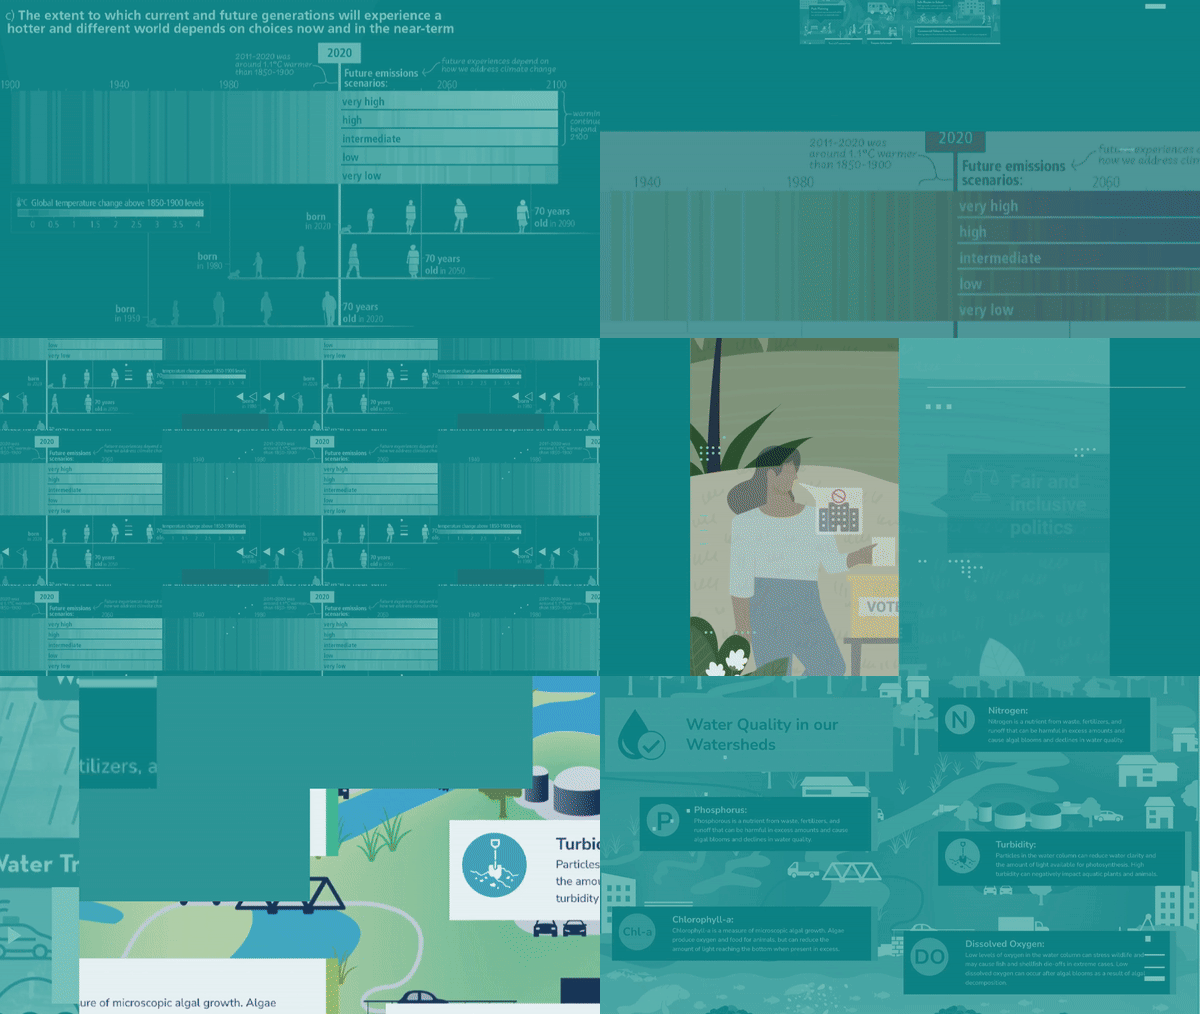
Additional layers of information can help the audience understand what the numbers mean. We use tools like visual callouts, motion graphics, and interaction to provide context on top of the data.
These examples provide a glimpse into how our team combines data and story. Next time you have the opportunity to share data, consider how you can use storytelling techniques to provide a framework for your audience.
Next article: Telling Stories with Parts-of-a-Whole Data (coming soon!)
“Background Stories took time to understand our area of expertise, wading into a sea of analysis and data. The series of infographics Background Stories created reflects the rigor of our work while remaining approachable, effectively drawing in our audience.”
—Stuart Shell, Associate Principal, Branch Pattern

