A step-by-step guide to our collaborative process
Visual storytelling is a powerful tool to help people understand and engage deeply with complex information.
Whether developing an infographic, printed sign, or animated video, we approach every project with a time-tested collaborative process. We can help your team benefit from the power of visual stories.
We’ve refined this process over the years to find a good balance of client-facing steps and “backstage” steps—in other words, the work we do behind the scenes.
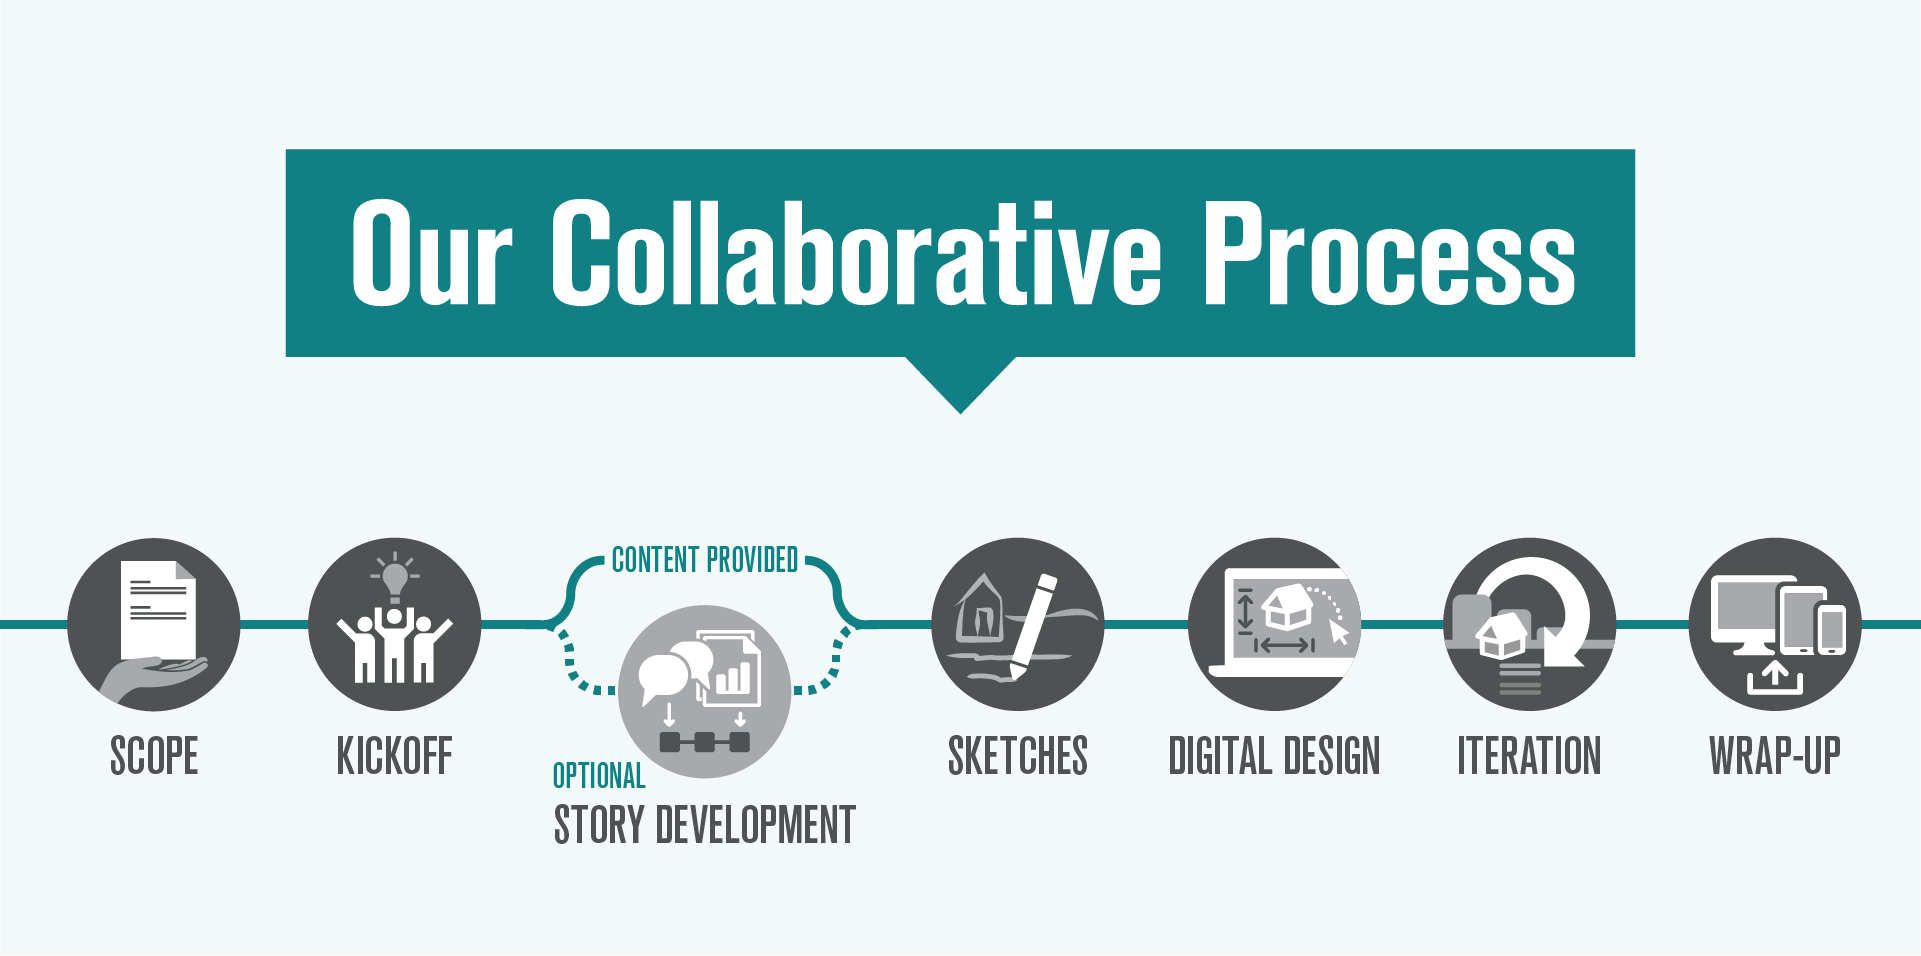
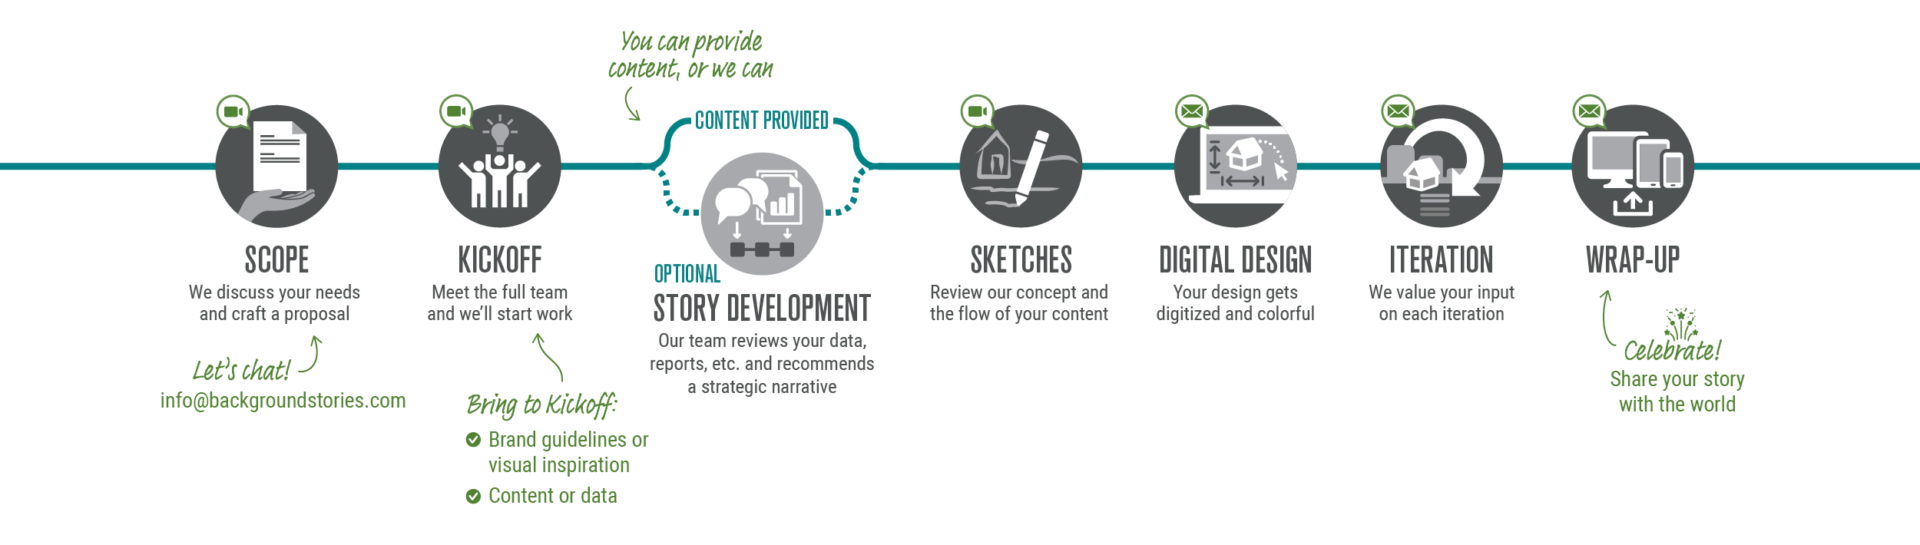
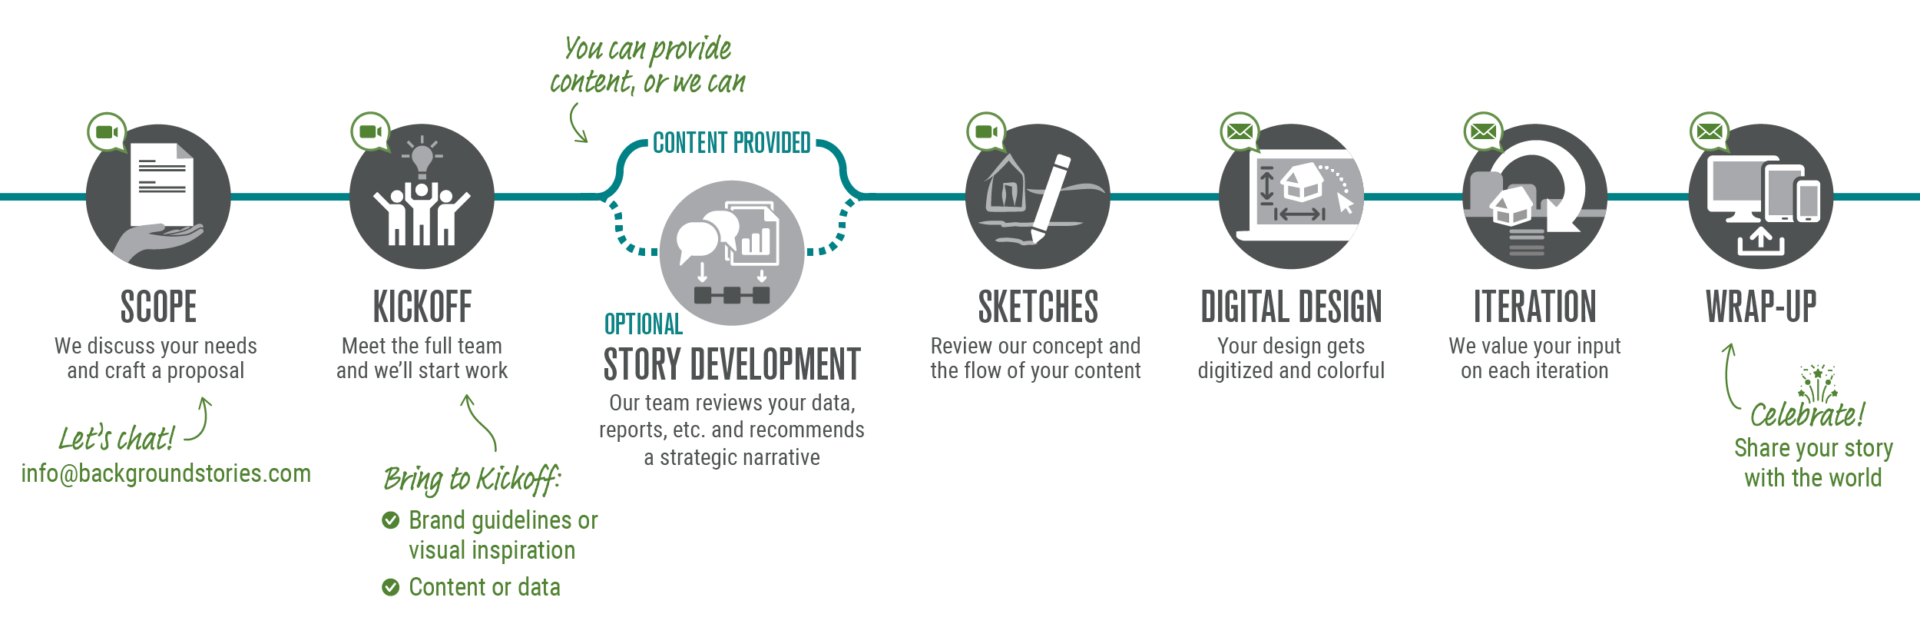
Your Path with Background Stories
- Scope
- Kickoff
- Story Development (optional)
- Sketches
- Digital Design
- Iteration
- Wrap-Up
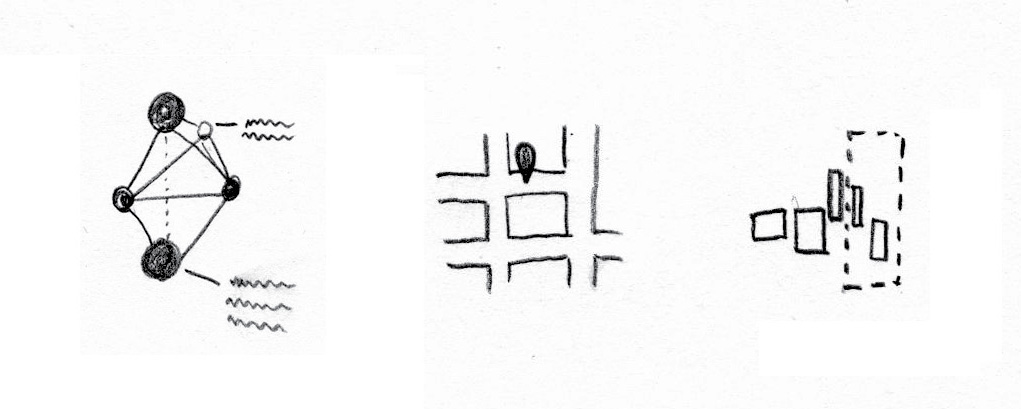
Scope
- Consider these questions:
- What is the budget?
- What is the scope?
- What is the deadline?
- Do I have a refined content outline? (If not, we can help! Our capabilities include research and content development.)
- Who will be the primary point of contact on my team?
- We’ll discuss these questions with you and craft a proposal specific to your needs.
- Review and accept that proposal to start working together.
- Share any relevant background materials, including existing brand guidelines and data. We like to review these ahead of the kickoff meeting.
Kickoff
- Consider these questions:
- Who is my audience? (If needed, we can adapt a visual story for multiple audiences.)
- What are my goals?
- What key messages do I want to communicate?
- What are my deliverables?
- Share any examples that inspire your team.
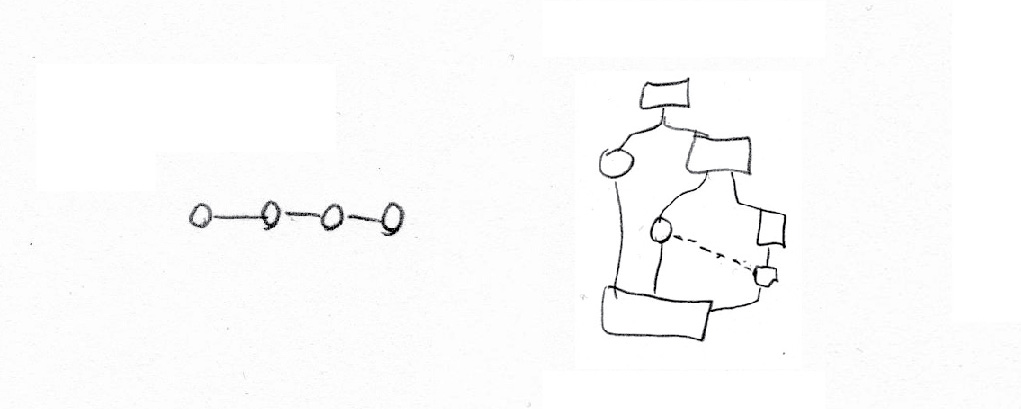
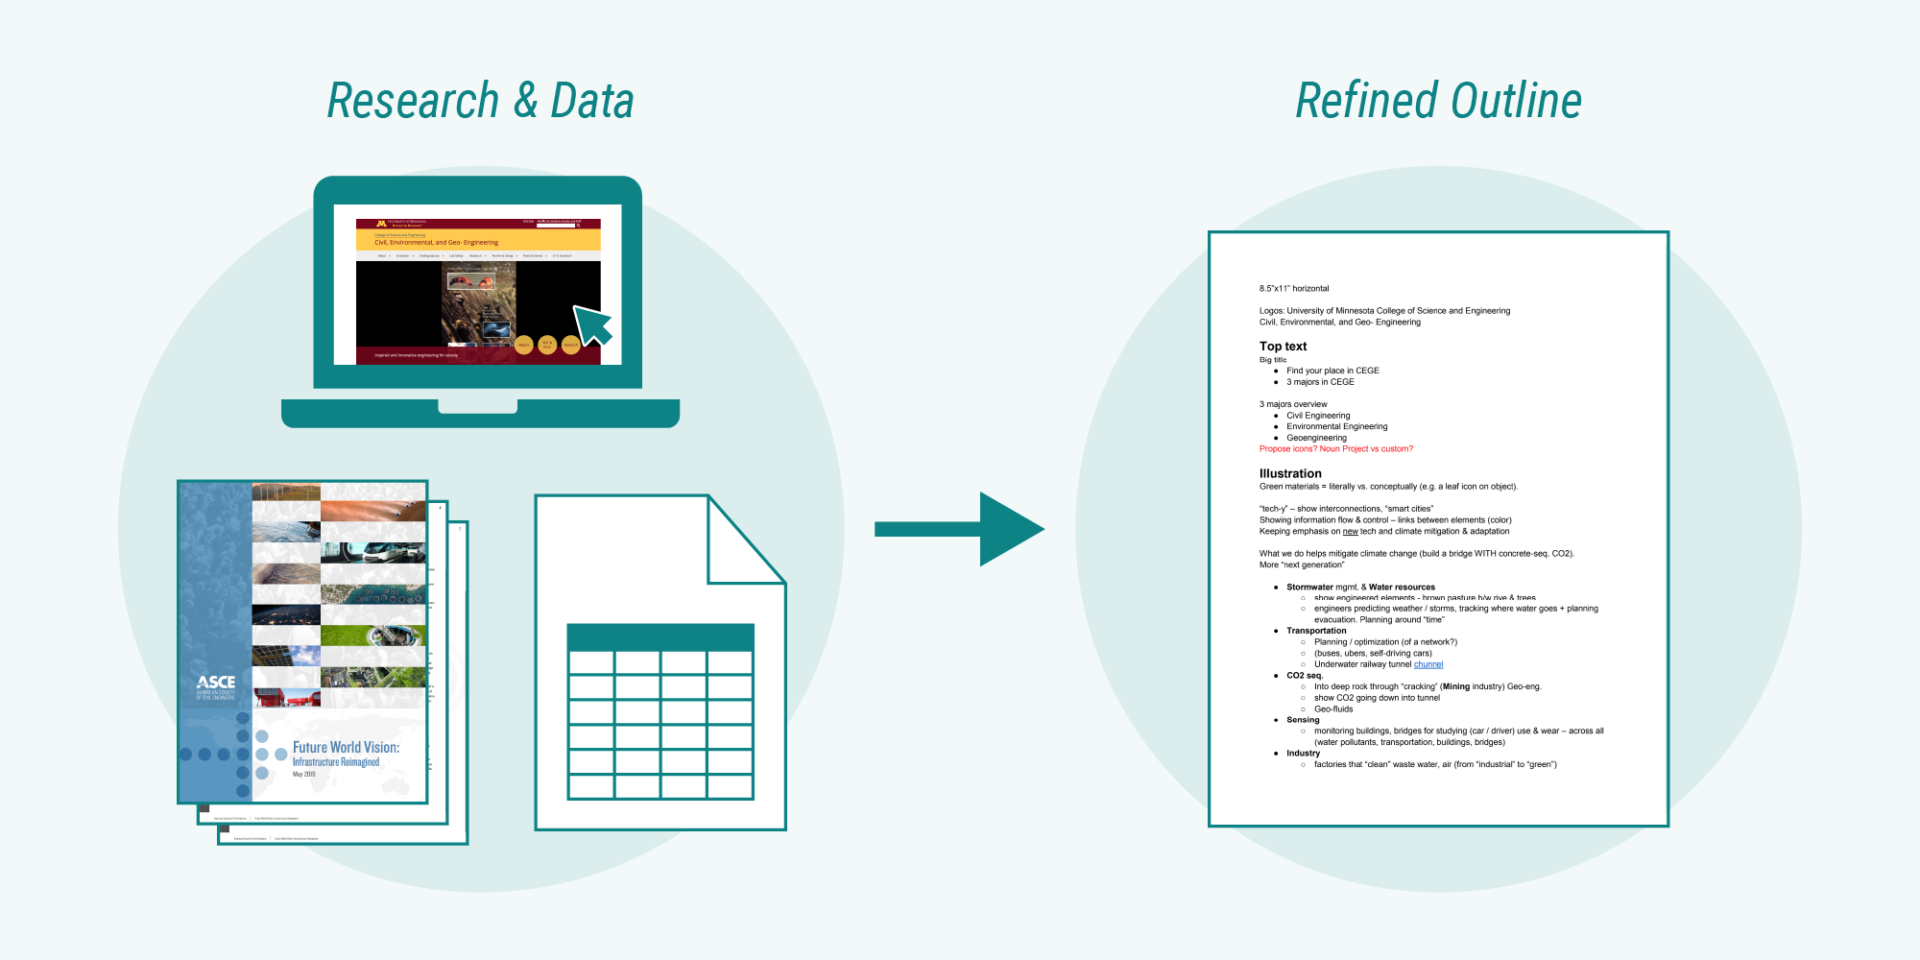
Story Development (Optional)
You can provide content to us, or we can develop content based on raw materials that you provide. When we do Story Development, we’ll share an outline and ask you to provide feedback.
If you provide content, we’ll make high-level recommendations to refine the story in a visual format and tune it to your audience.
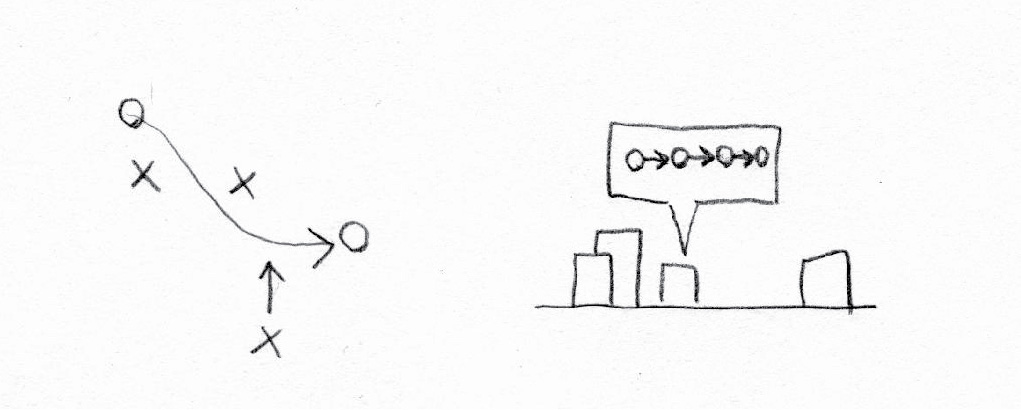
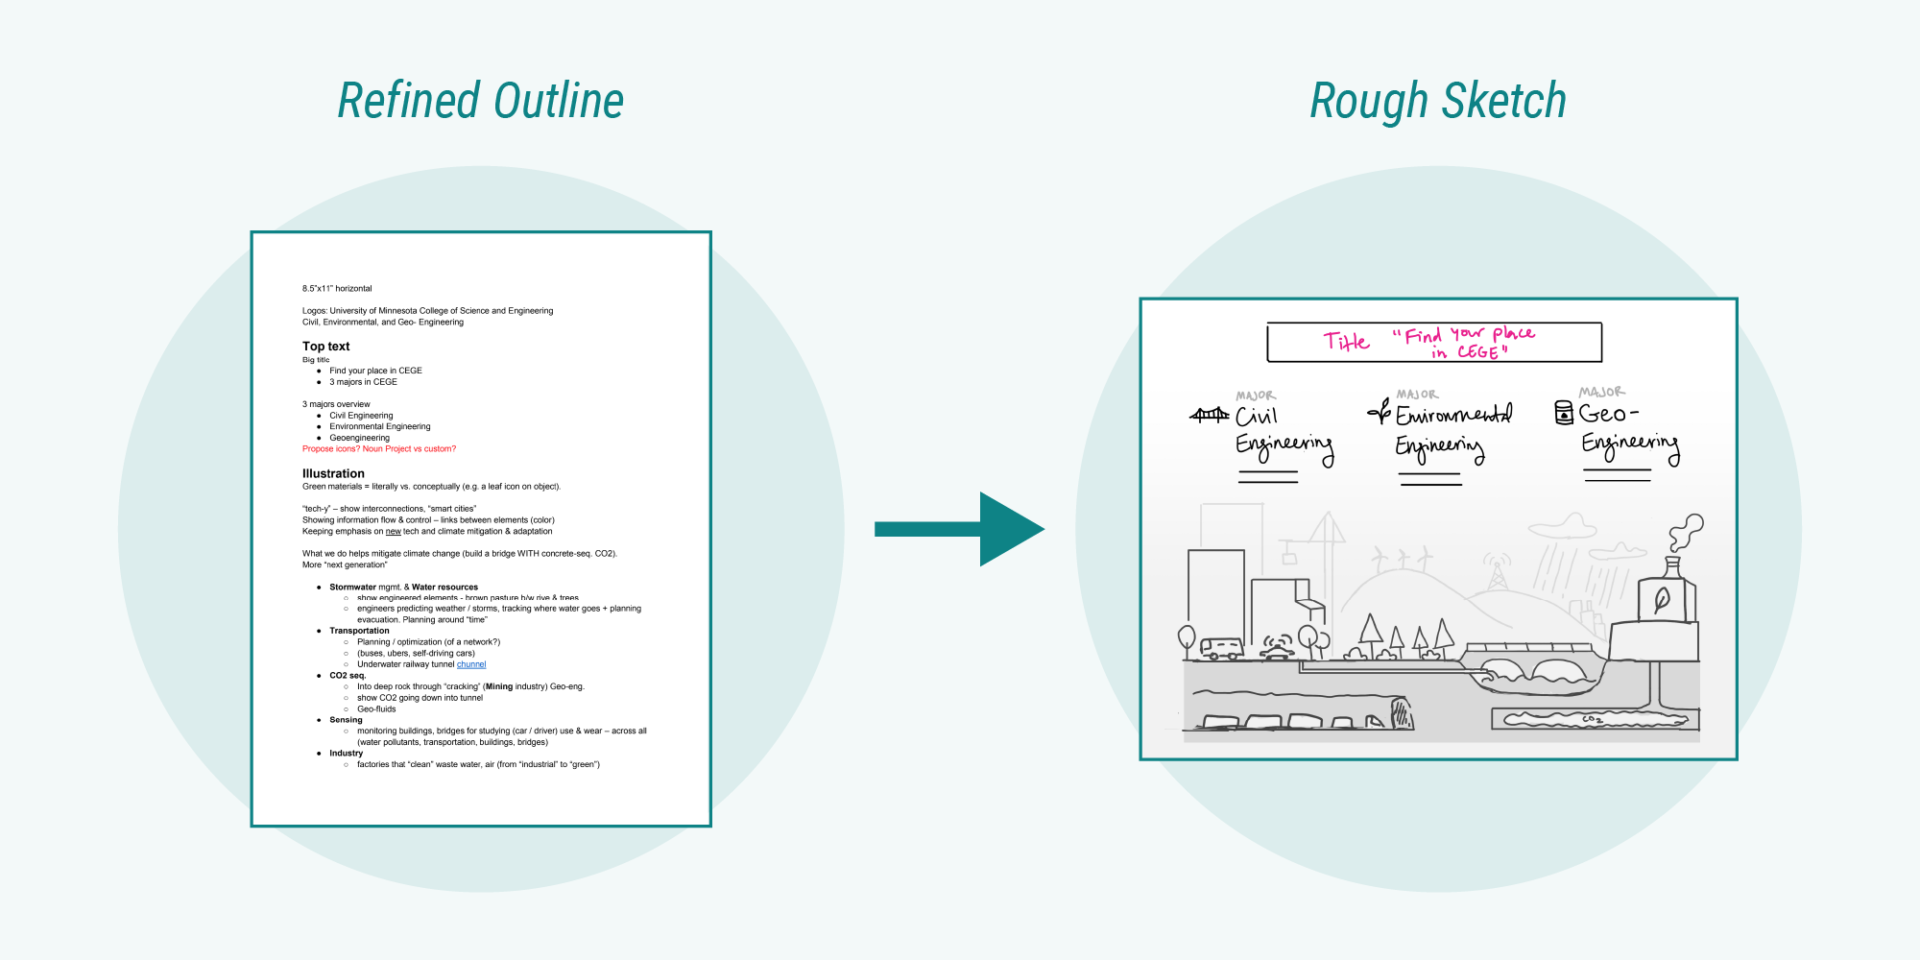
Sketches
At a meeting, we walk you through our rough sketches and invite you to share feedback. We may show different options and discuss which approach best fits aspects that you want to showcase.
If developing the “look and feel” (visual style) is part of the project scope, we'll propose color schemes, fonts, and/or illustration styles.
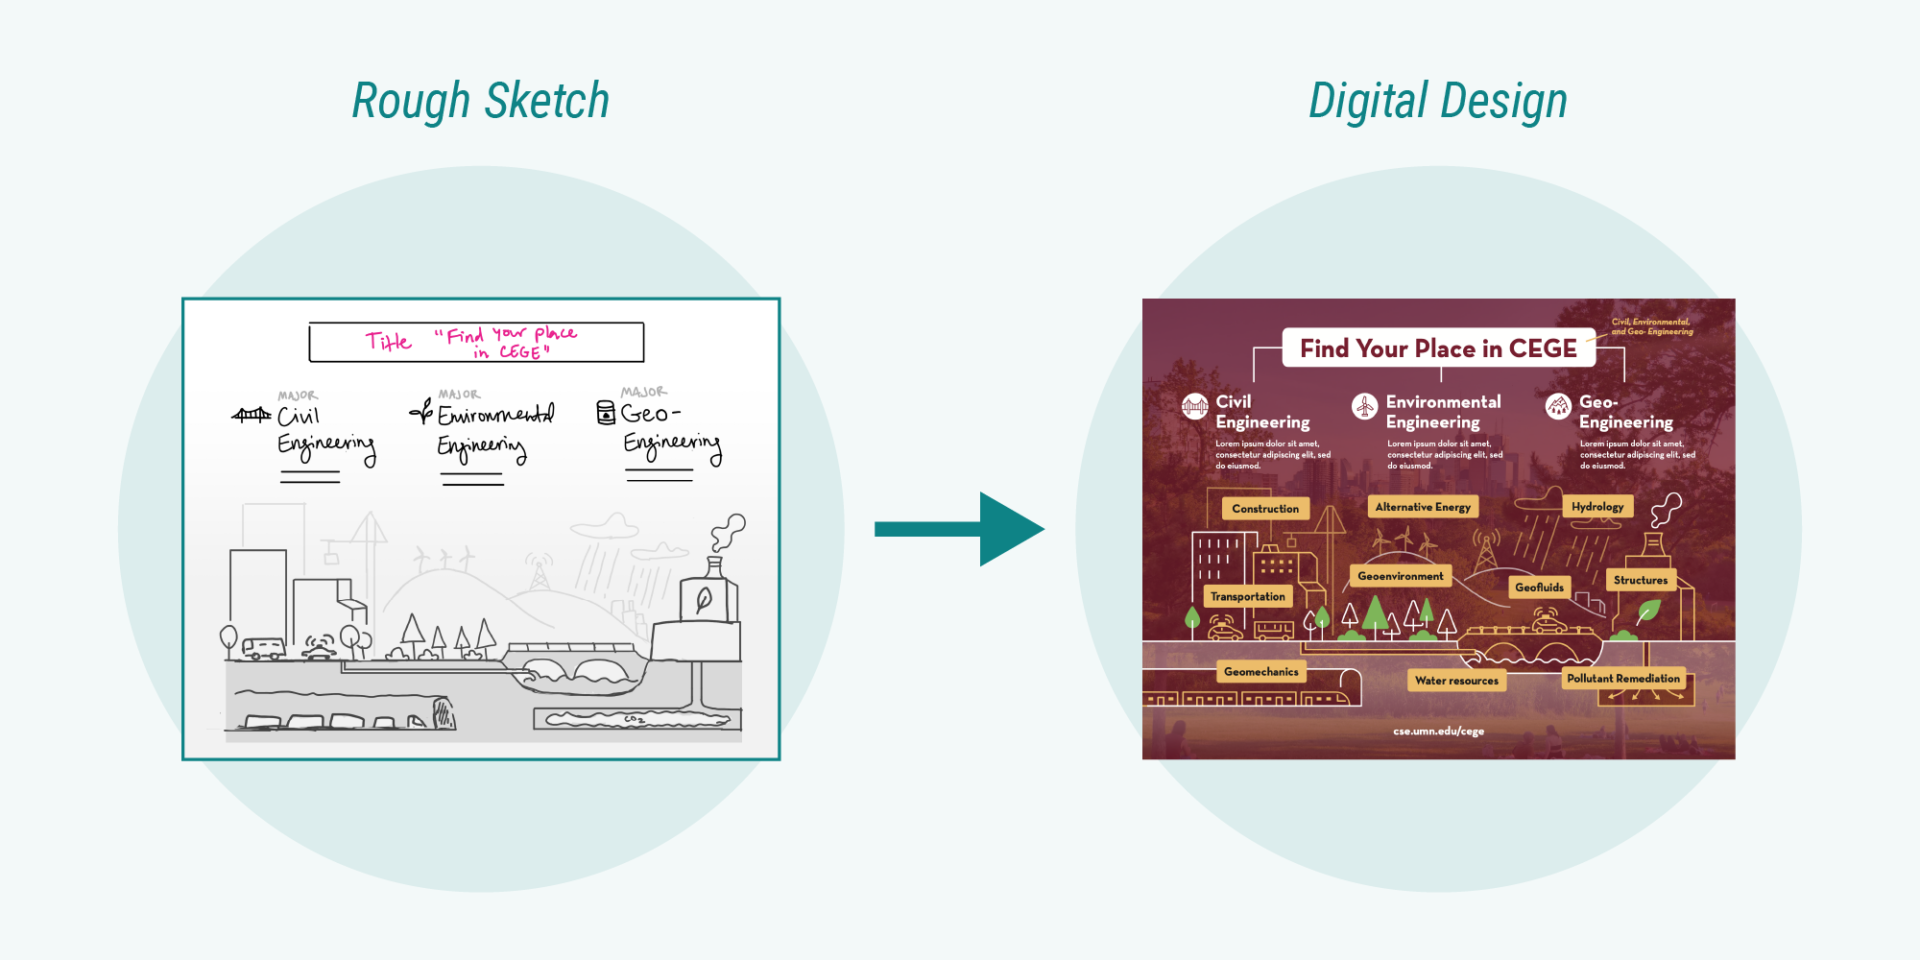
Digital Design
We share a first draft with you via email and ask for your feedback.
Iteration
The fun has begun! We send you each design iteration via email, and your team compiles feedback in response. You can contact us with questions or request a check-in meeting at any time.
Most projects include two rounds of revision and one additional round of minor tweaks. If you prefer more iterations, this can be added during the initial Scope phase.
Recommendation: If approval is needed from external team members (such as other people in the department), wait until the second design iteration to share with others. This allows us to address your early feedback in a streamlined process.
Wrap-Up
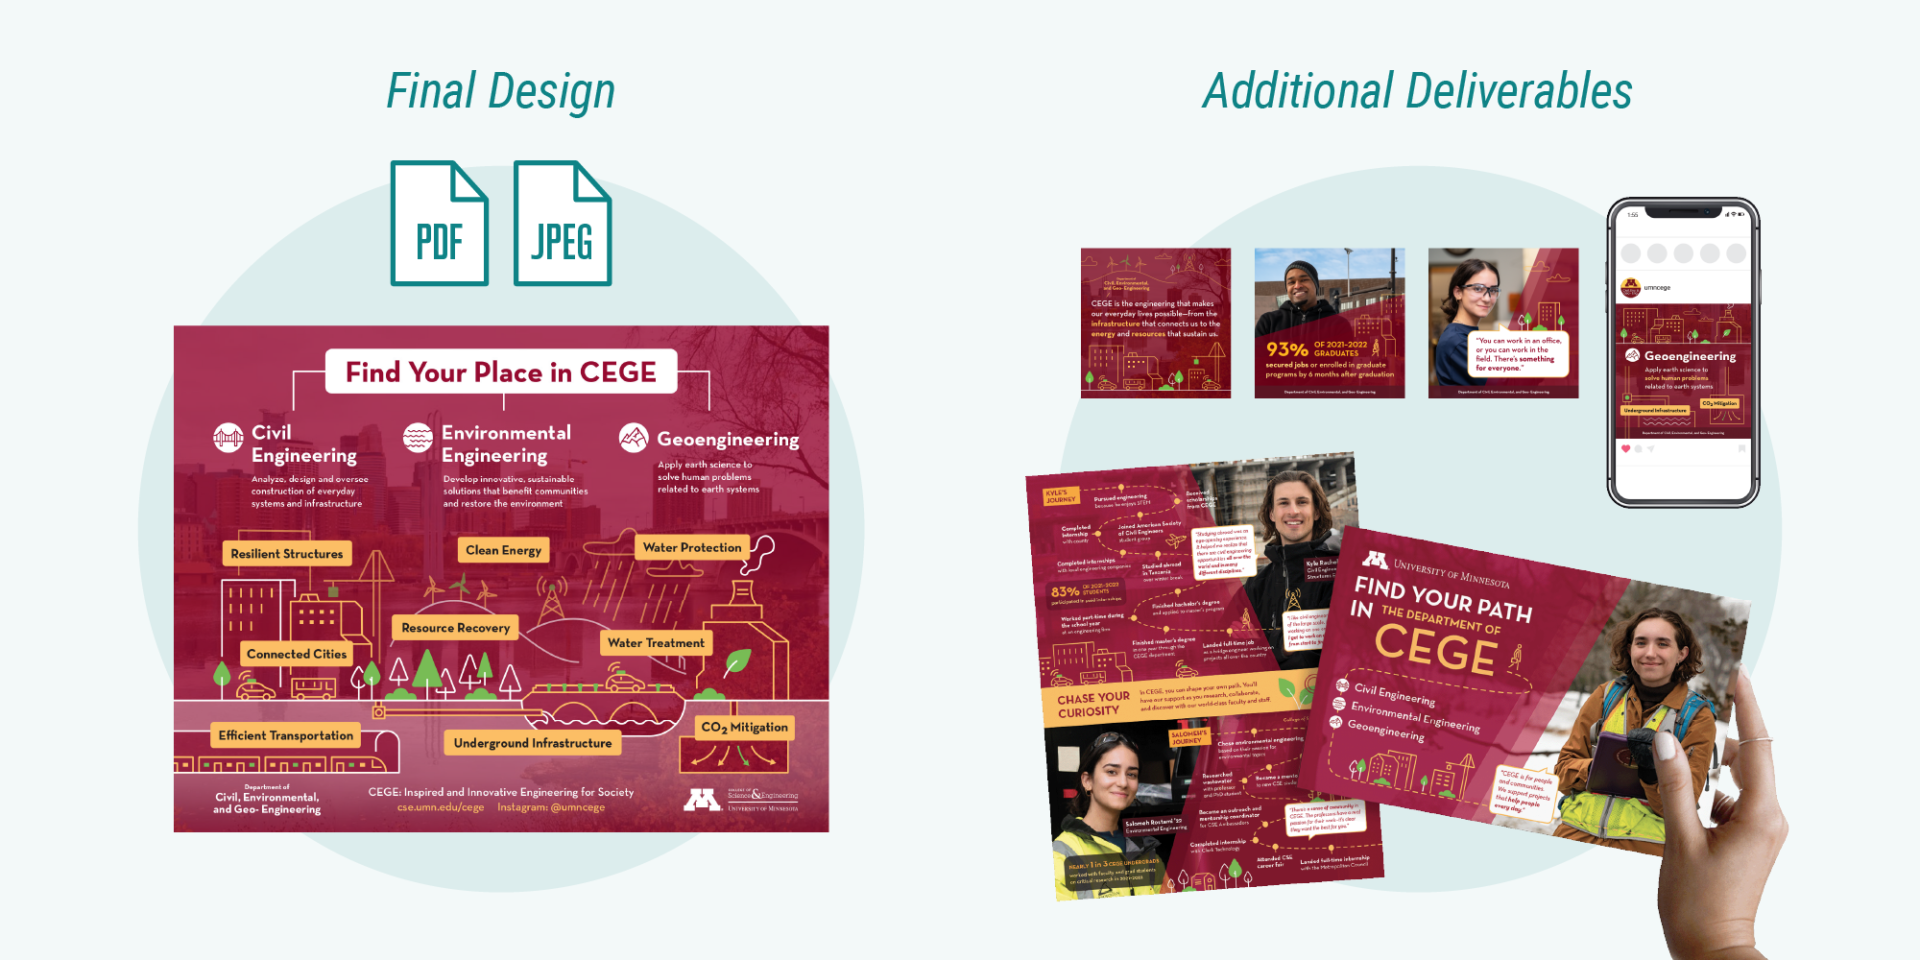
We send you final files, and our account manager follows up with wrap-up steps. We’d welcome your feedback on our process and will confirm whether we can share your project in our public portfolio.
If the project scope includes extra deliverables (social media graphics, slide decks, etc.), we will start developing those with a similar collaborative process.