NASA climate legacies interactive tool to create climate generations

Create your Own Climate Generation Visual

Generations of the Birt family in climate stripes created using the NASA Climate Legacies tool

Map your family's climate legacy

We're excited that a UN Intergovernmental IPCC figure designed by our creative director has been adapted into a customizable digital tool by the amazing team at NASA.

With the NASA tool, you can visualize your lifespan in climate temperatures - along with your family and friends: quickly comparing how different generations live through completely different worlds (in terms of temperature averages).

NASA climate legacies interactive tool to create climate generations

Before this tool, and before the infamous IPCC figure that this tool is based upon, here's the history of the people-focused aspect of this figure: How the combination of human generations and climate data emerged during a personal creative project in 2019, and evolved into today's symbol of climate impact across generations.

2019 (Summer)

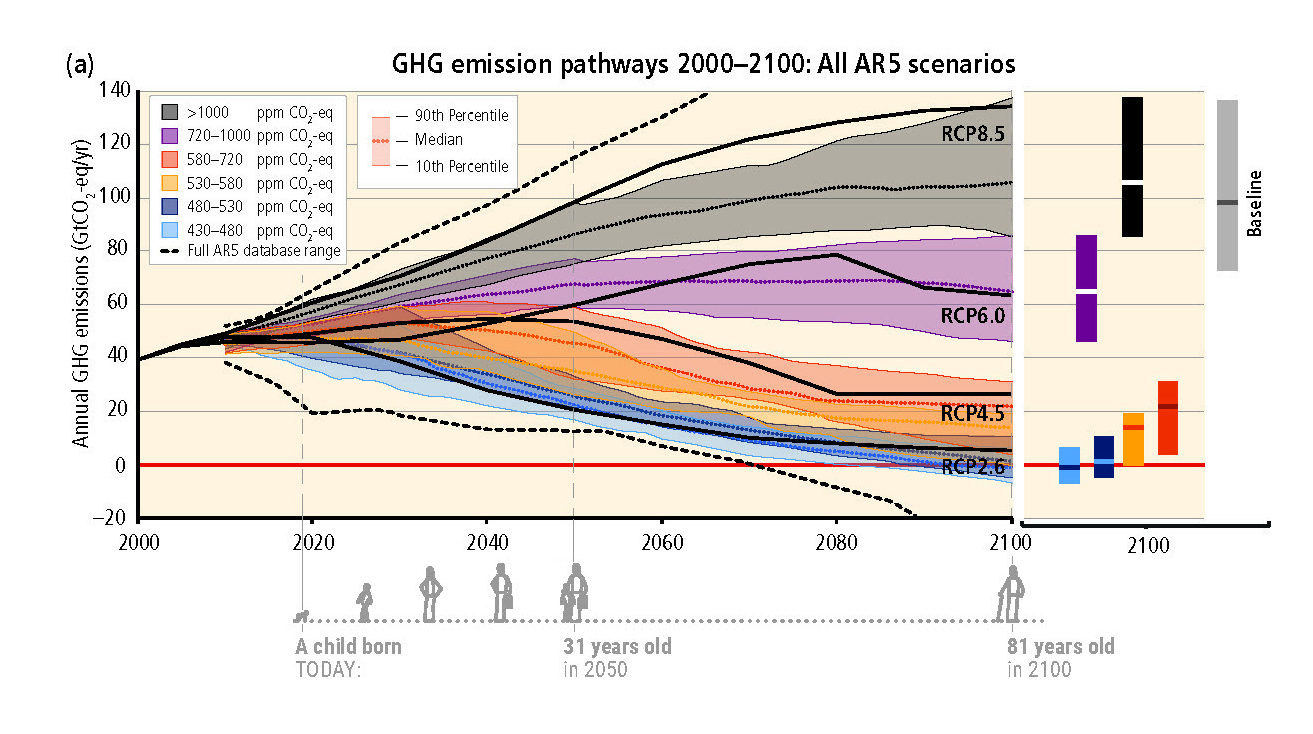
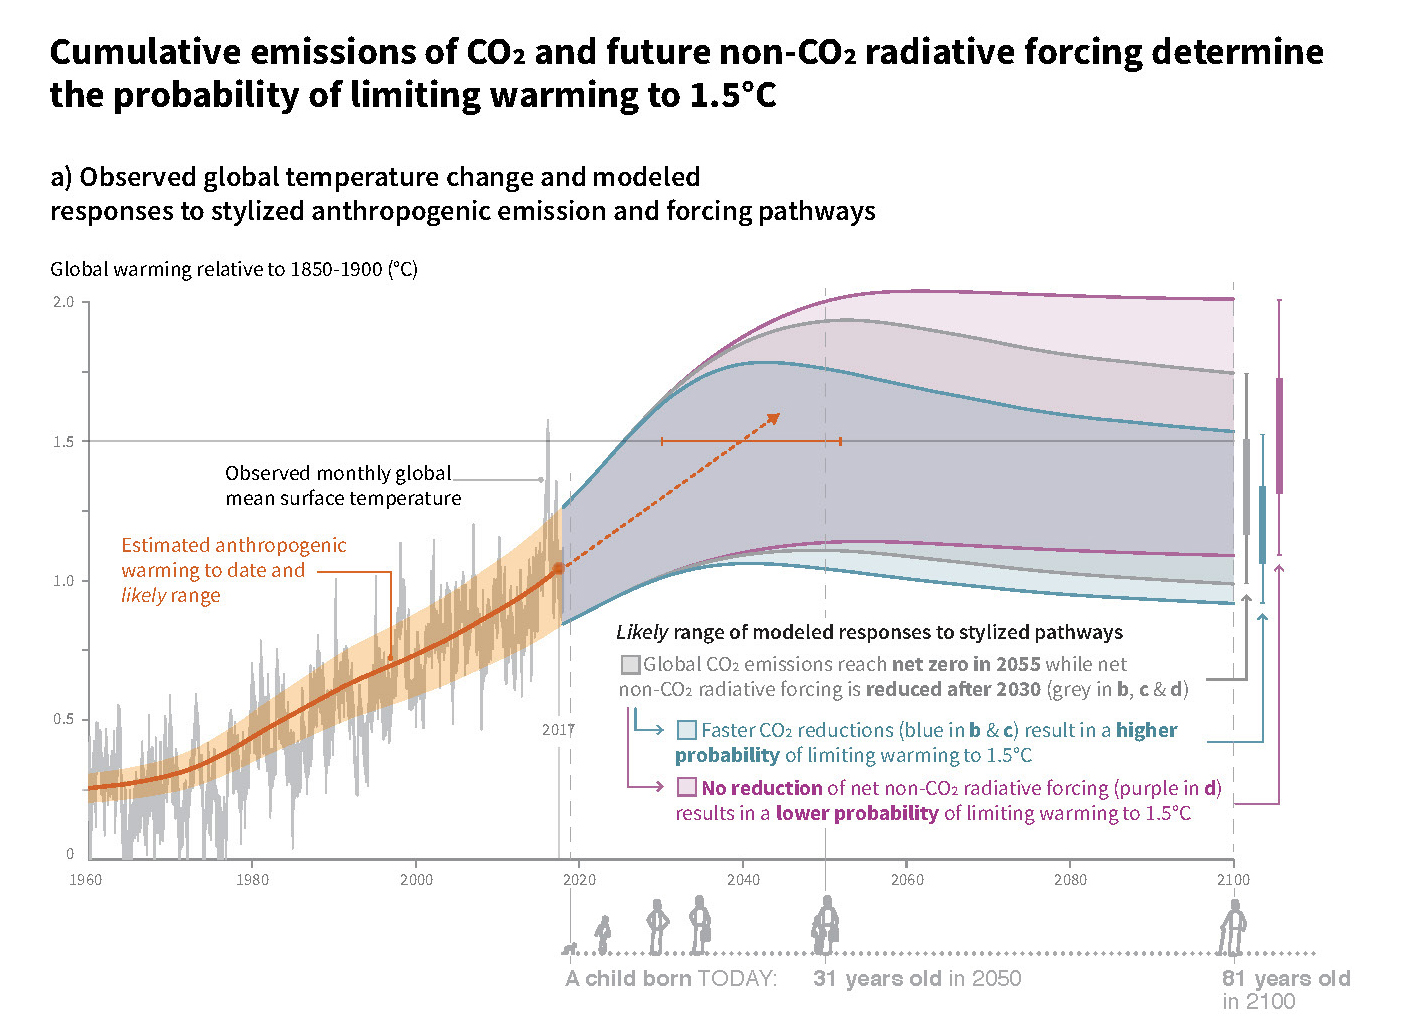
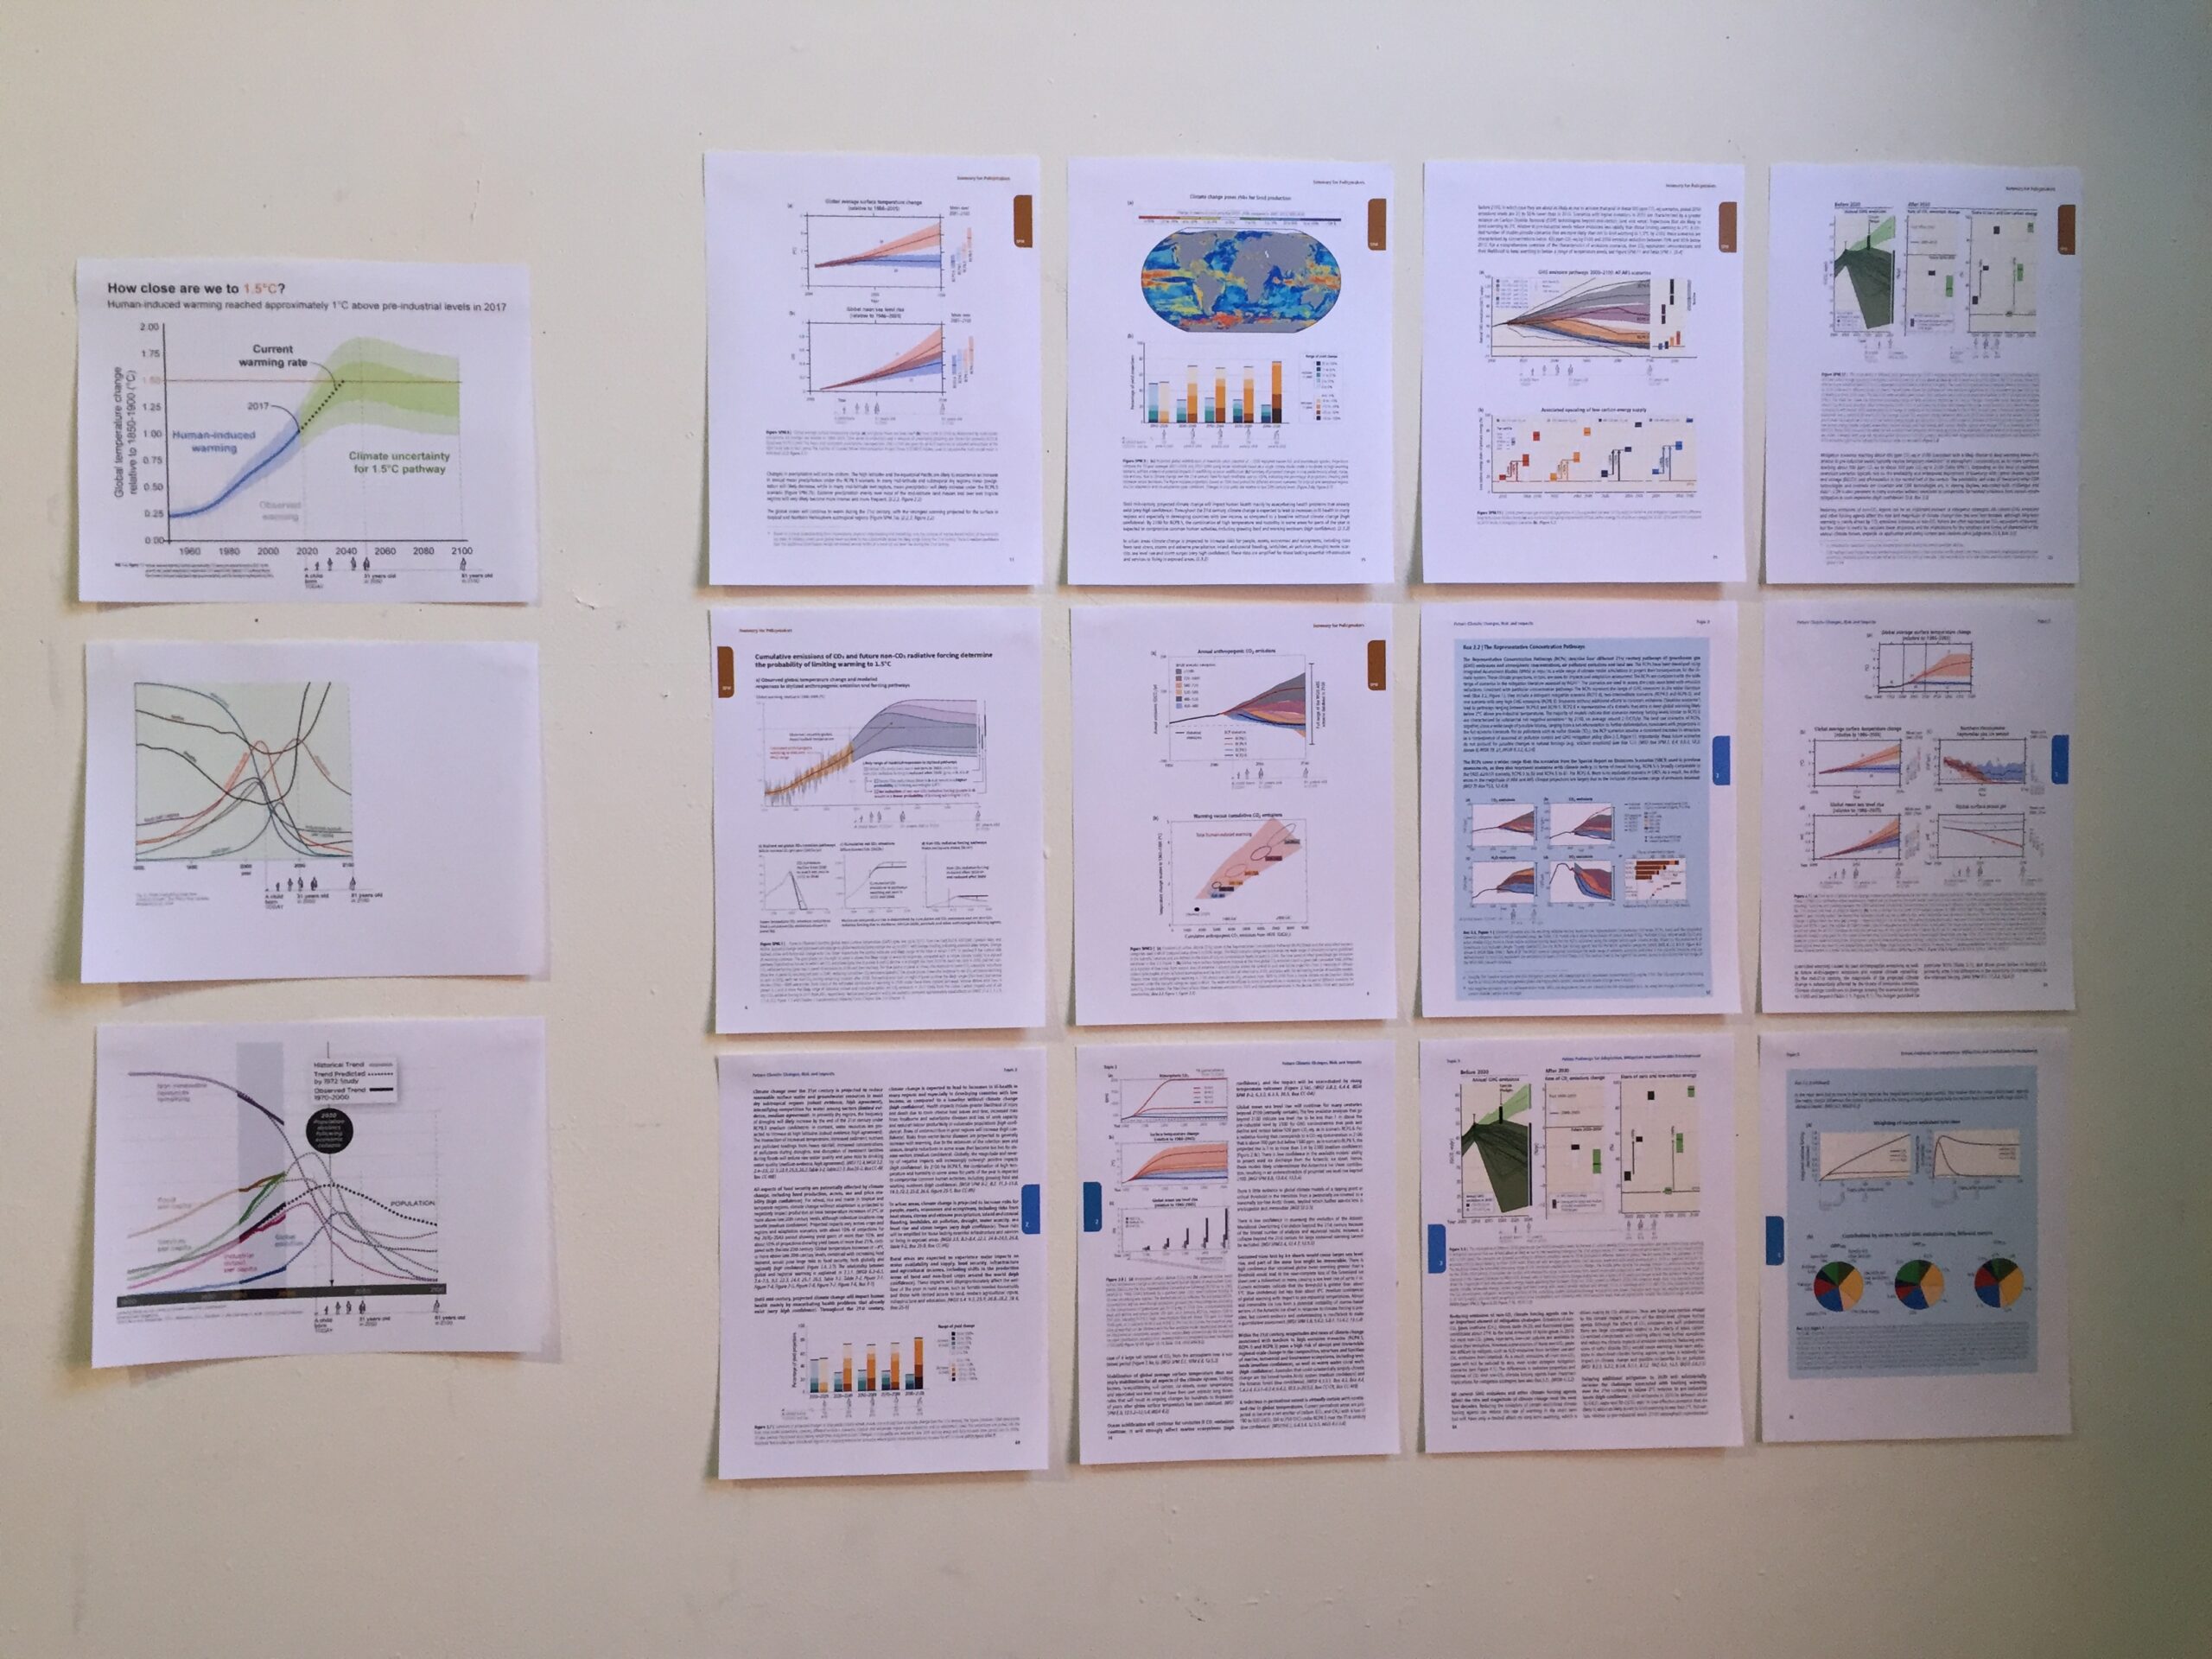
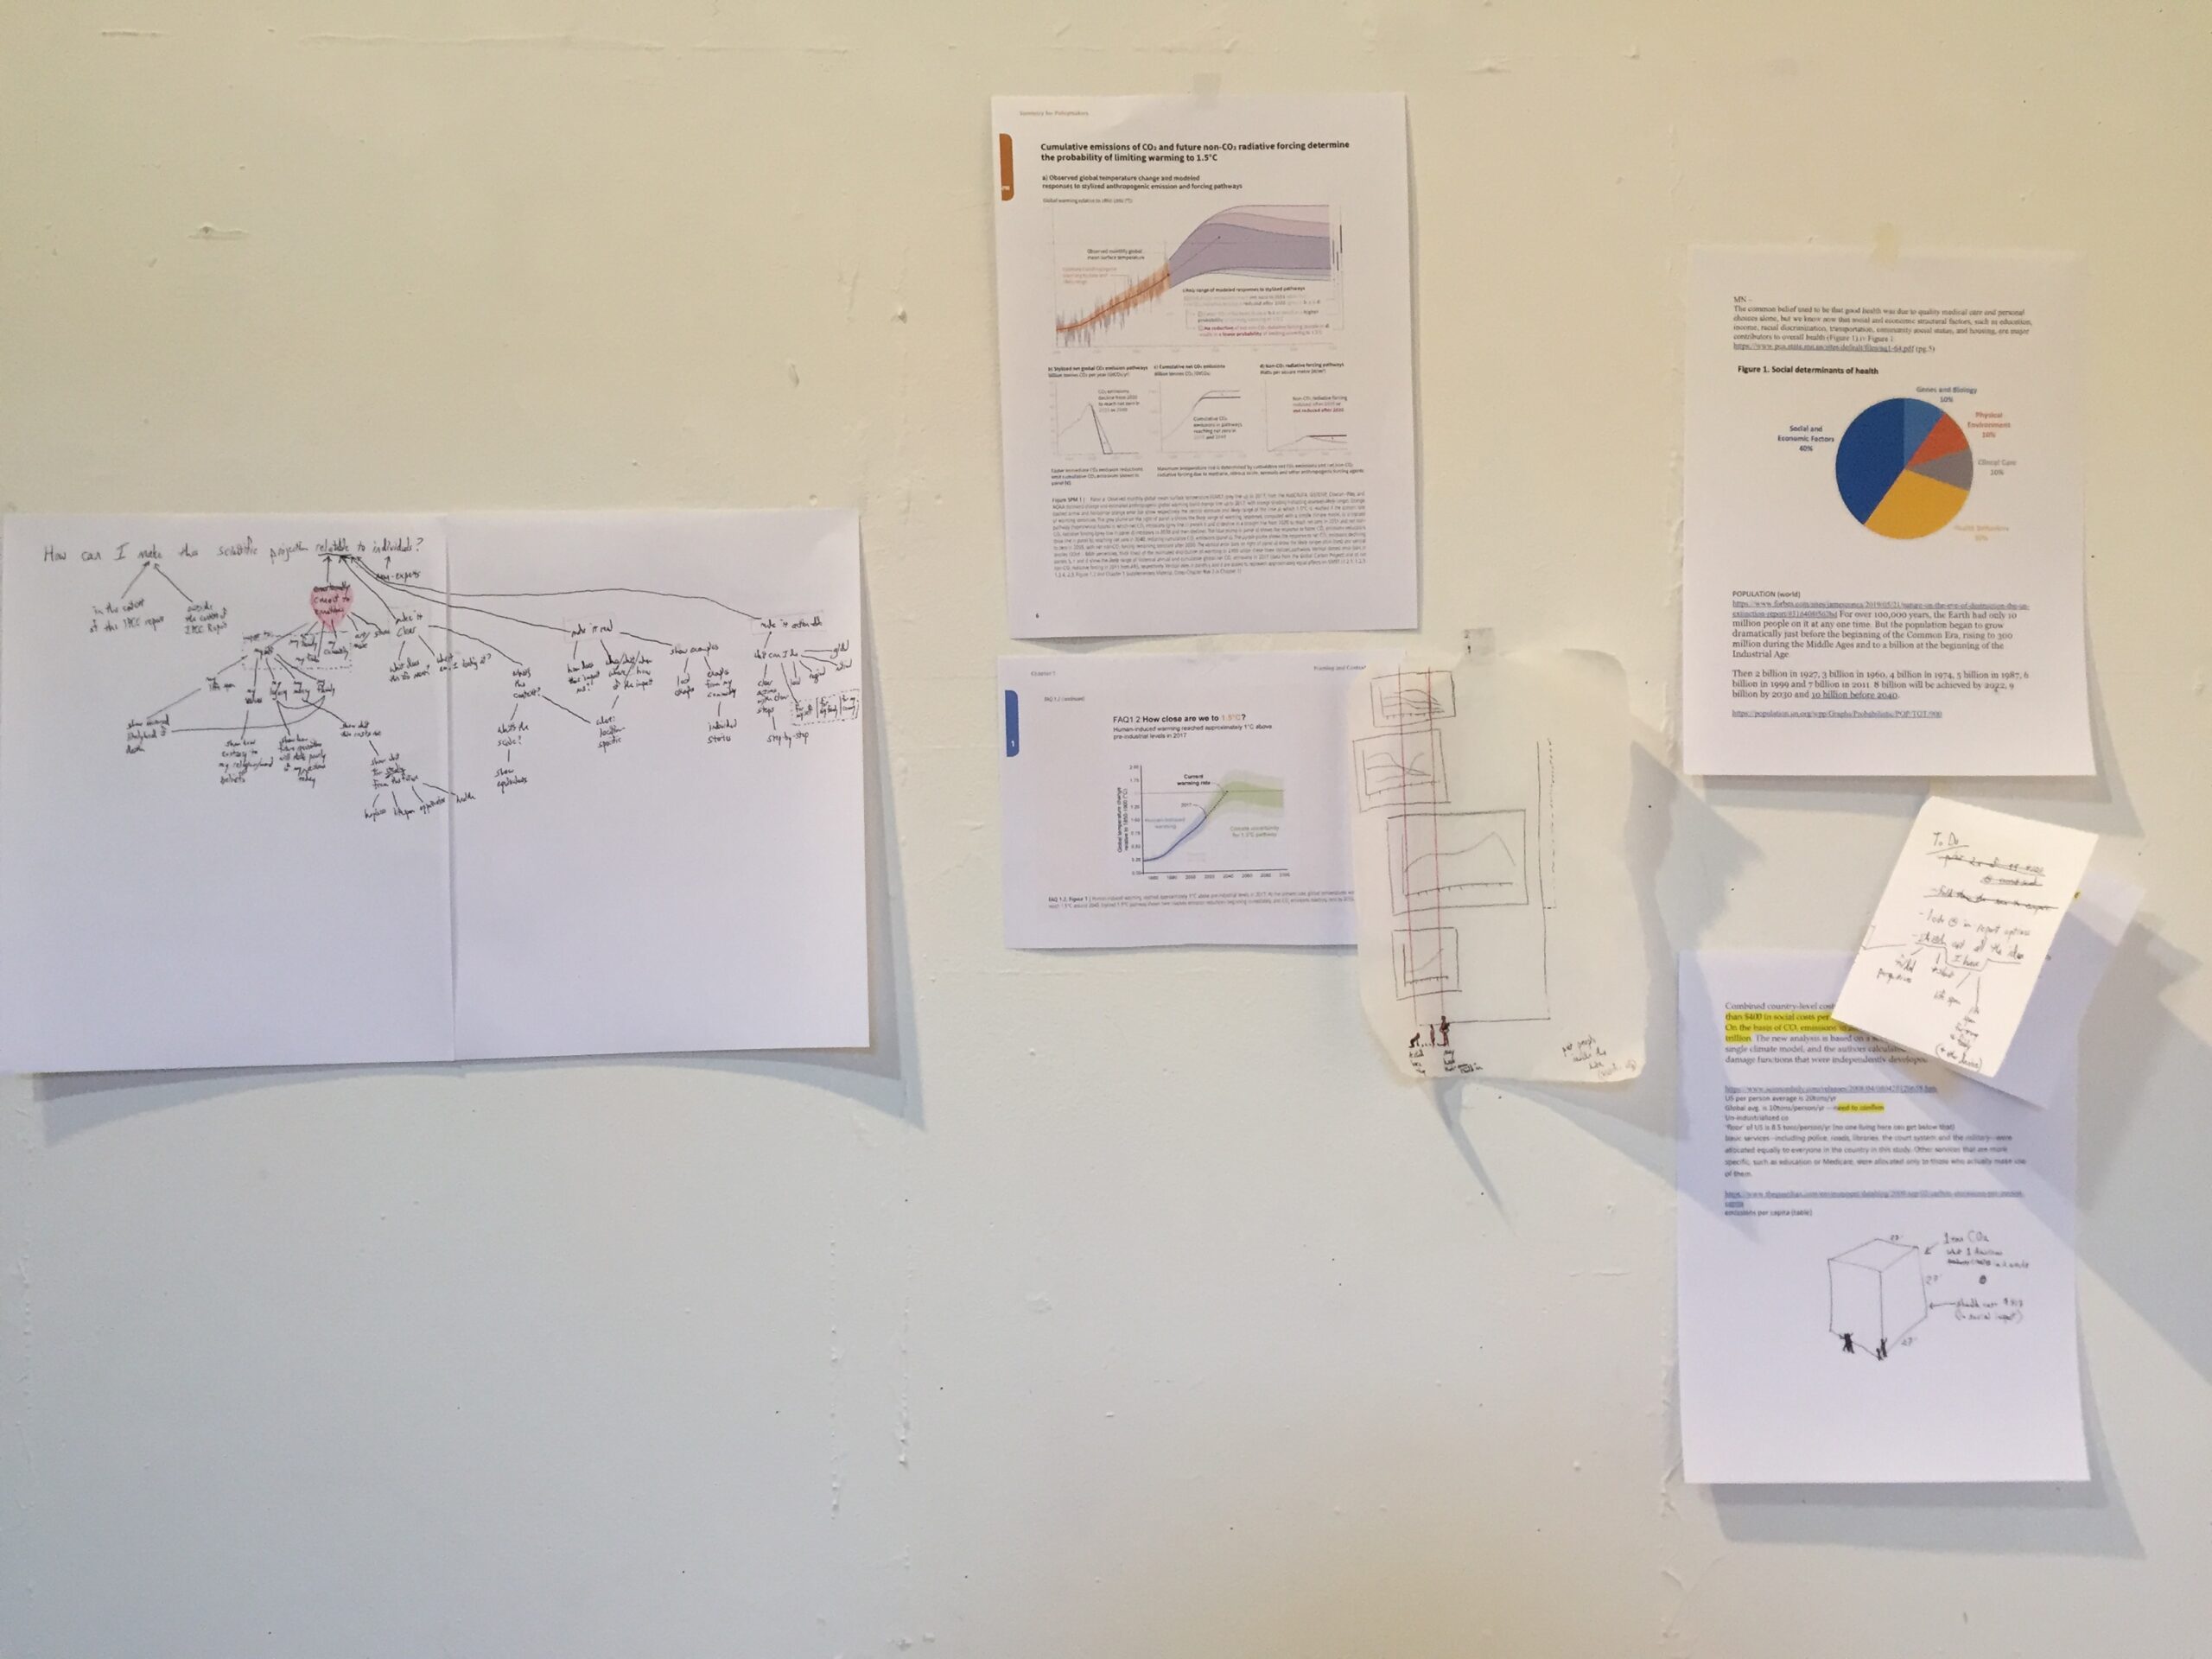
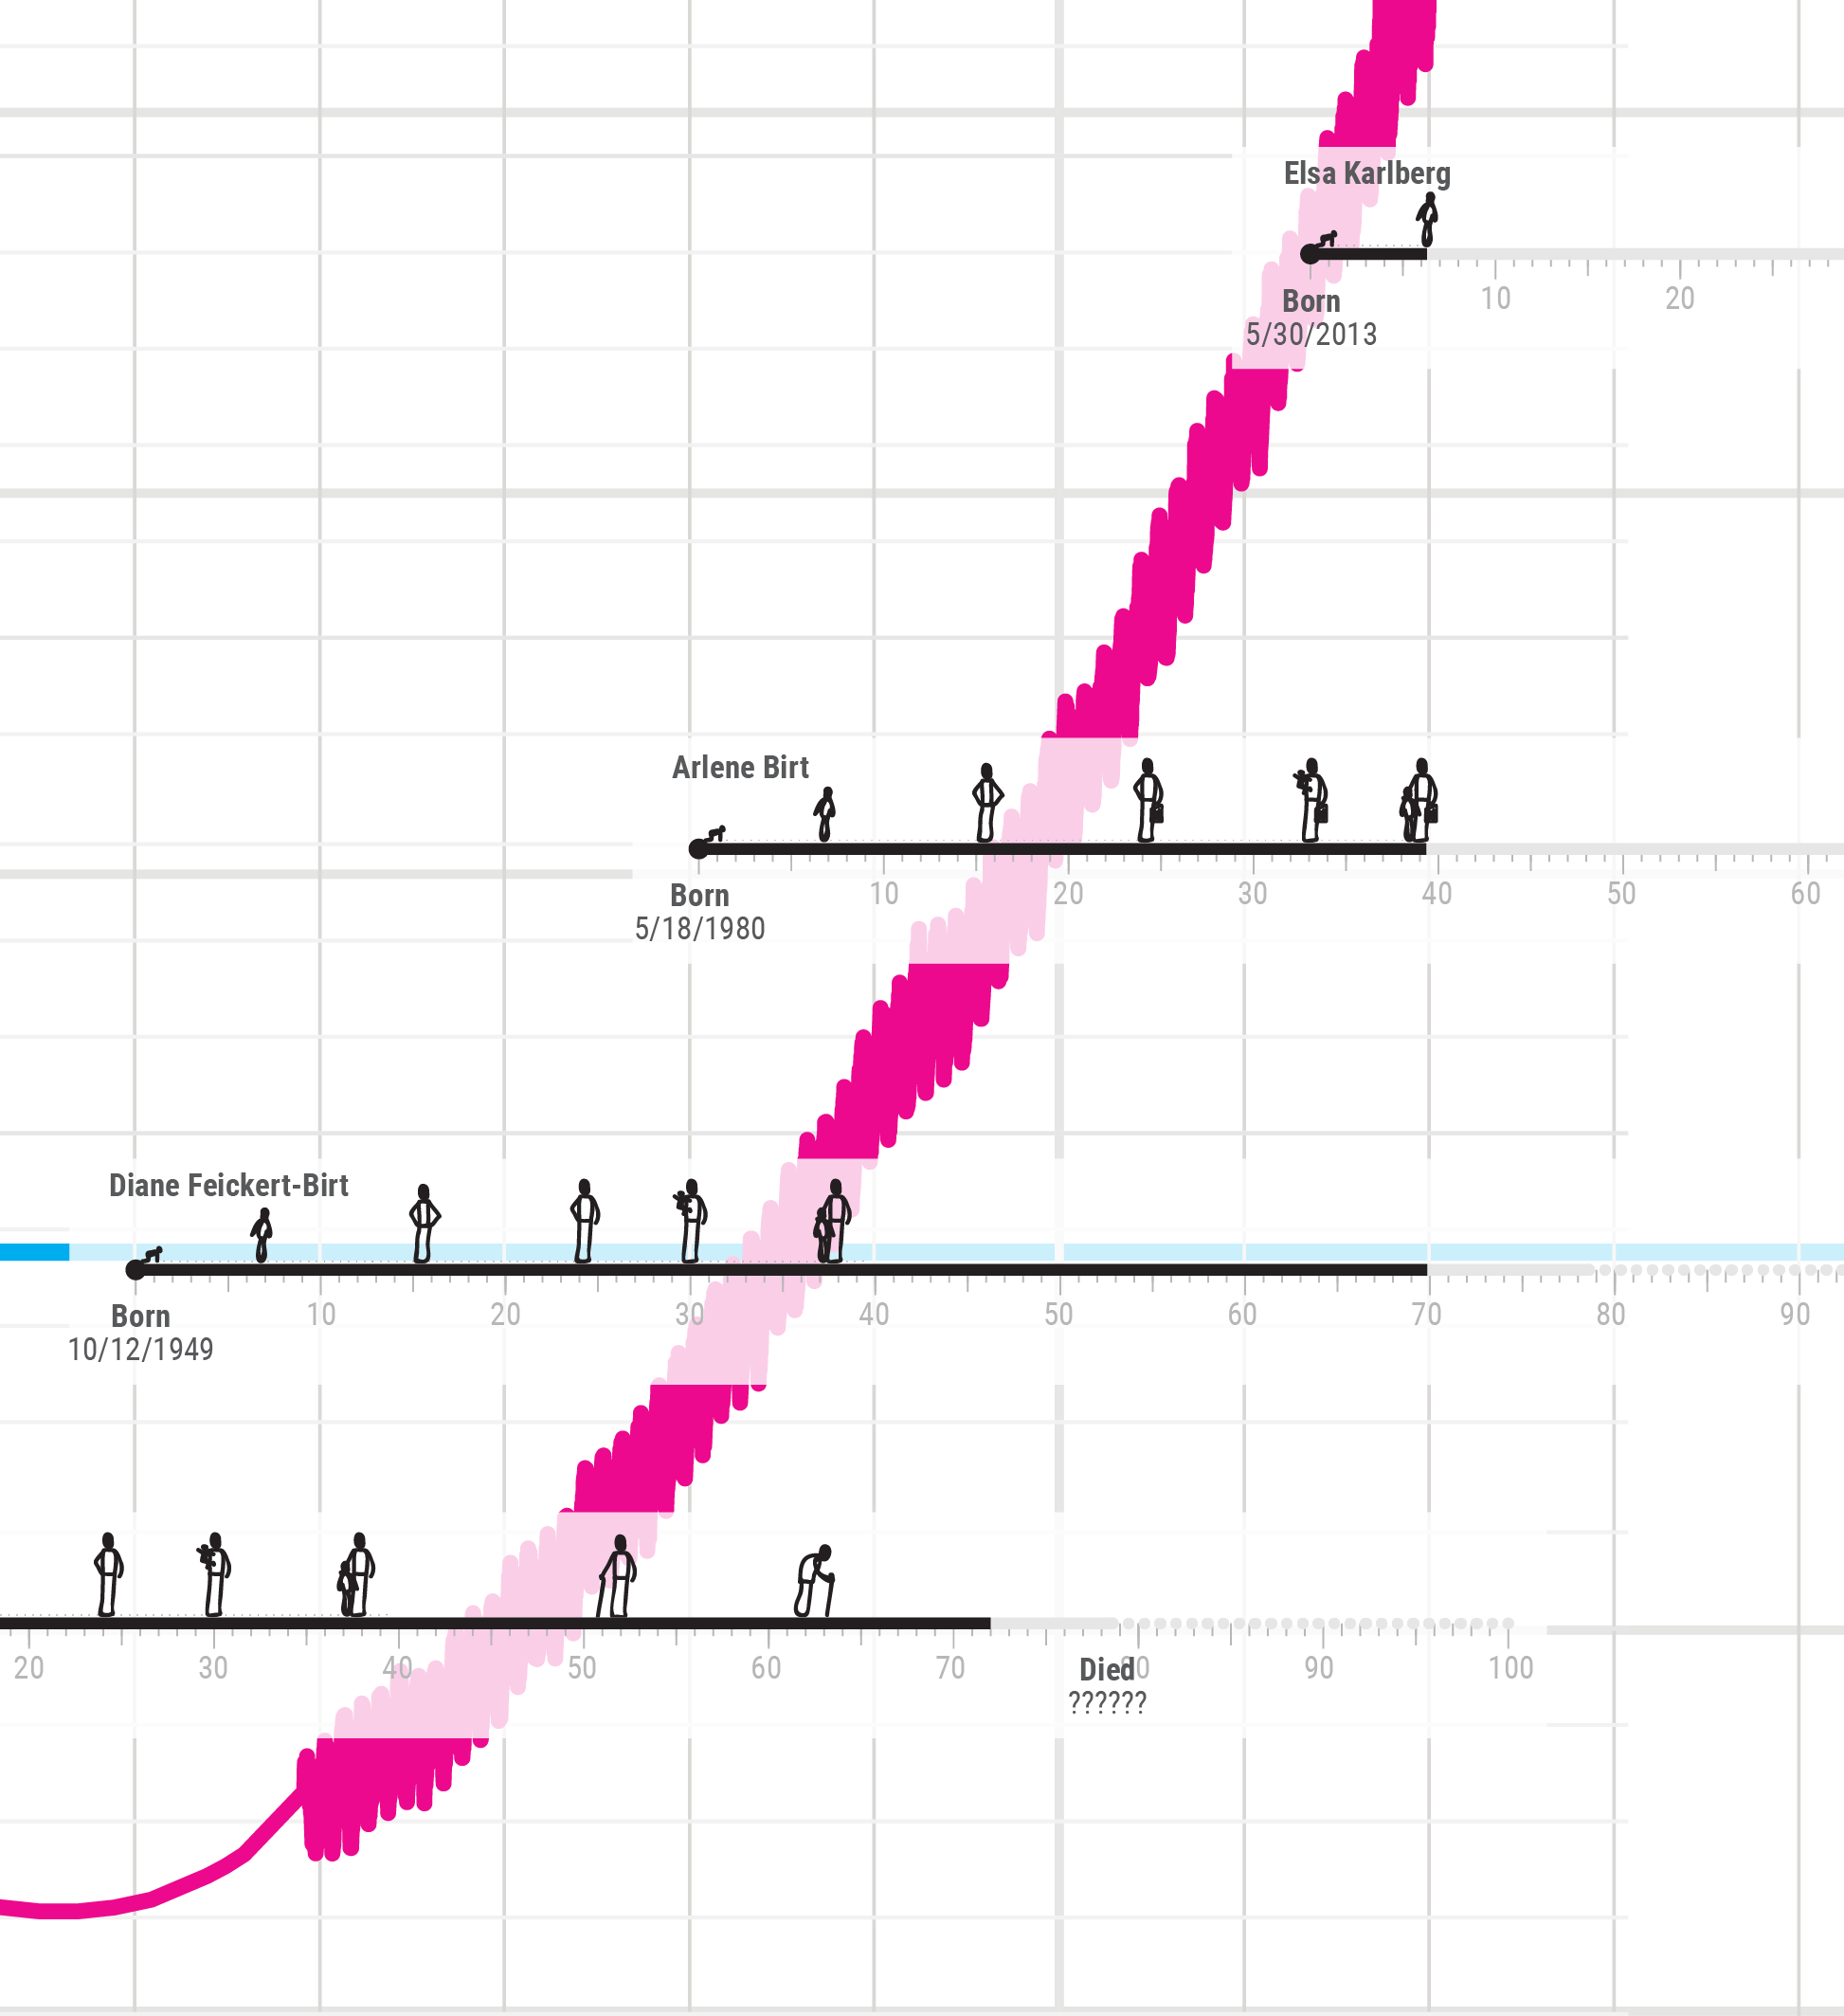
In the summer of 2019, Background Stories creative director, Arlene Birt, experimented with visuals that aligned visuals of human lifespans with climate data during an artist residency at the Massachusetts Museum of Contemporary Art (MASS MOCA). During this residency, she placed human lifespans atop the data visualizations within the UN IPCC's Special Report on 1.5°C. These visuals showing generations of 'a child born in' specific years help non-experts relate seemingly abstract data to their own lives. 

"When I mapped the generations of women in my own family, I came to tears realizing how my daughter and I will experience a very different world — much different than my grandmother and great-grandmother," Birt said.  

Additional experiments during the residency included using digital projection to map generations of Birt's own family tree (and other participants) through data like temperature change, CO2 emissions levels, sea level rise, and population growth.

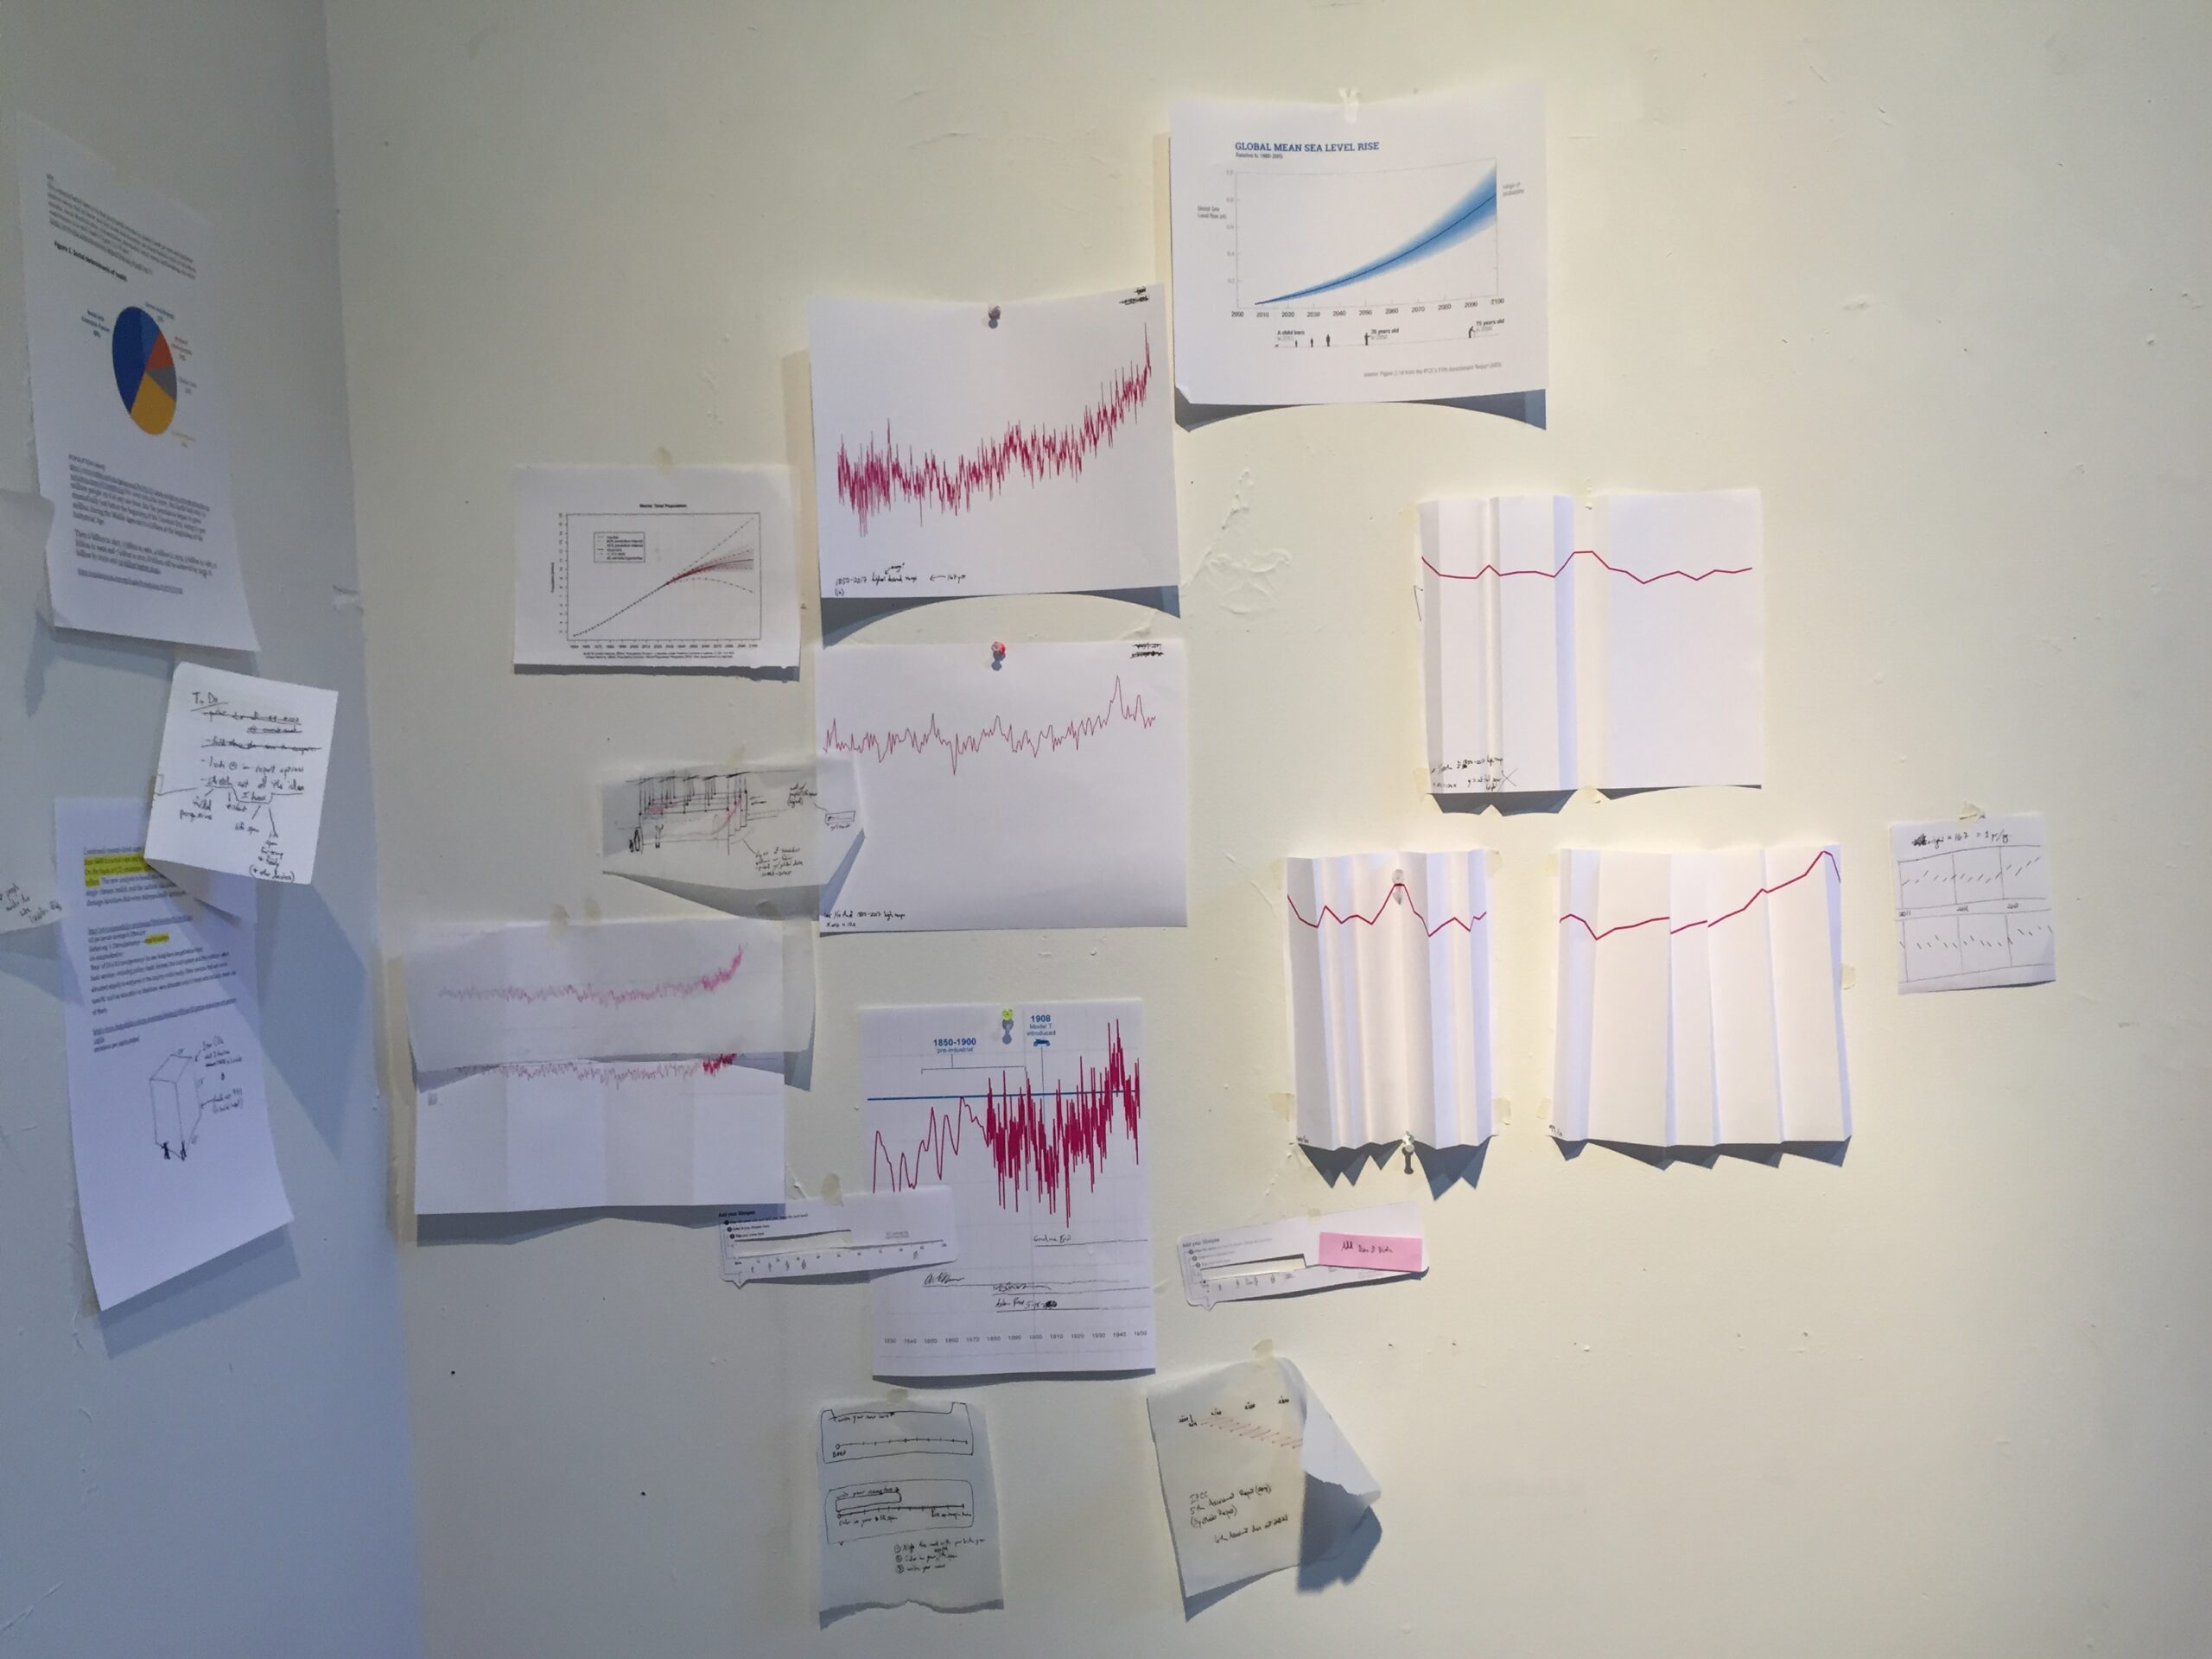
Birt's family tree overlaid on a graph of world average temperature (check wording for accuracy).

2019 (Fall)

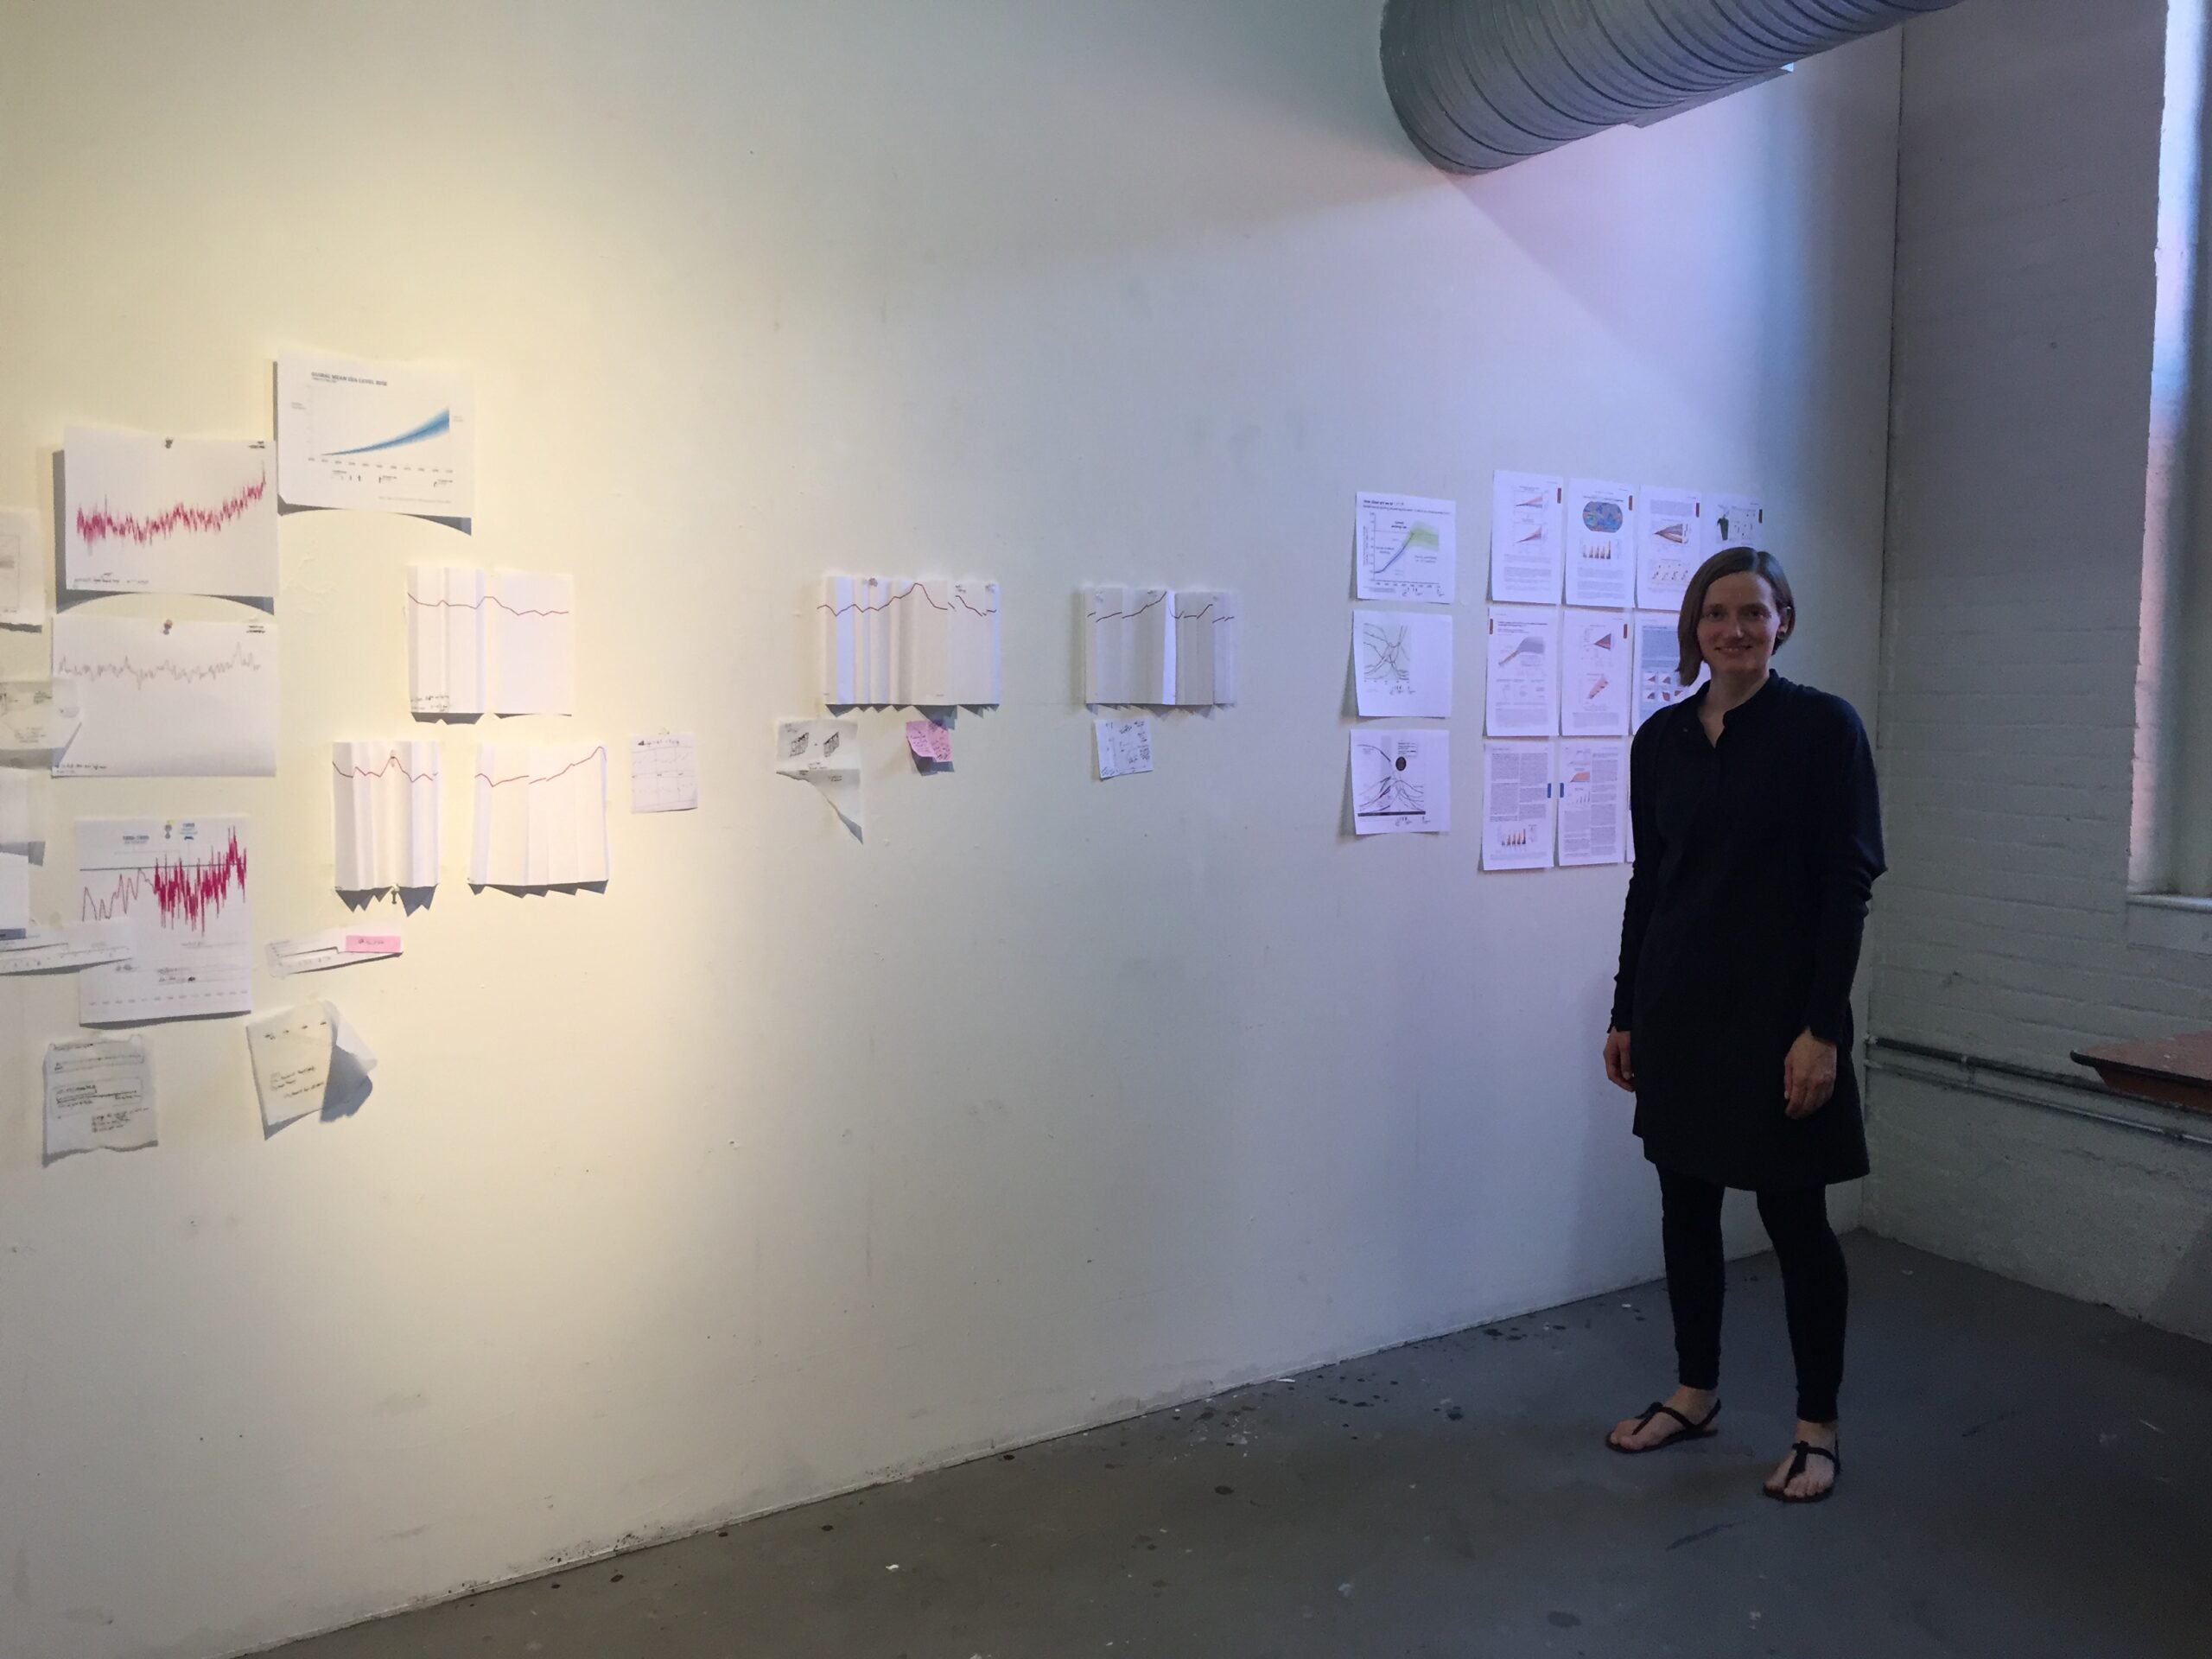
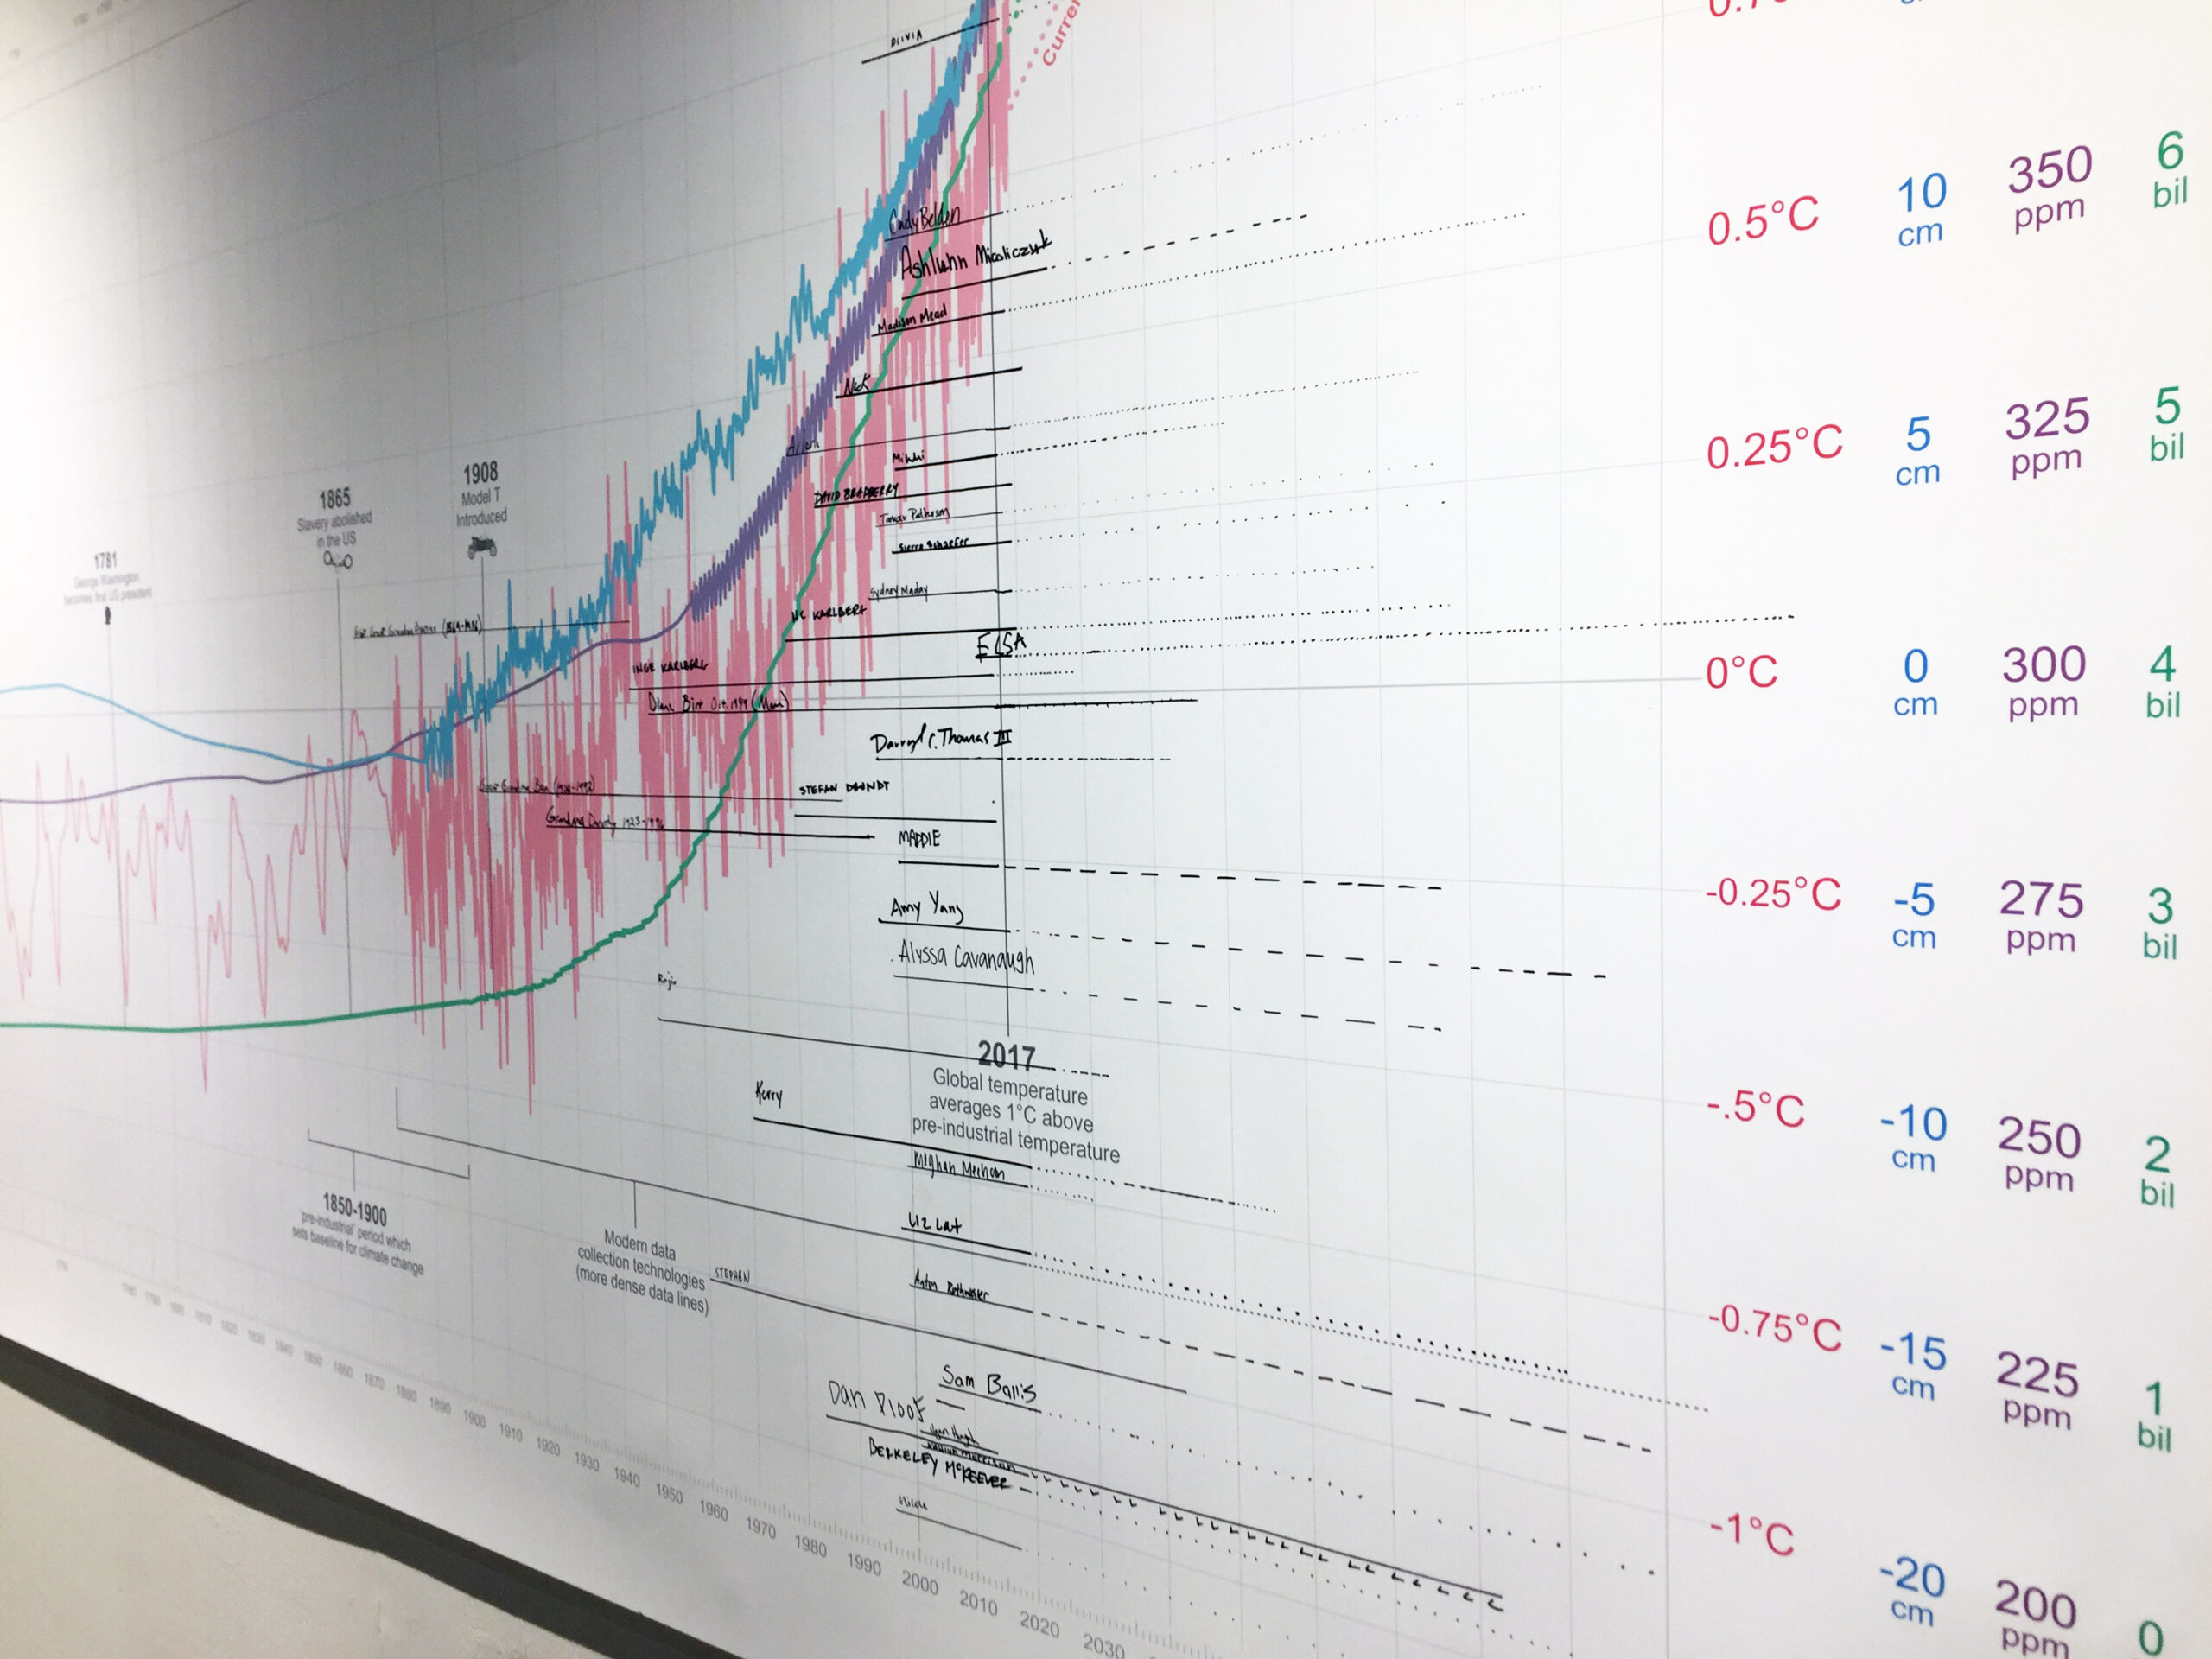
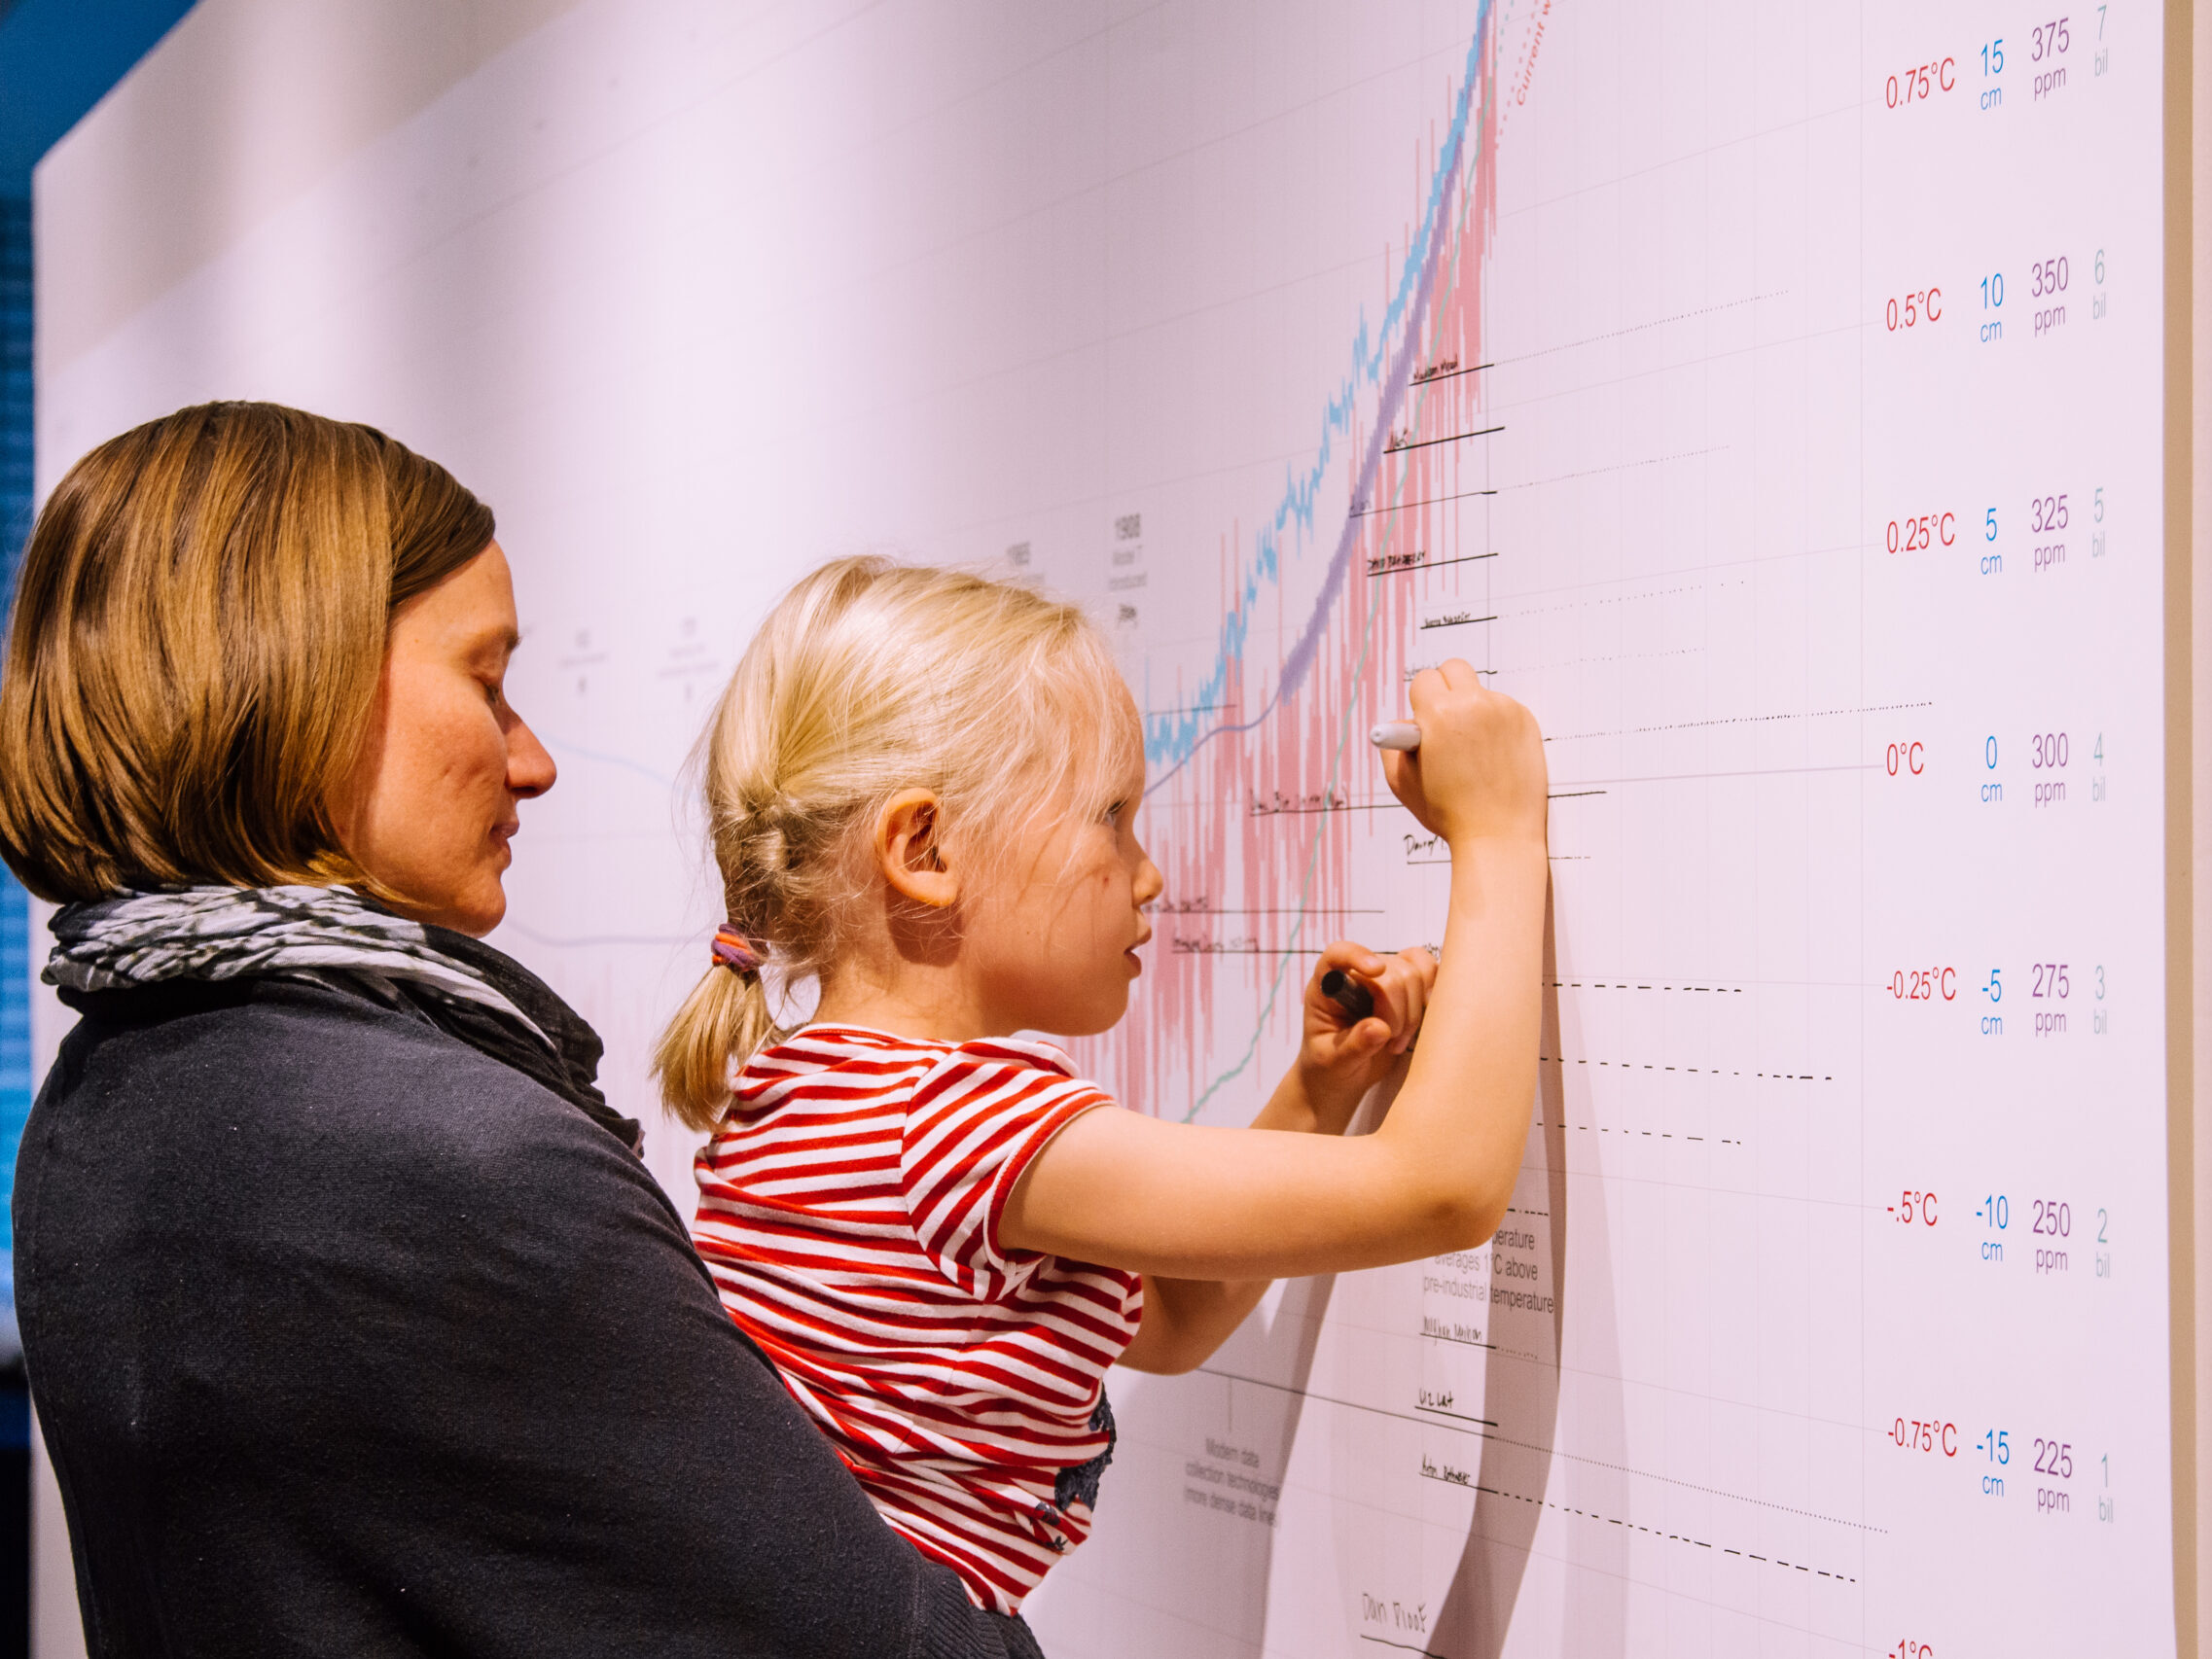
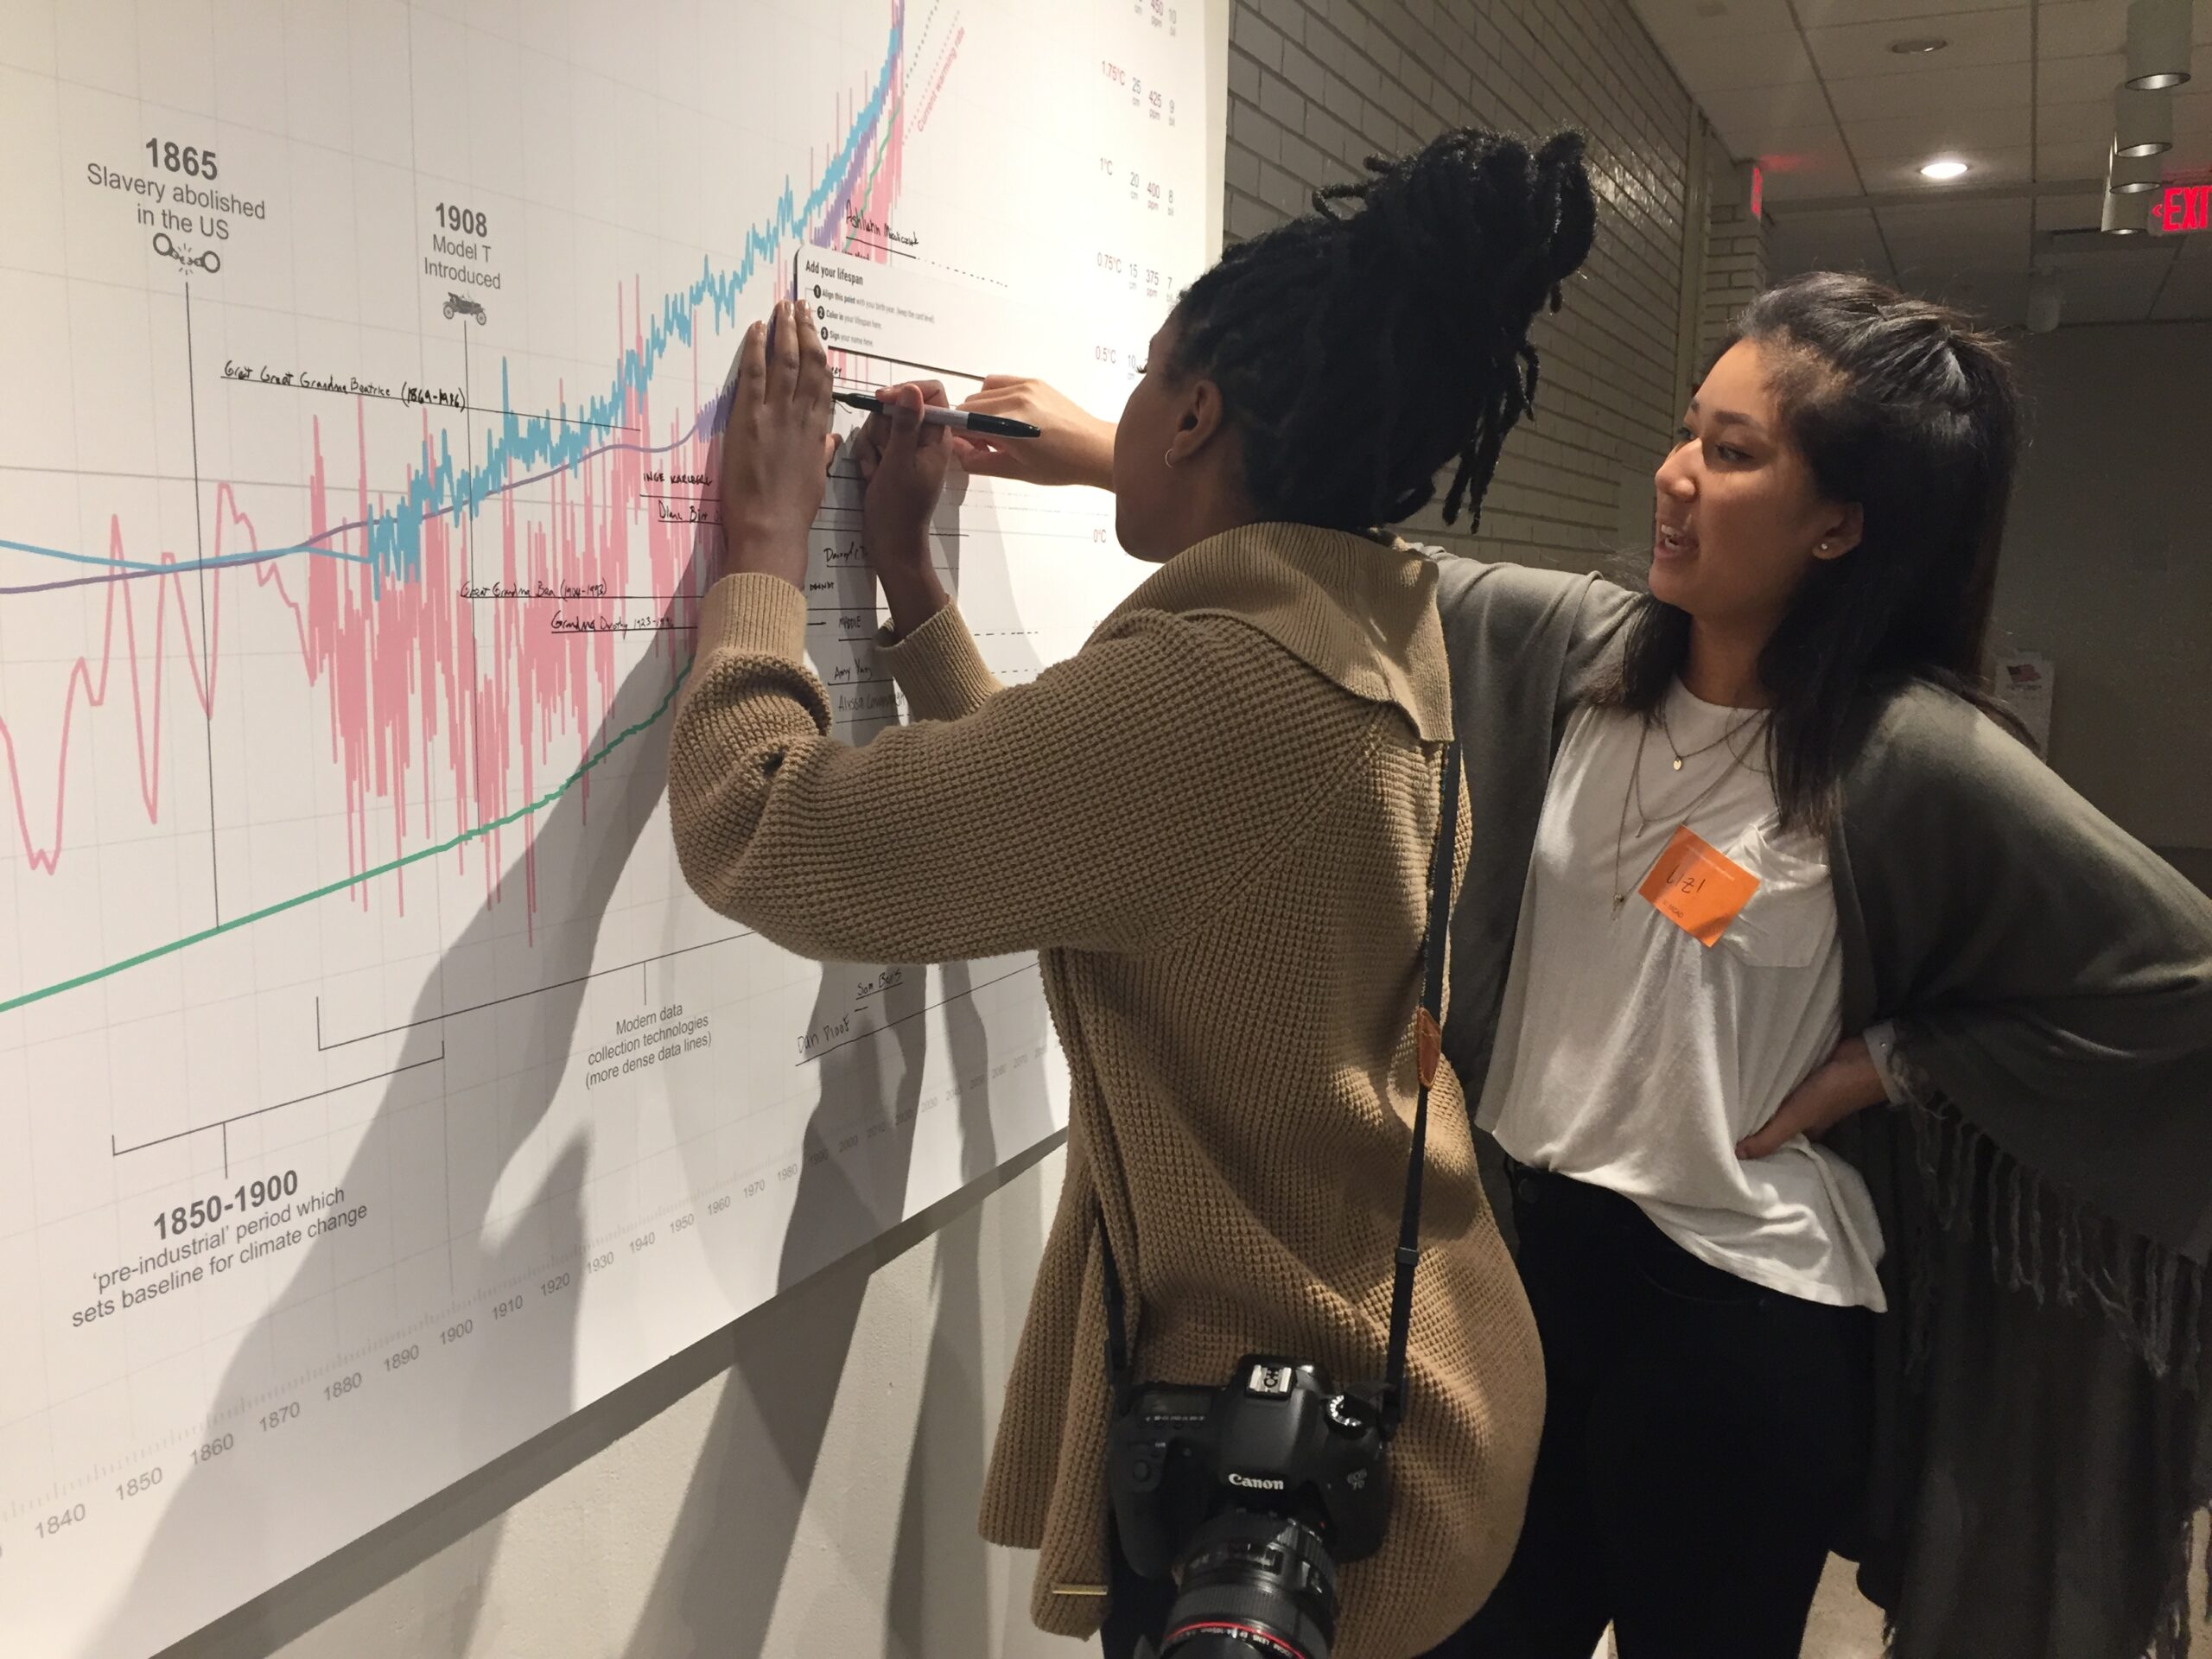
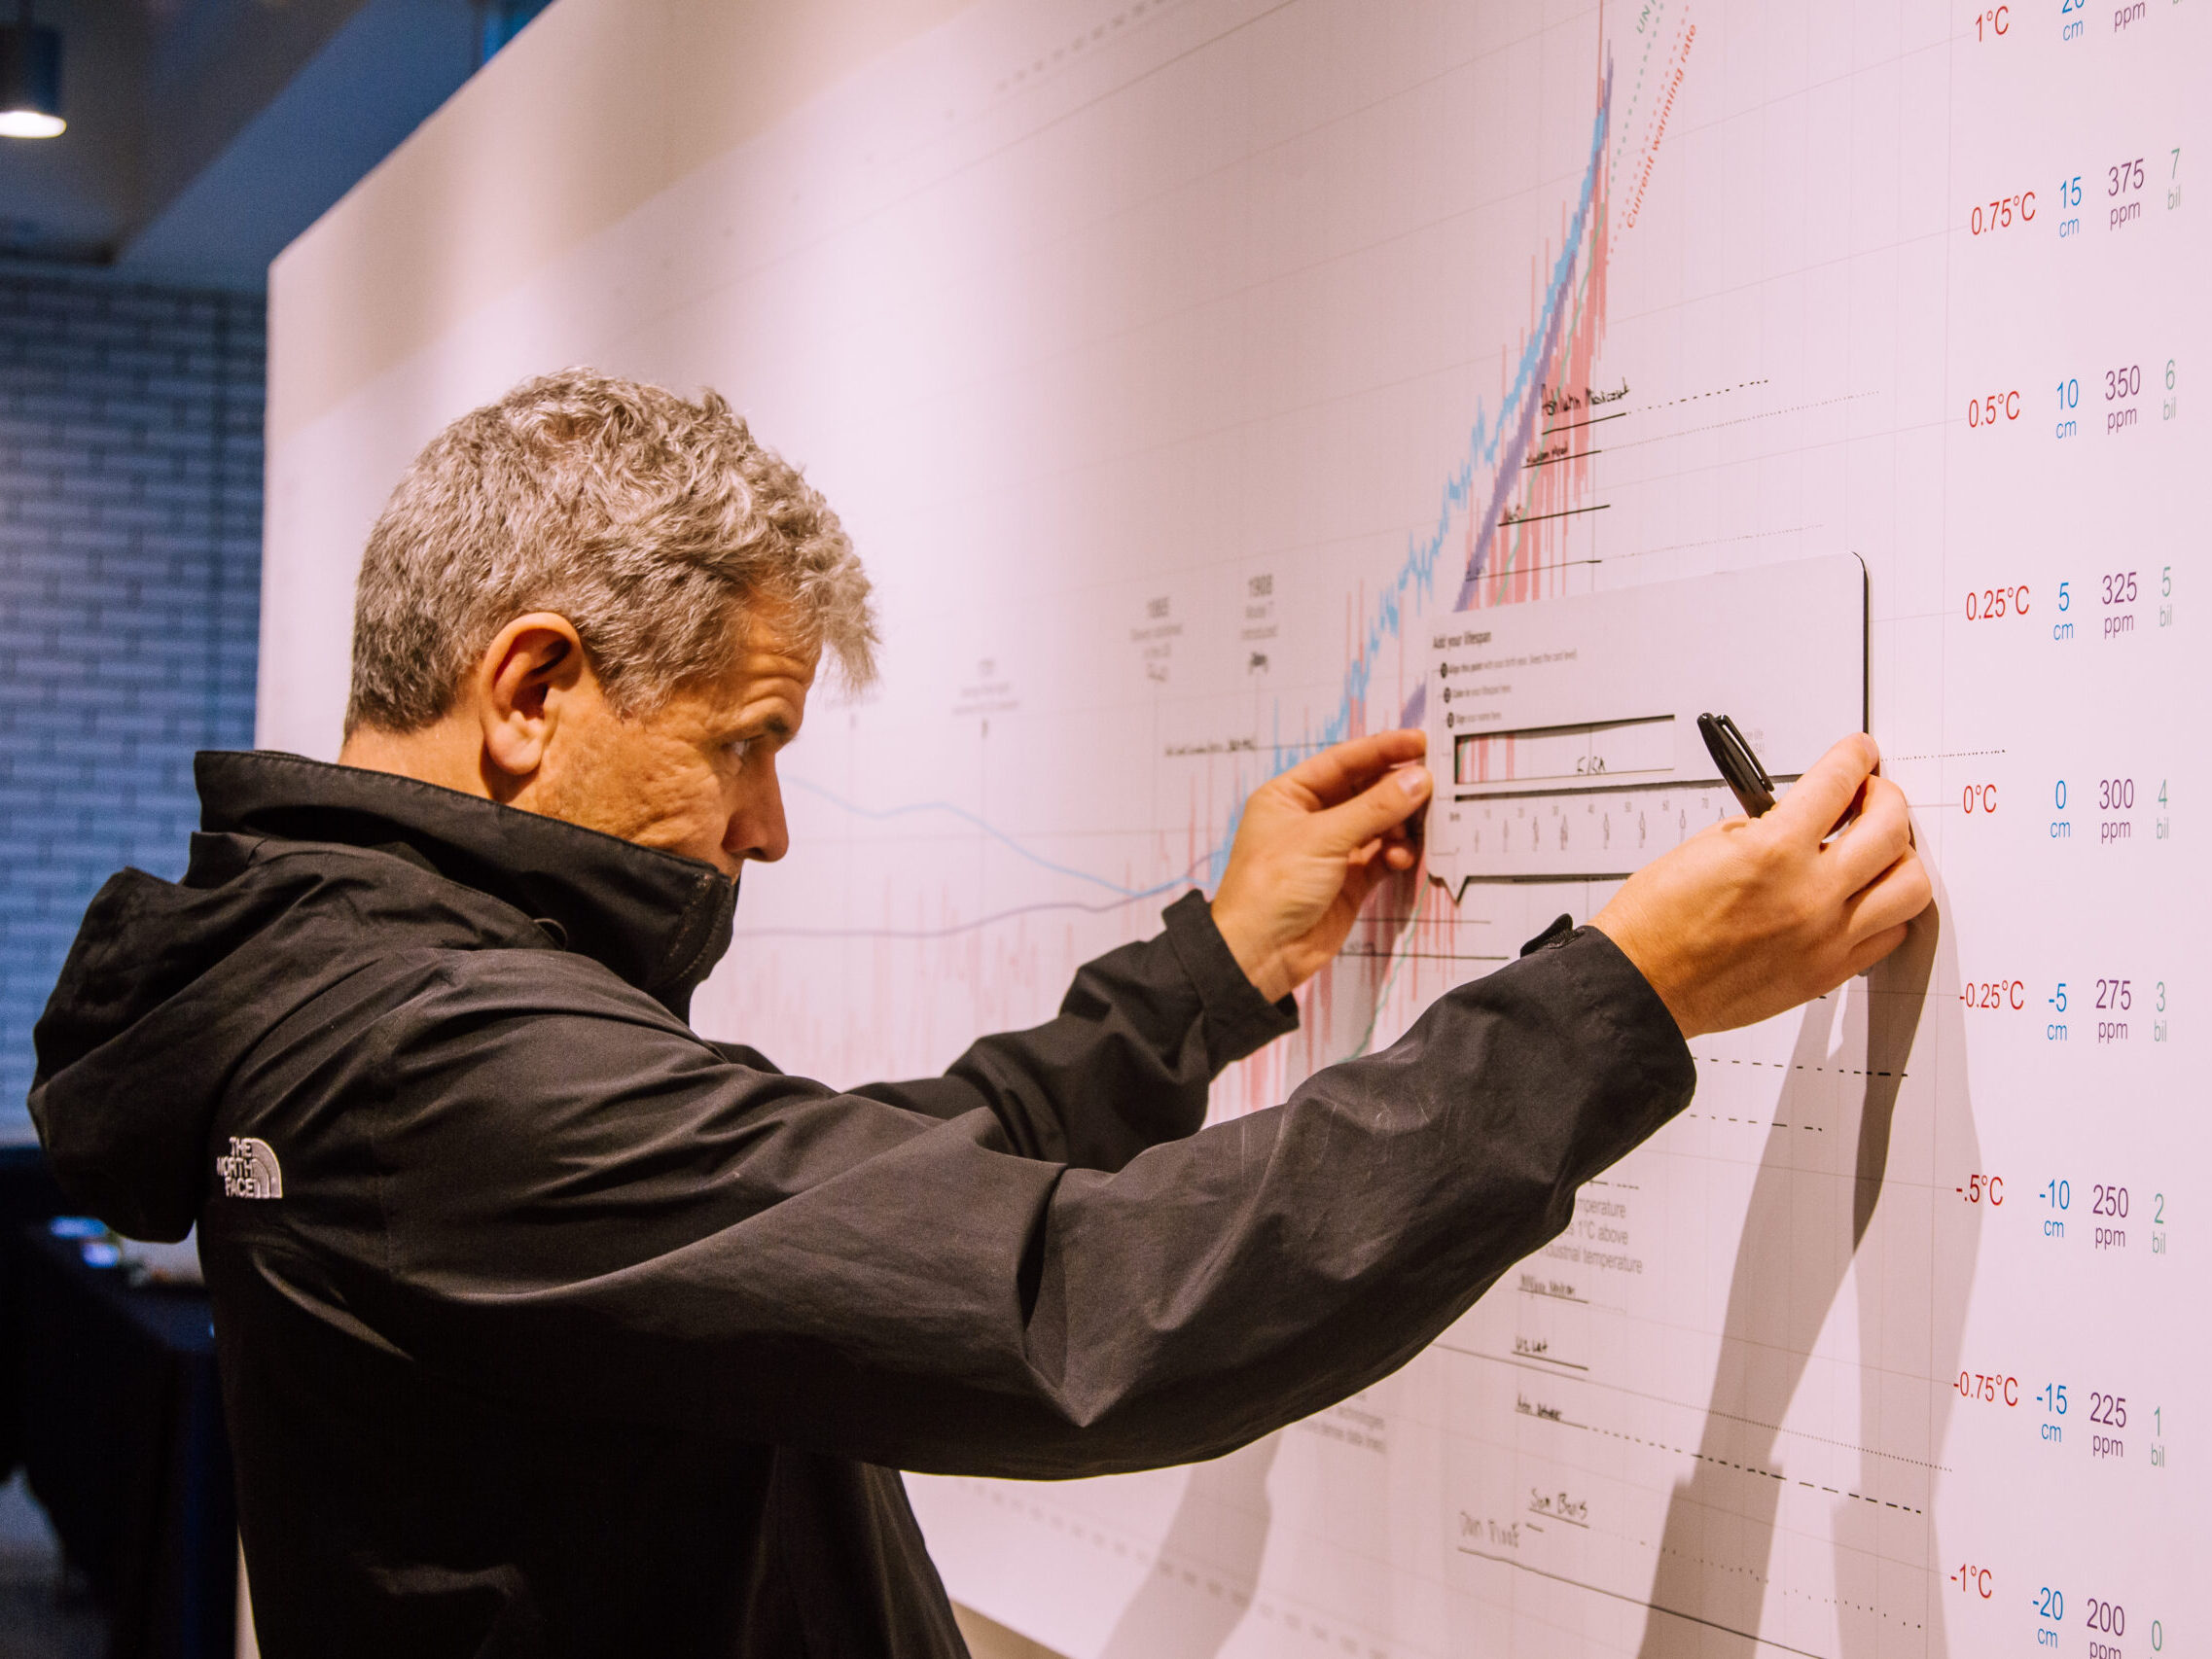
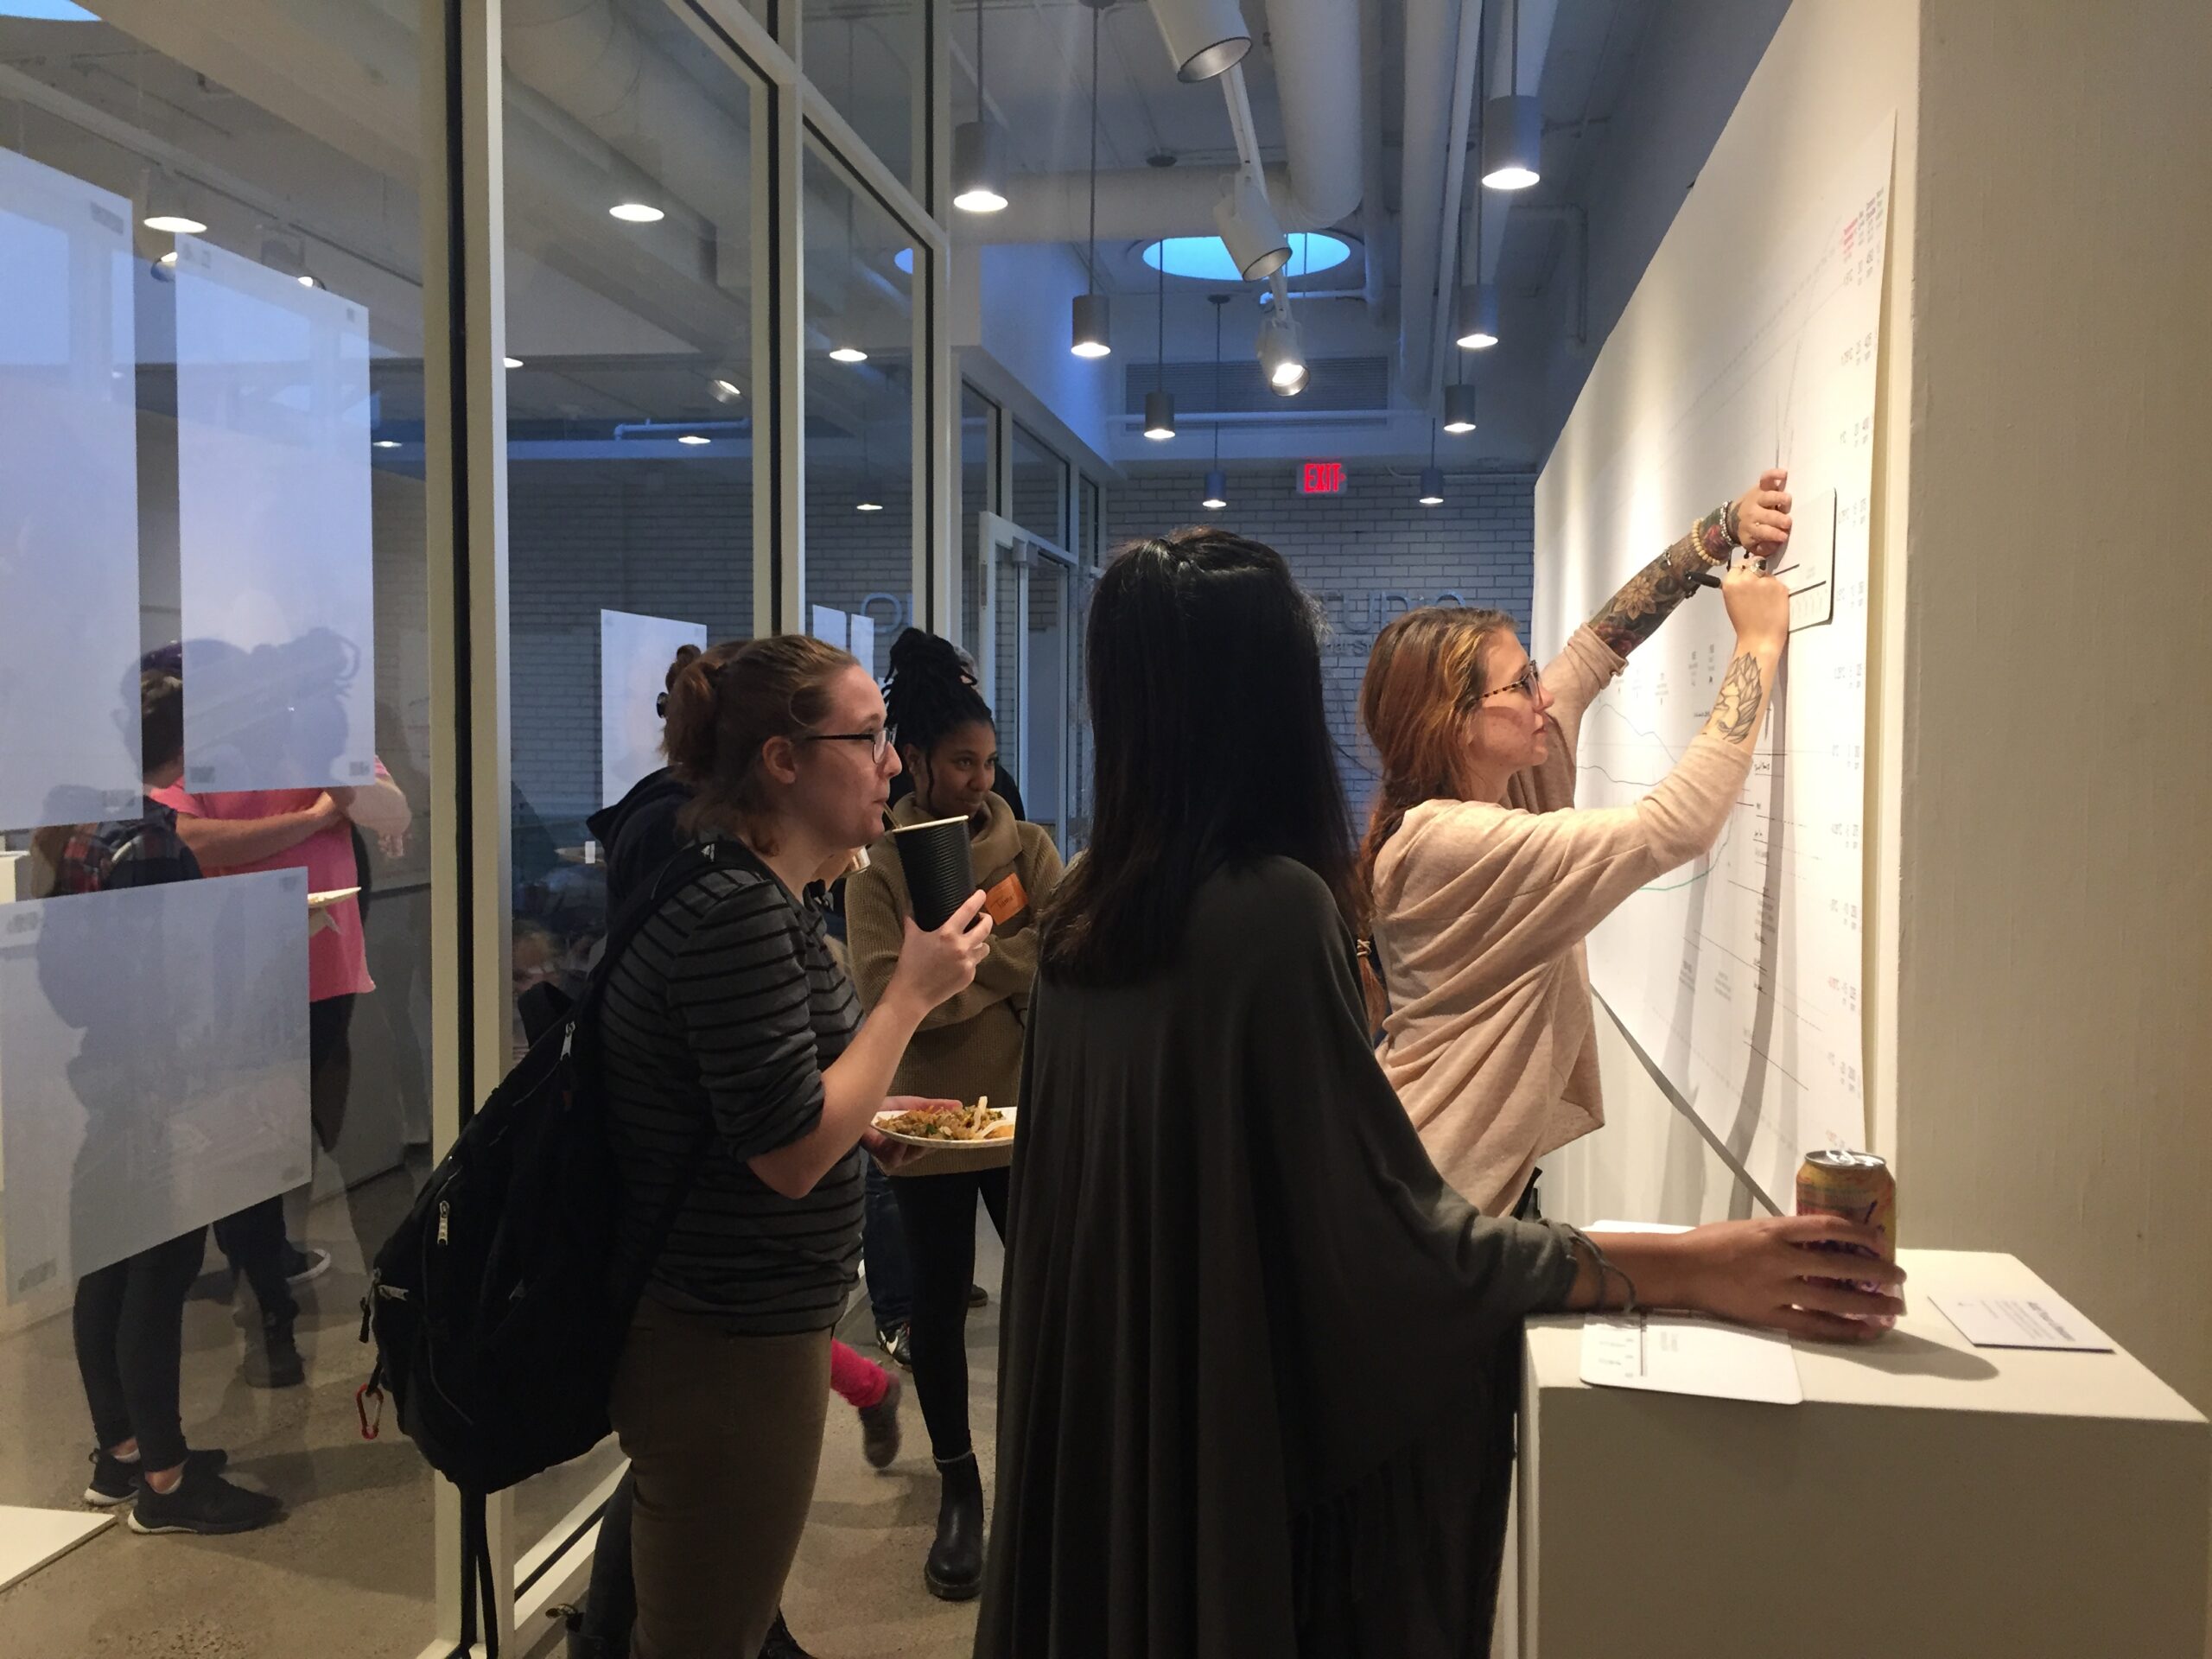
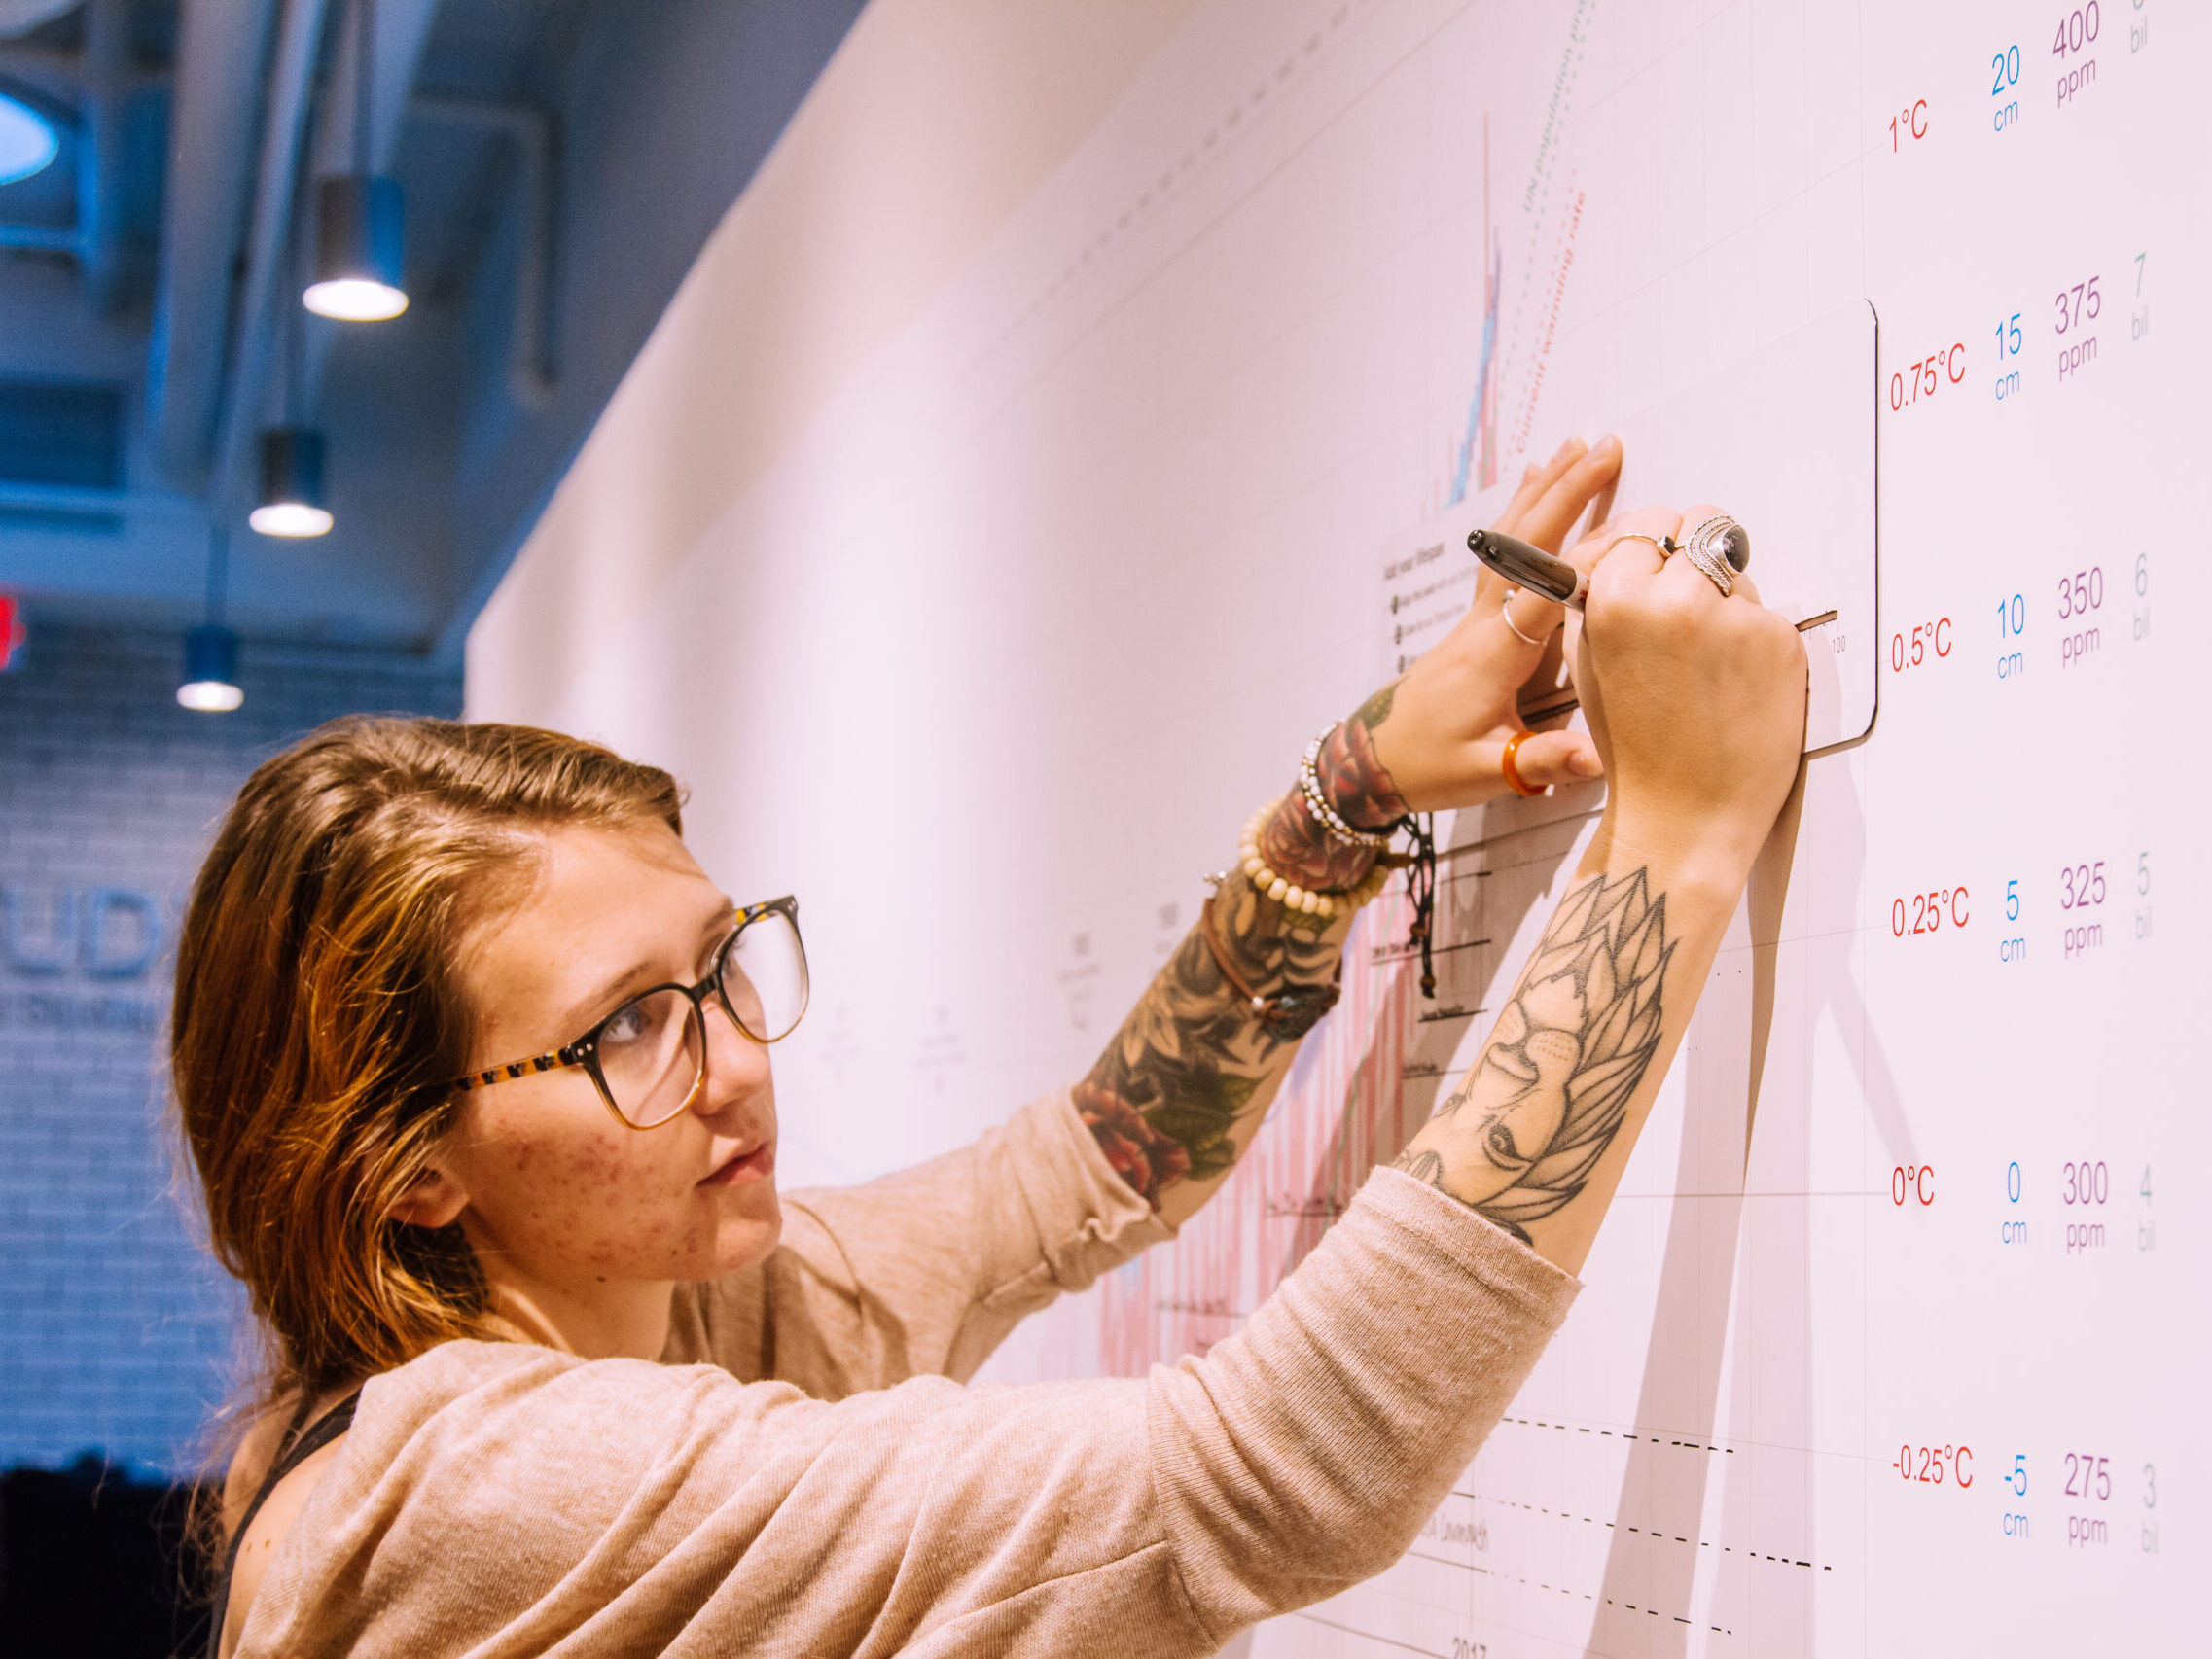
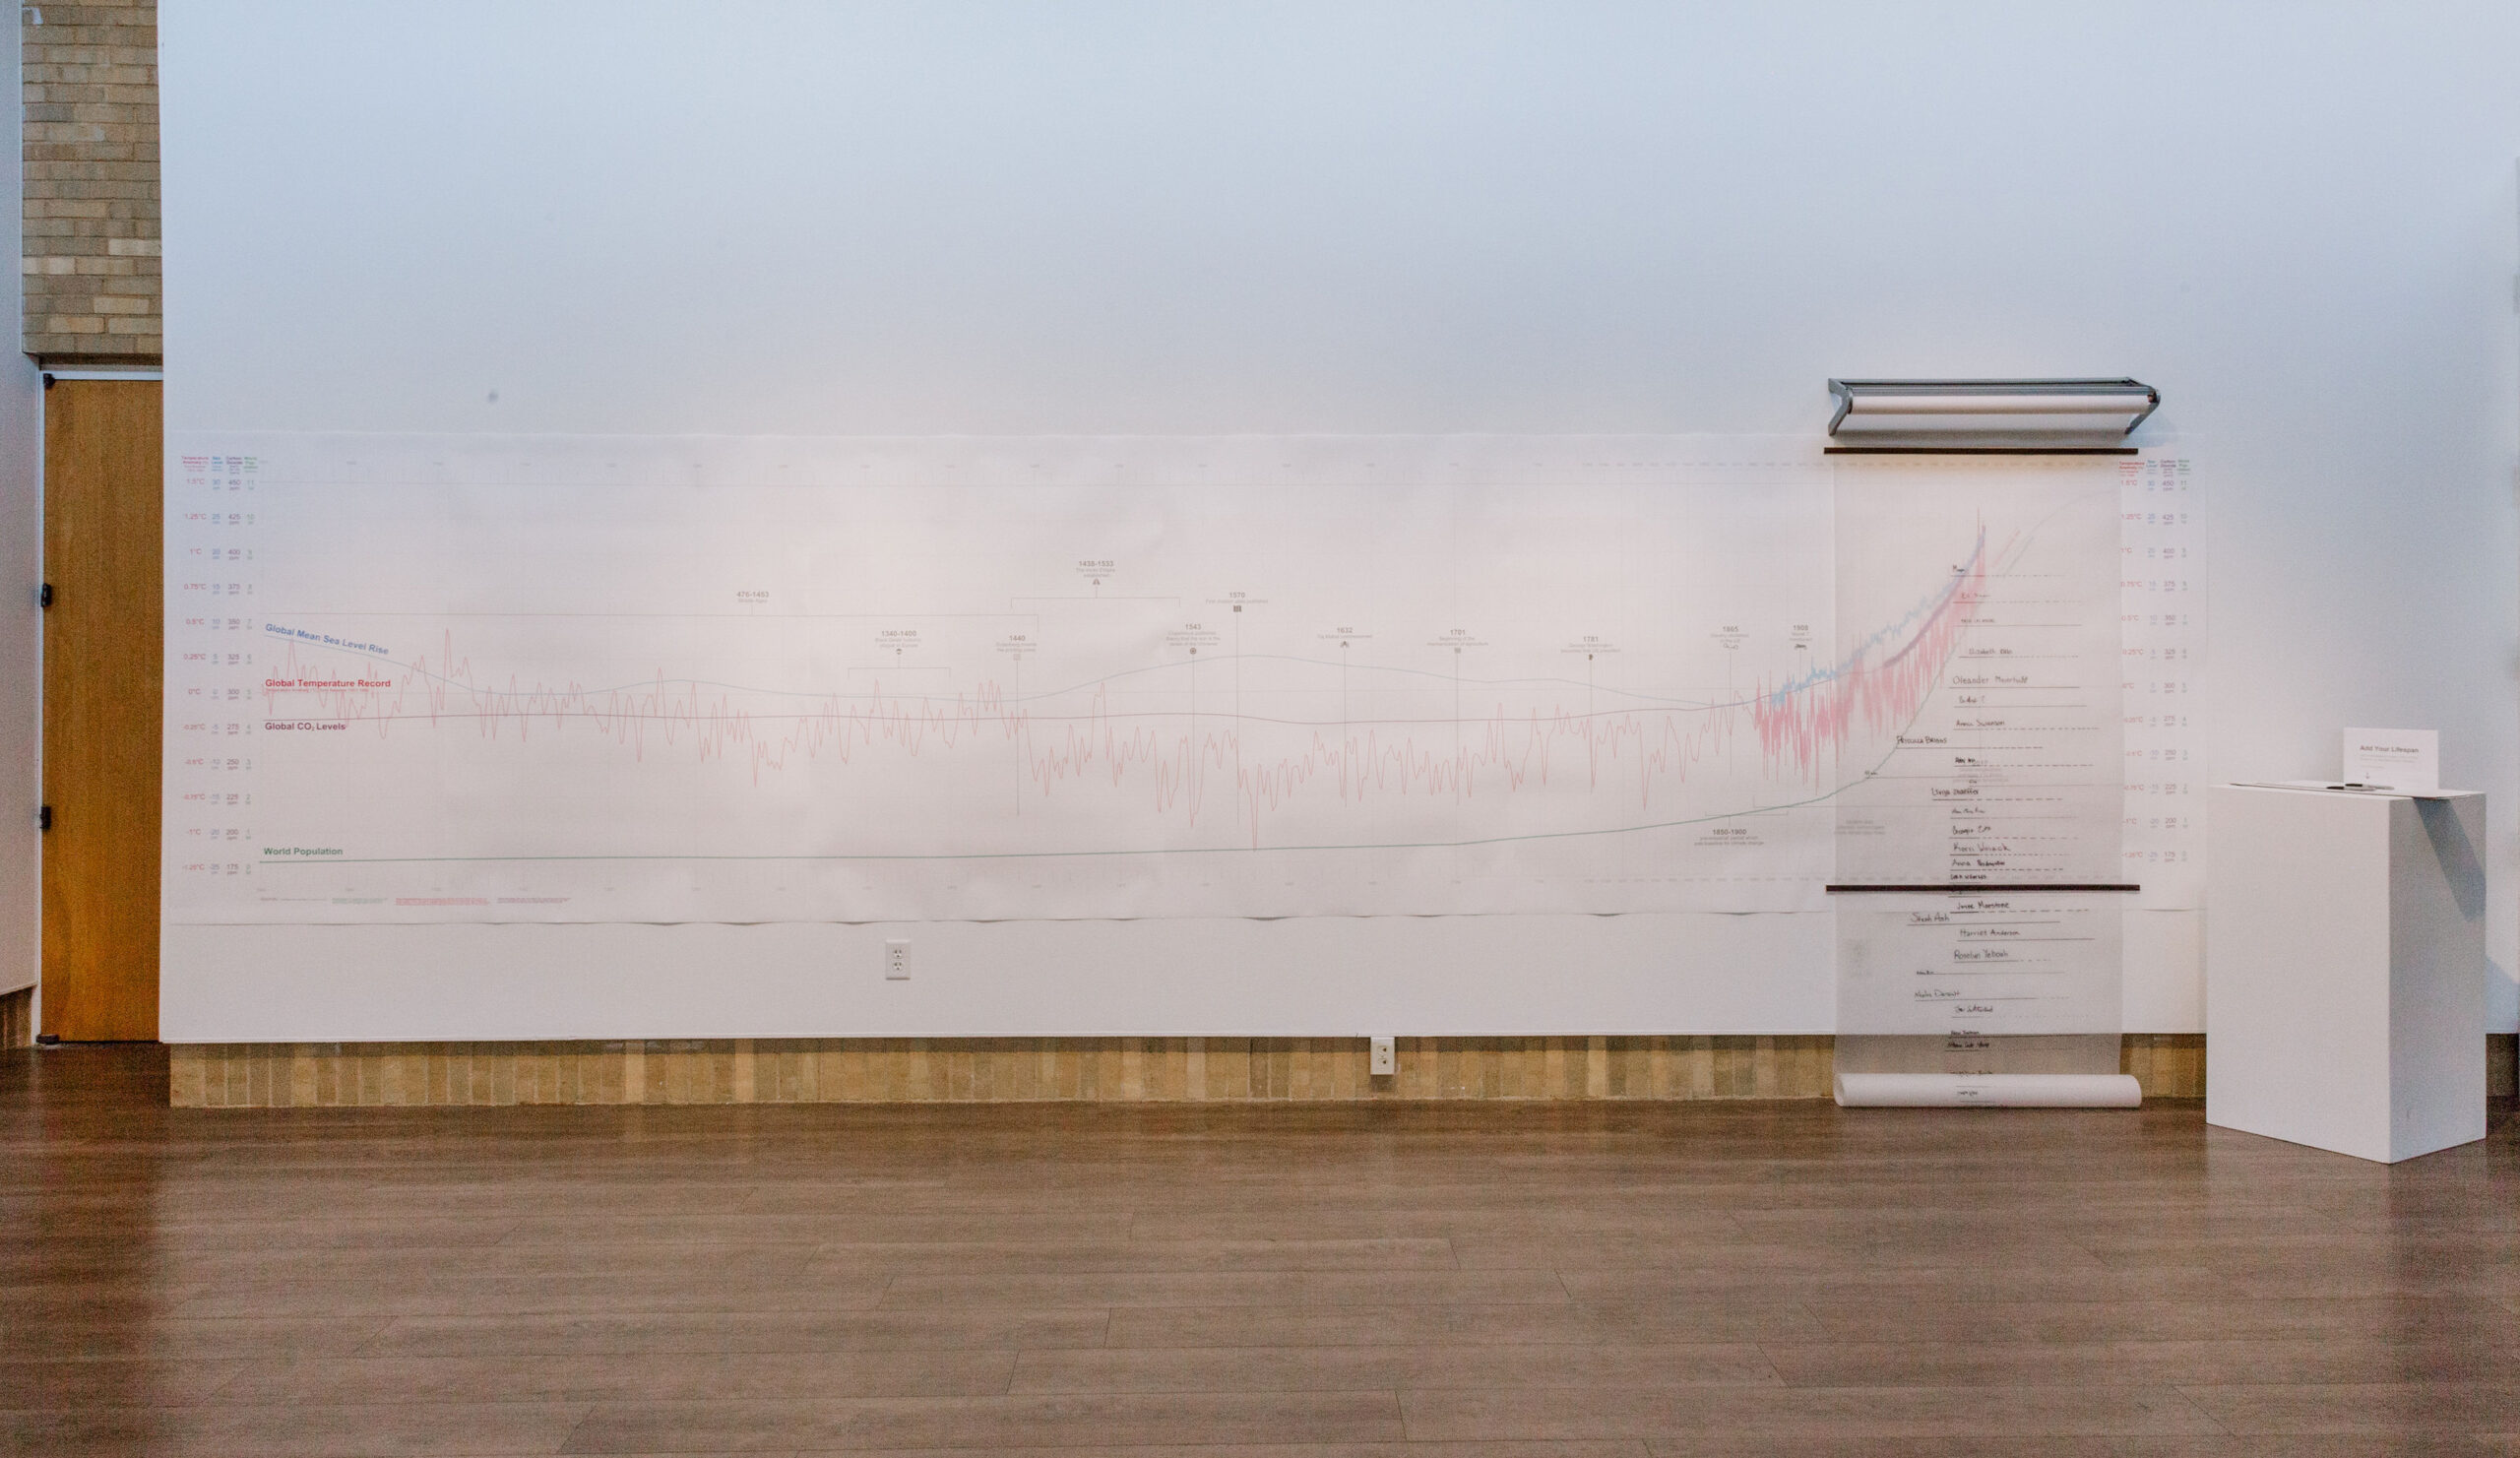
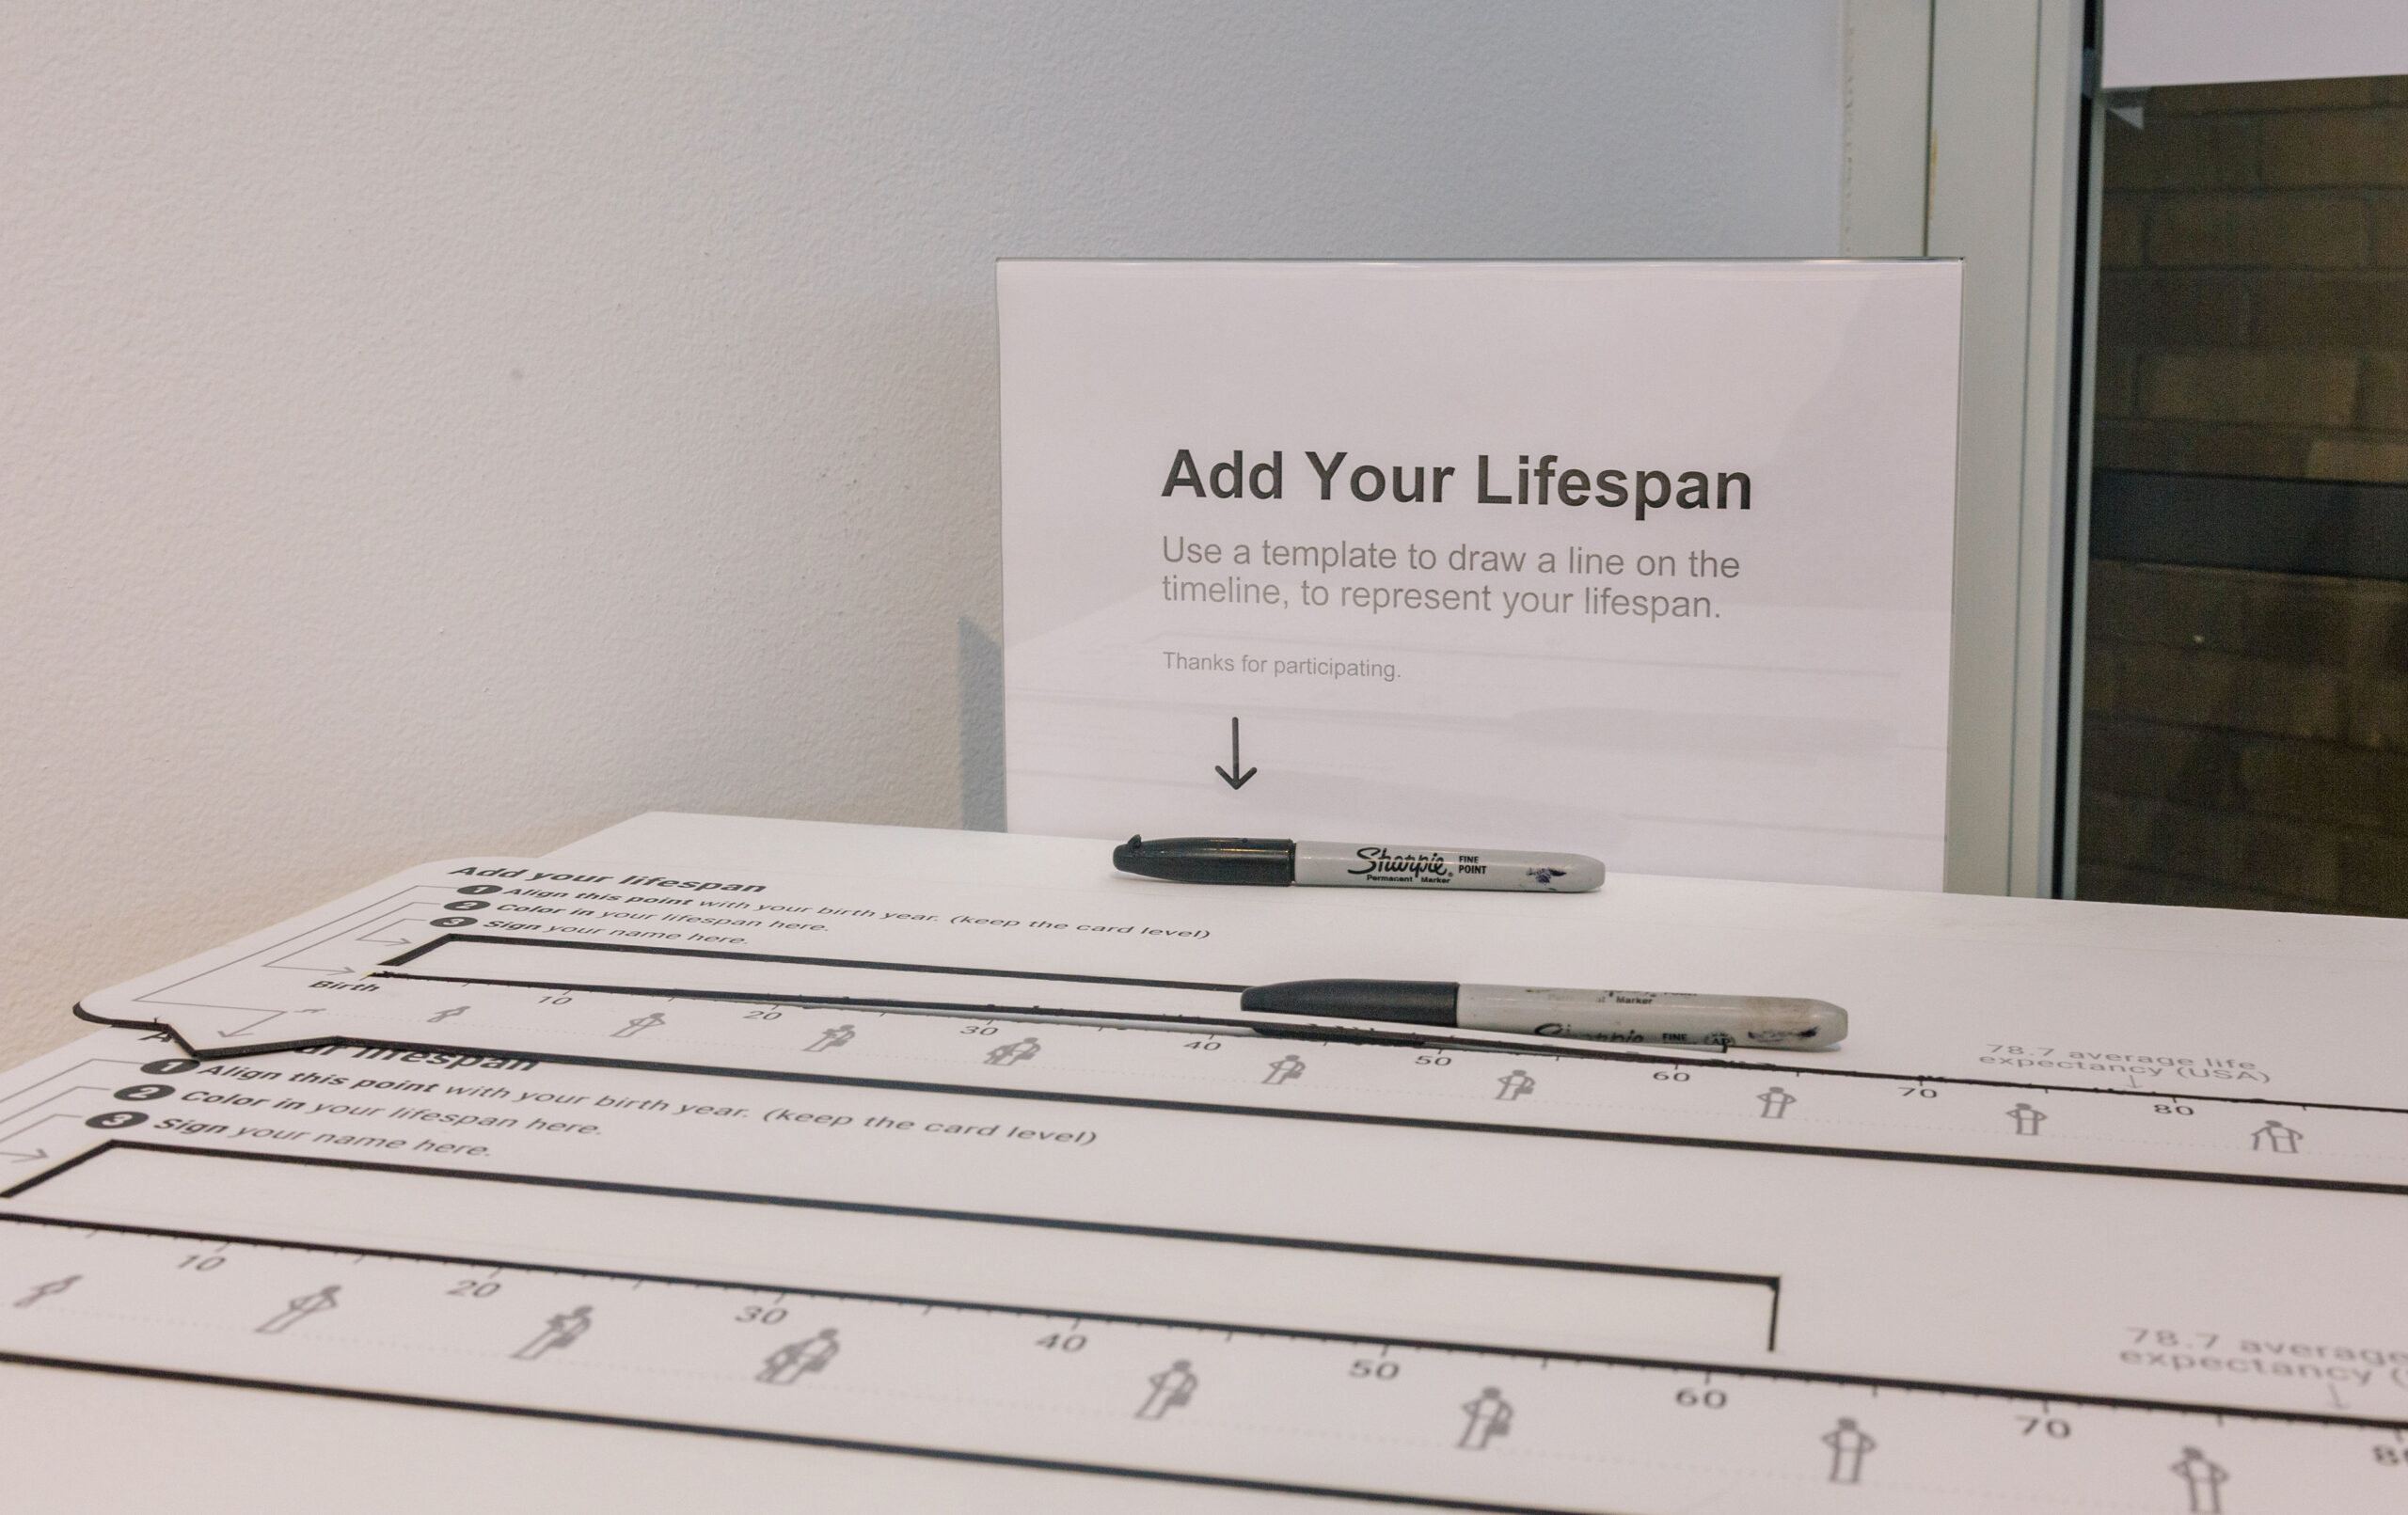
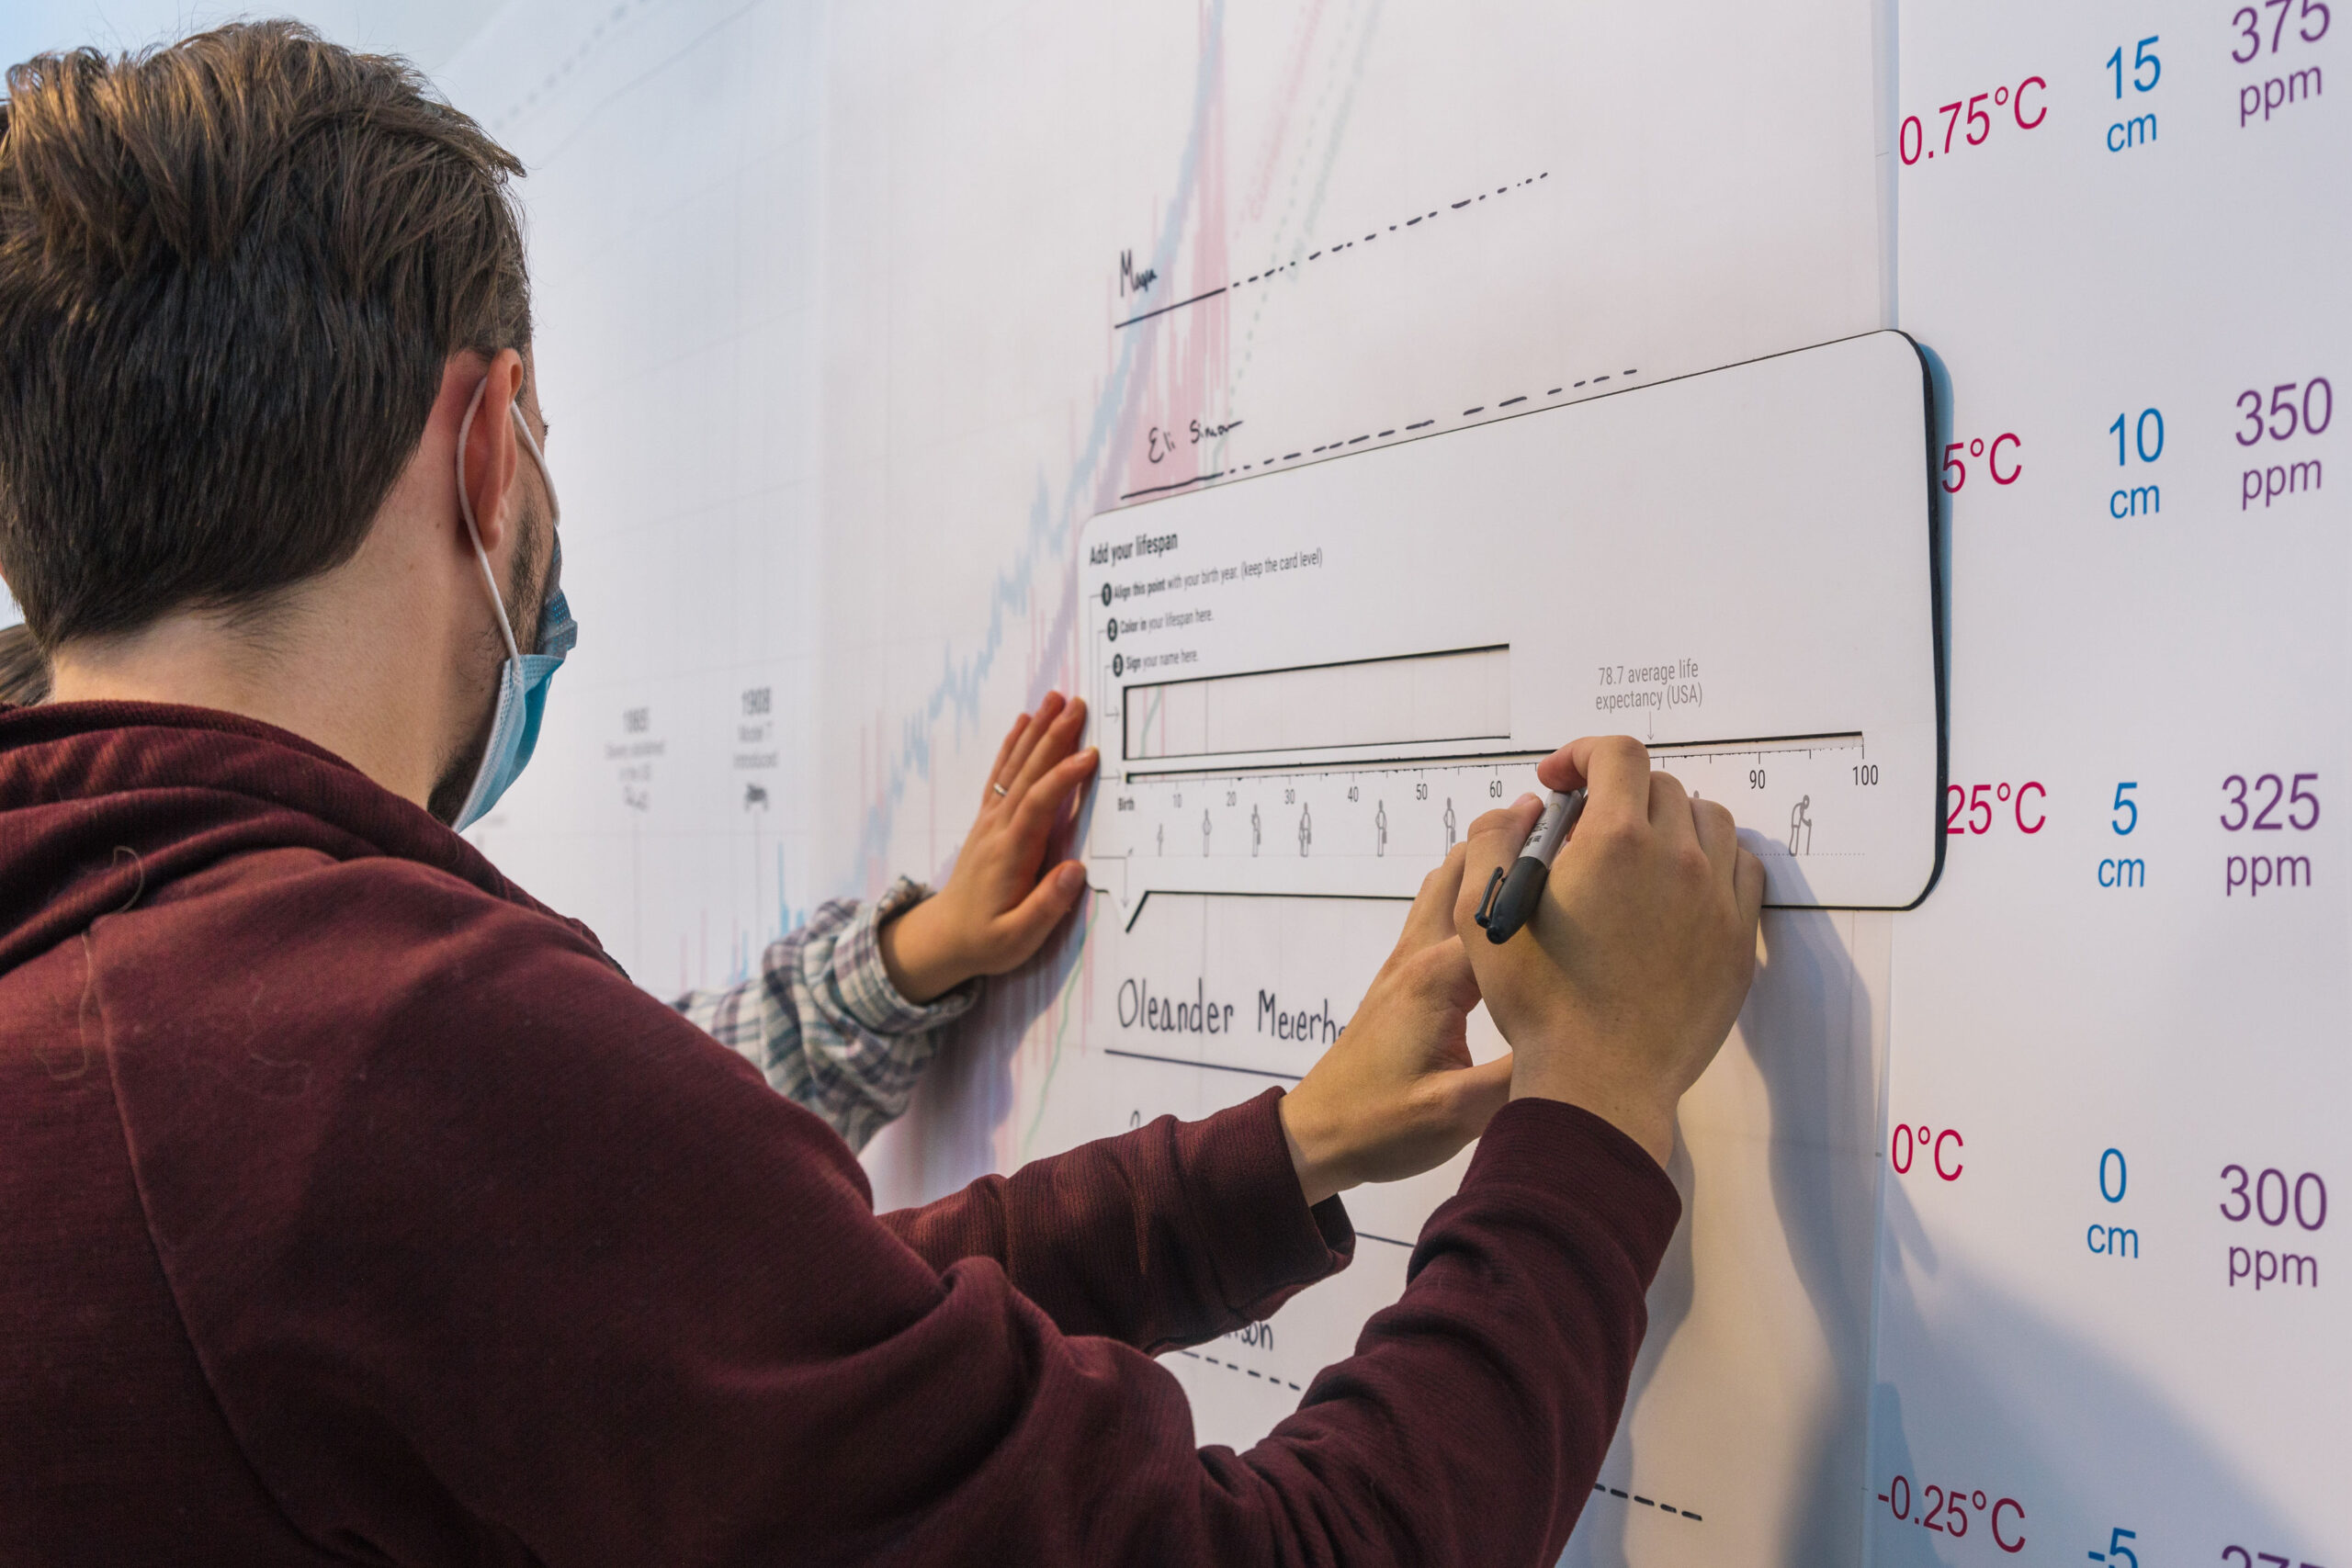
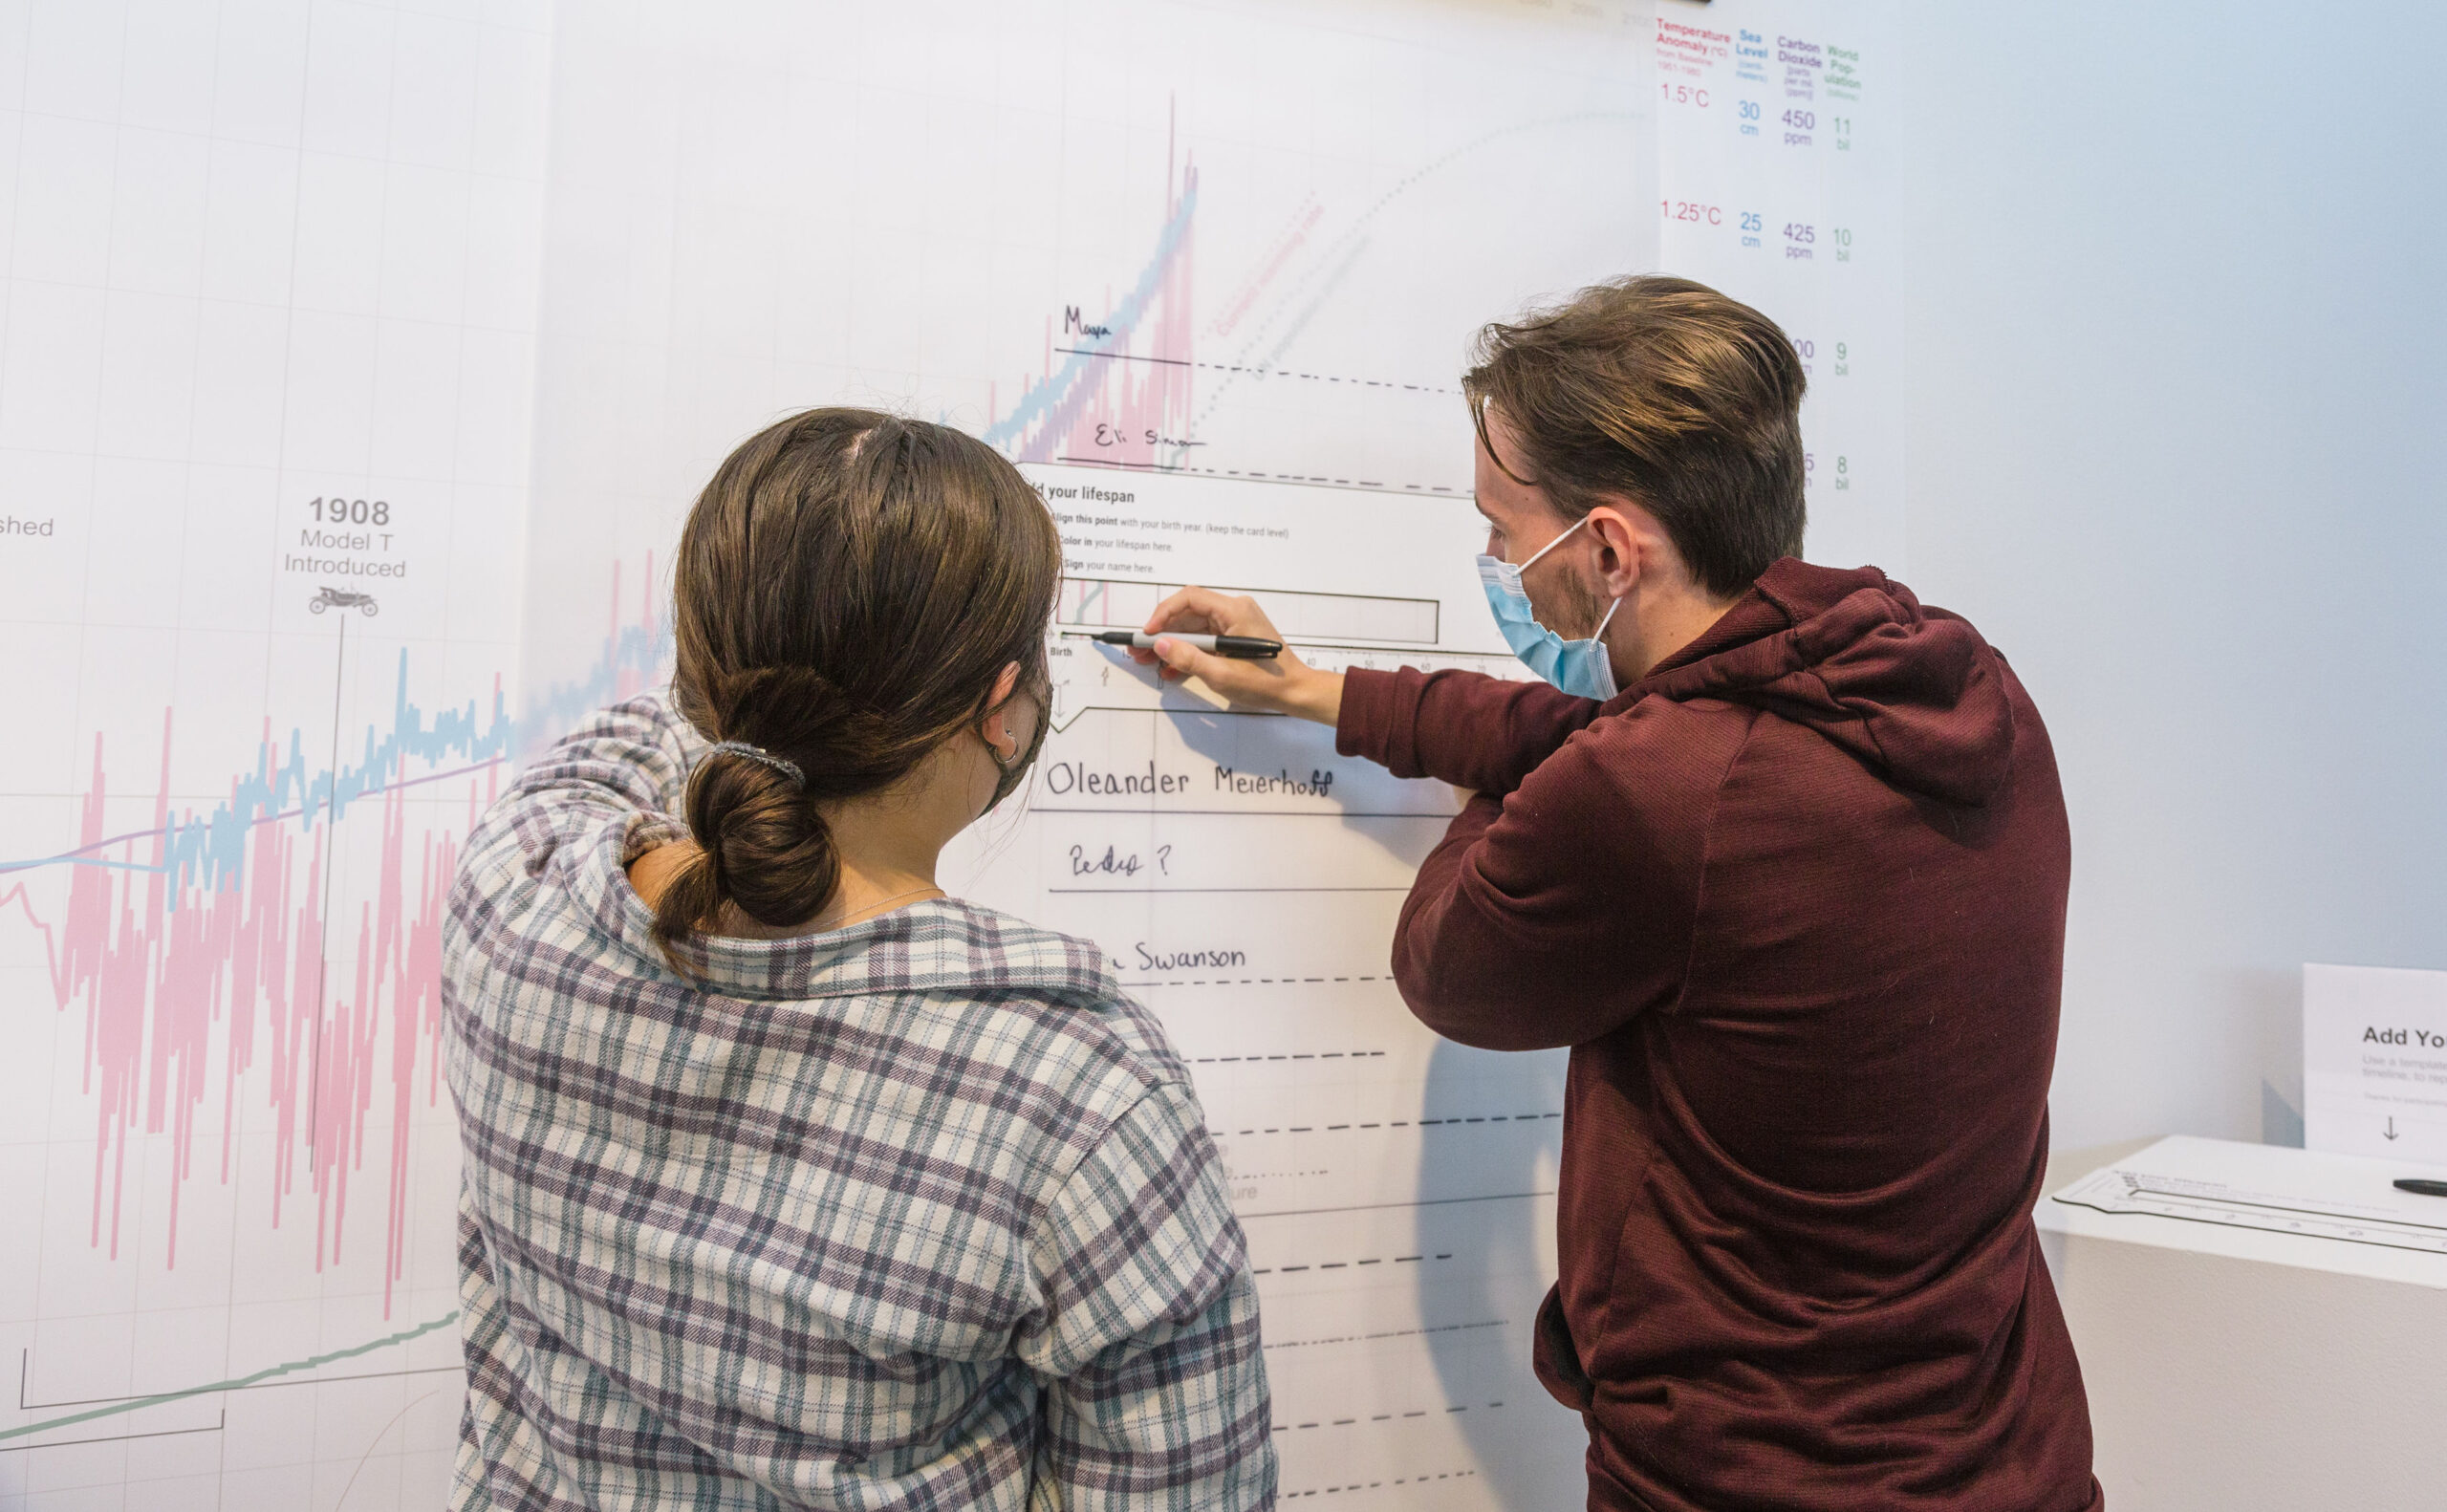
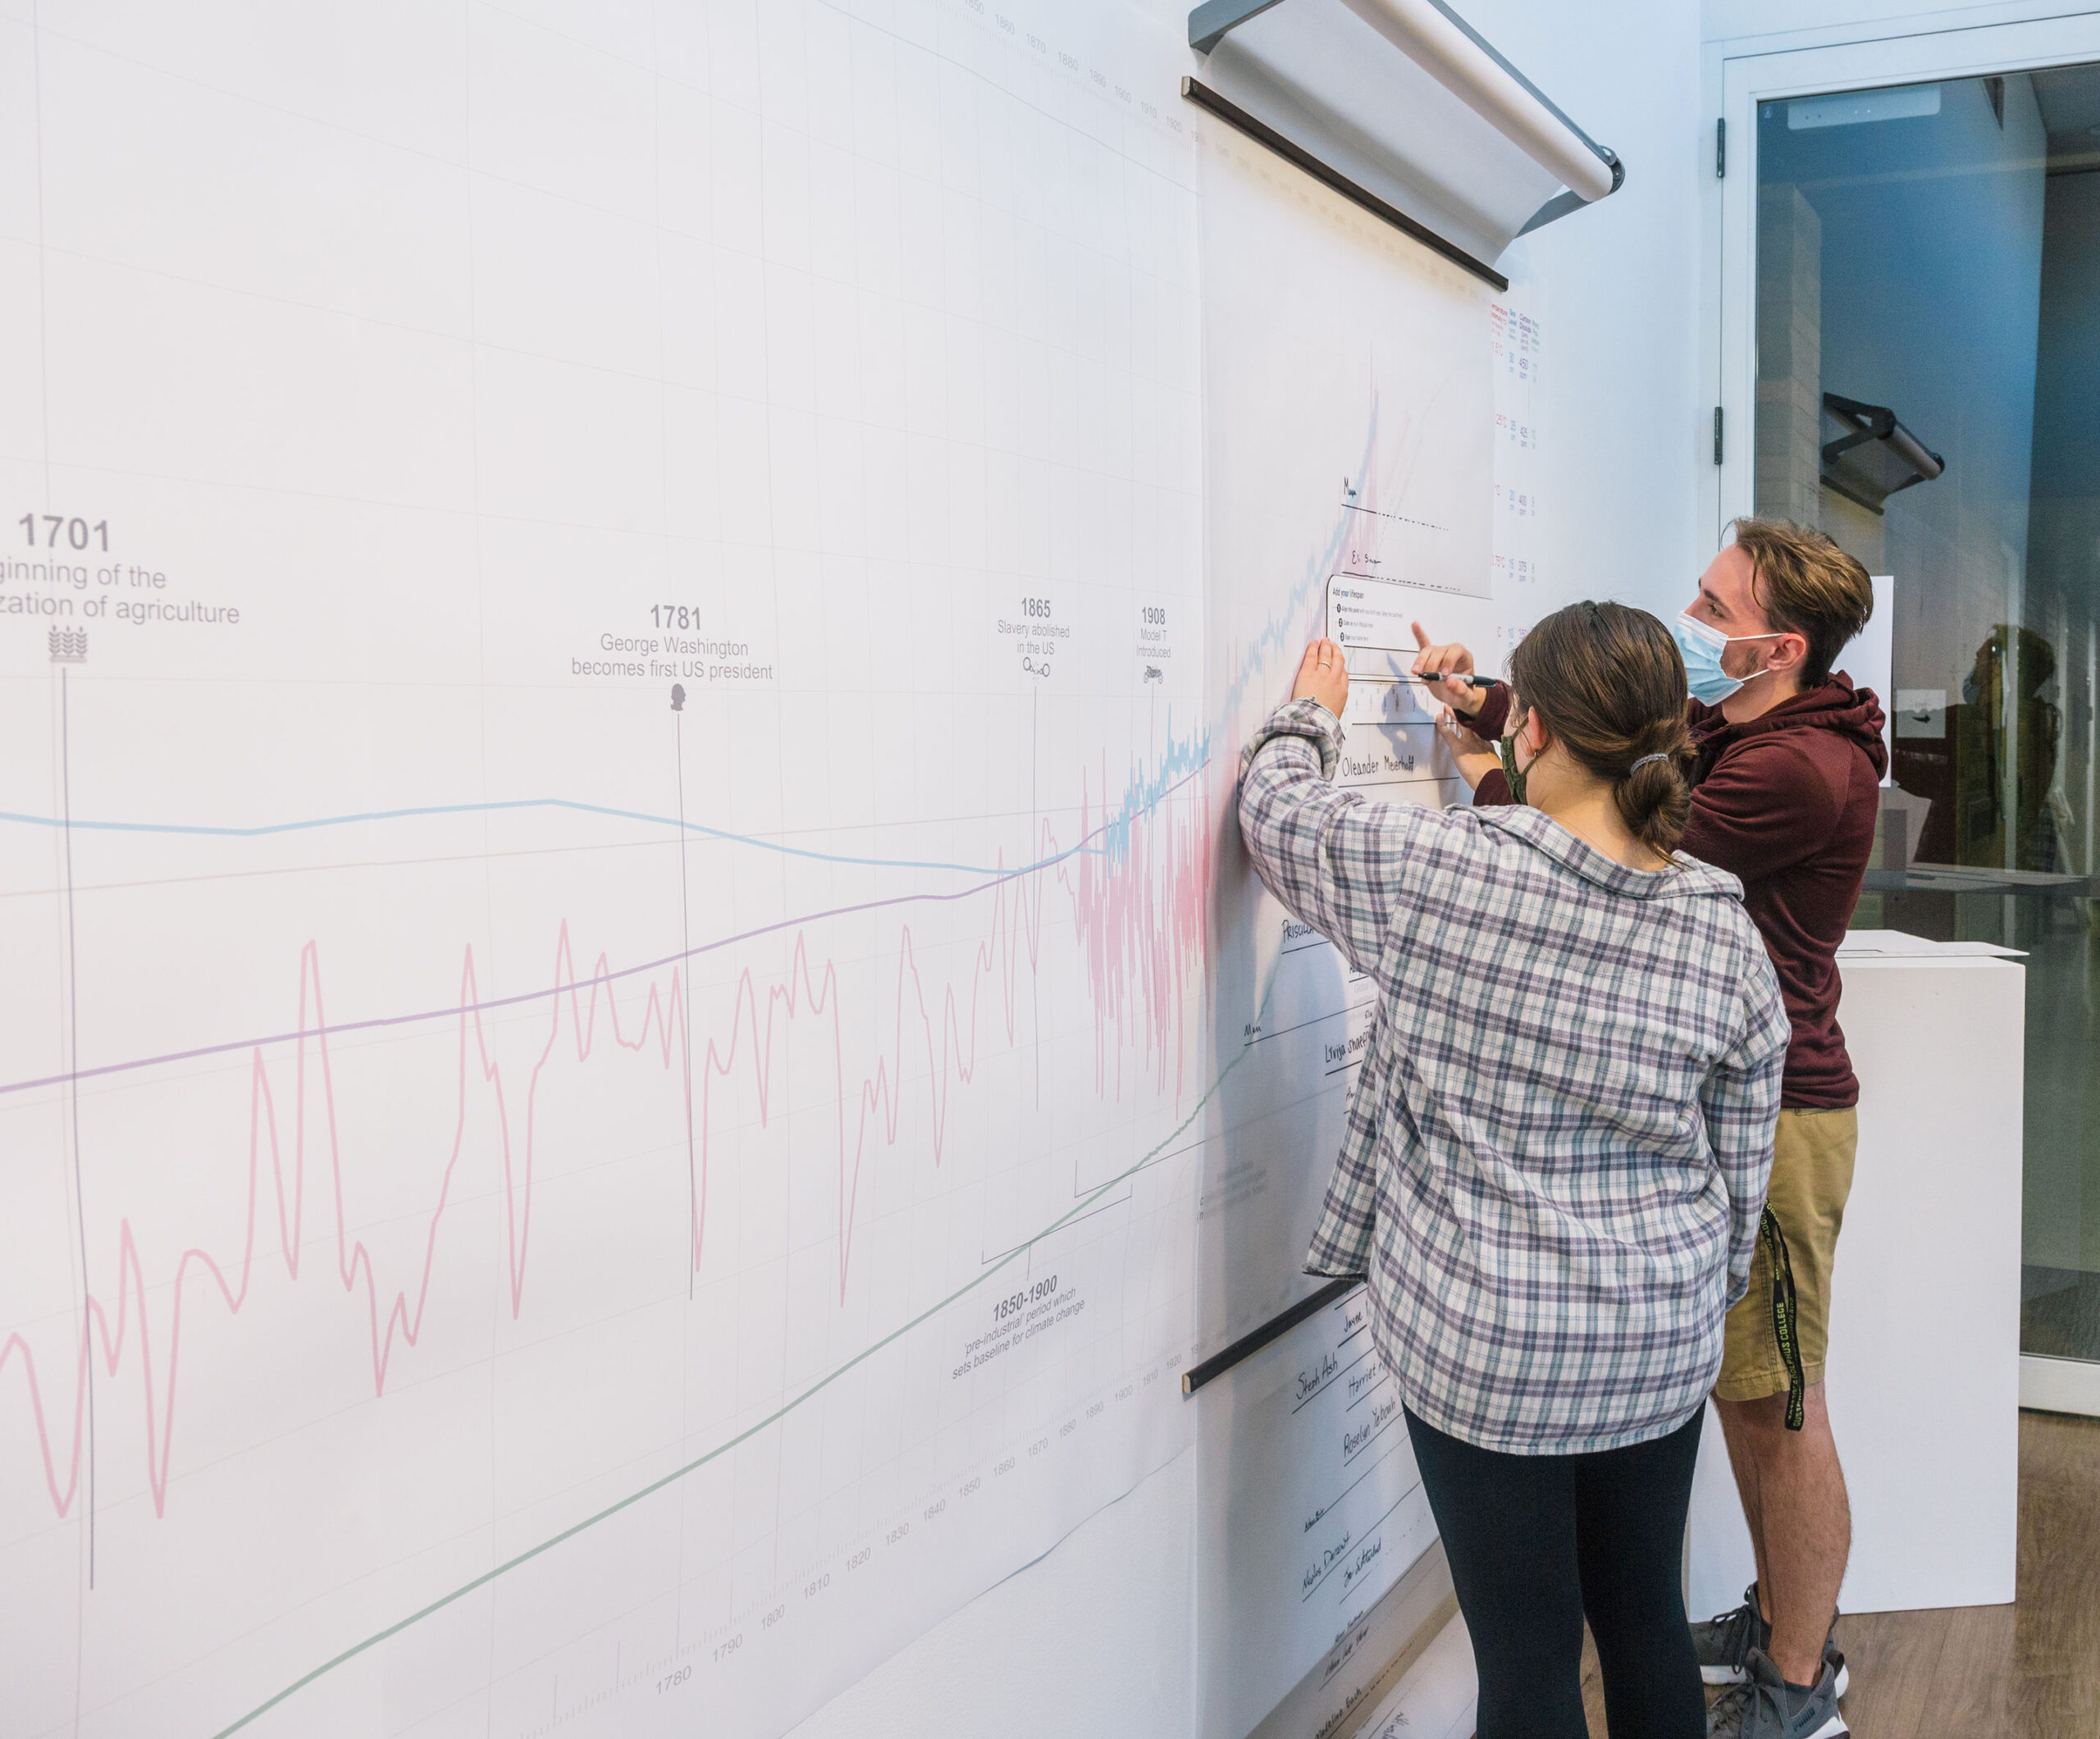
In the fall of 2019, Arlene installed a life-sized, participatory installation featuring human lifespans (and generational legacies) at an Arts Entrepreneurship exhibit at the Minneapolis College of Art and Design. Titled ‘Your Lifespan’, visitors draw their own lifespans atop a 16-foot-long (~5m) banner containing graphs of global changes. The graphs include past observations and future projections of temperature, sea level, CO2 levels, and population from the year 1000 to 2040. The timeline is annotated with major global events.

2021

Variations on all of these previous generation-related experiments were installed at a solo exhibit at Gustavus Adolphus' Schaefer art gallery in Minnesota in 2021 –in conjunction with Nobel Conference 57 -Big Data REvolution.

The installation featured:

Climate Lifespans:

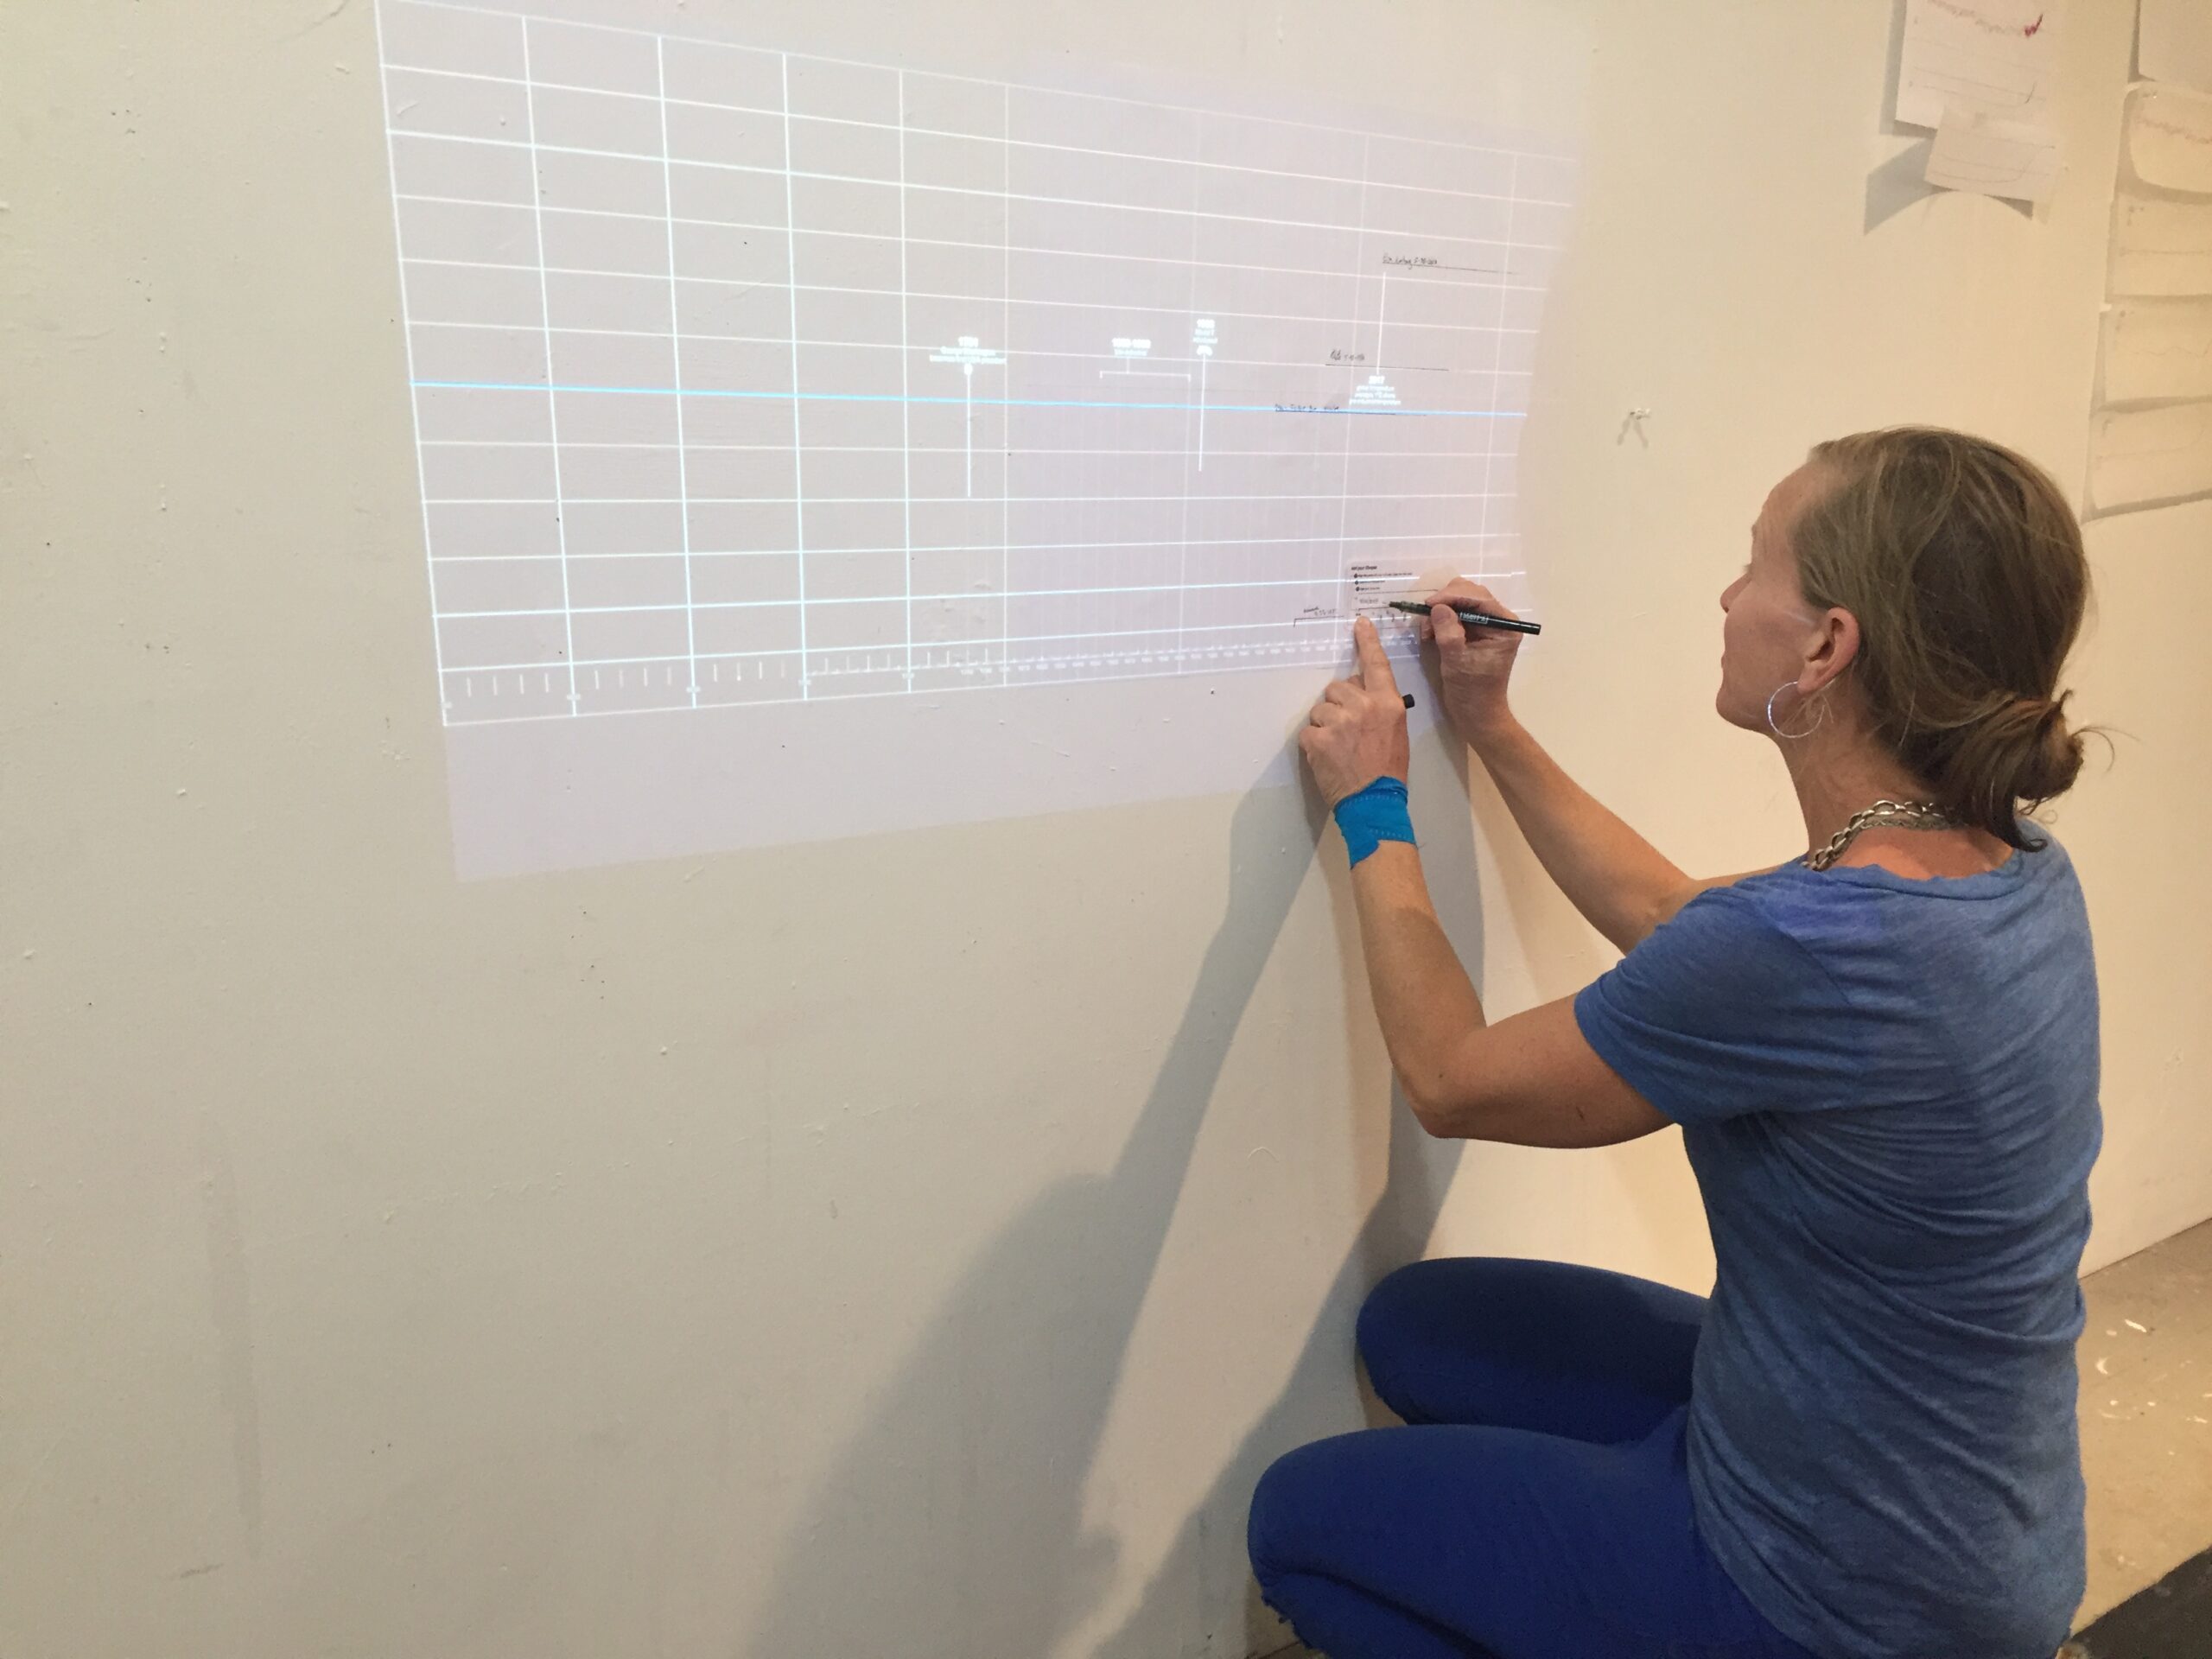
A large-scale participation-focused installation where visitors draw their own lifespans within projected graphs of global changes (temperature, sea level, CO2 levels, and population) between the years 1000 to 2040.

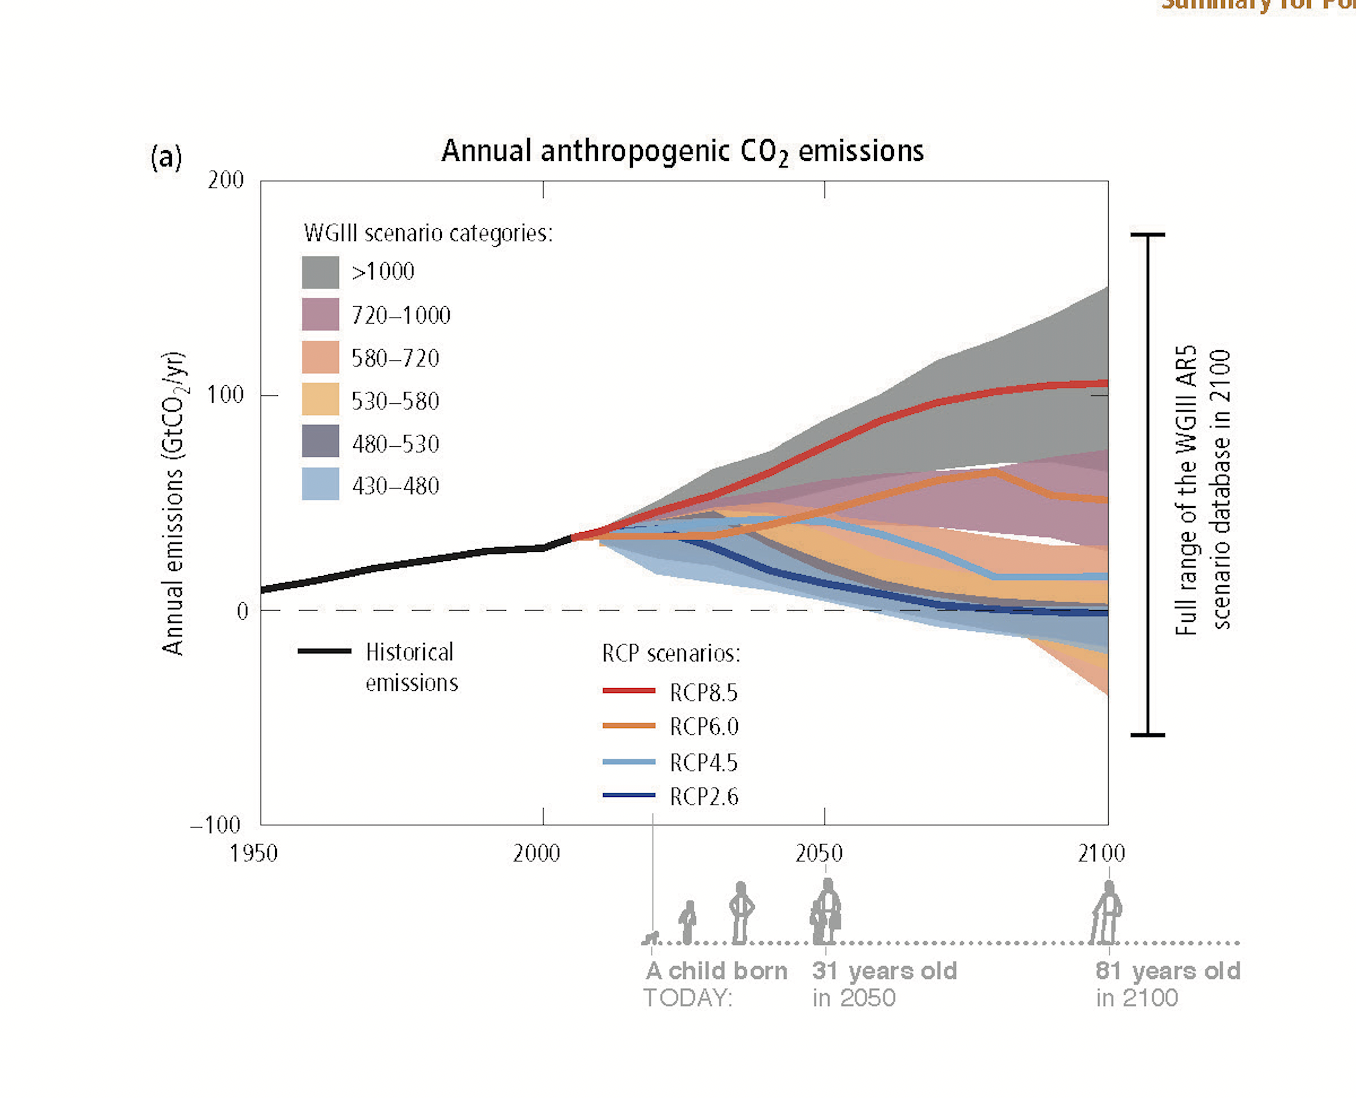
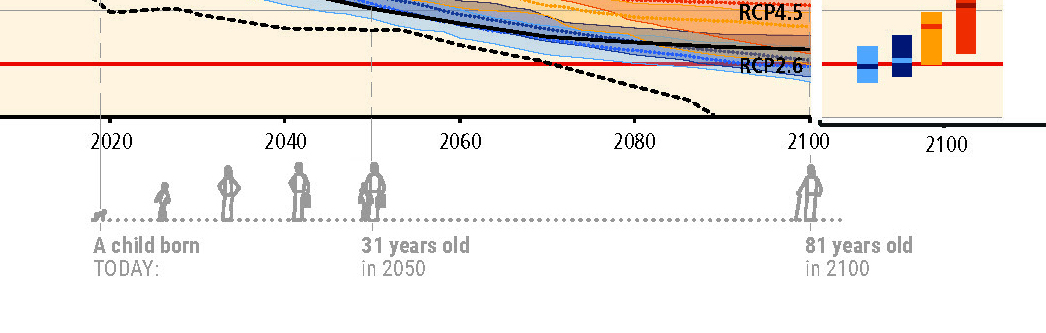
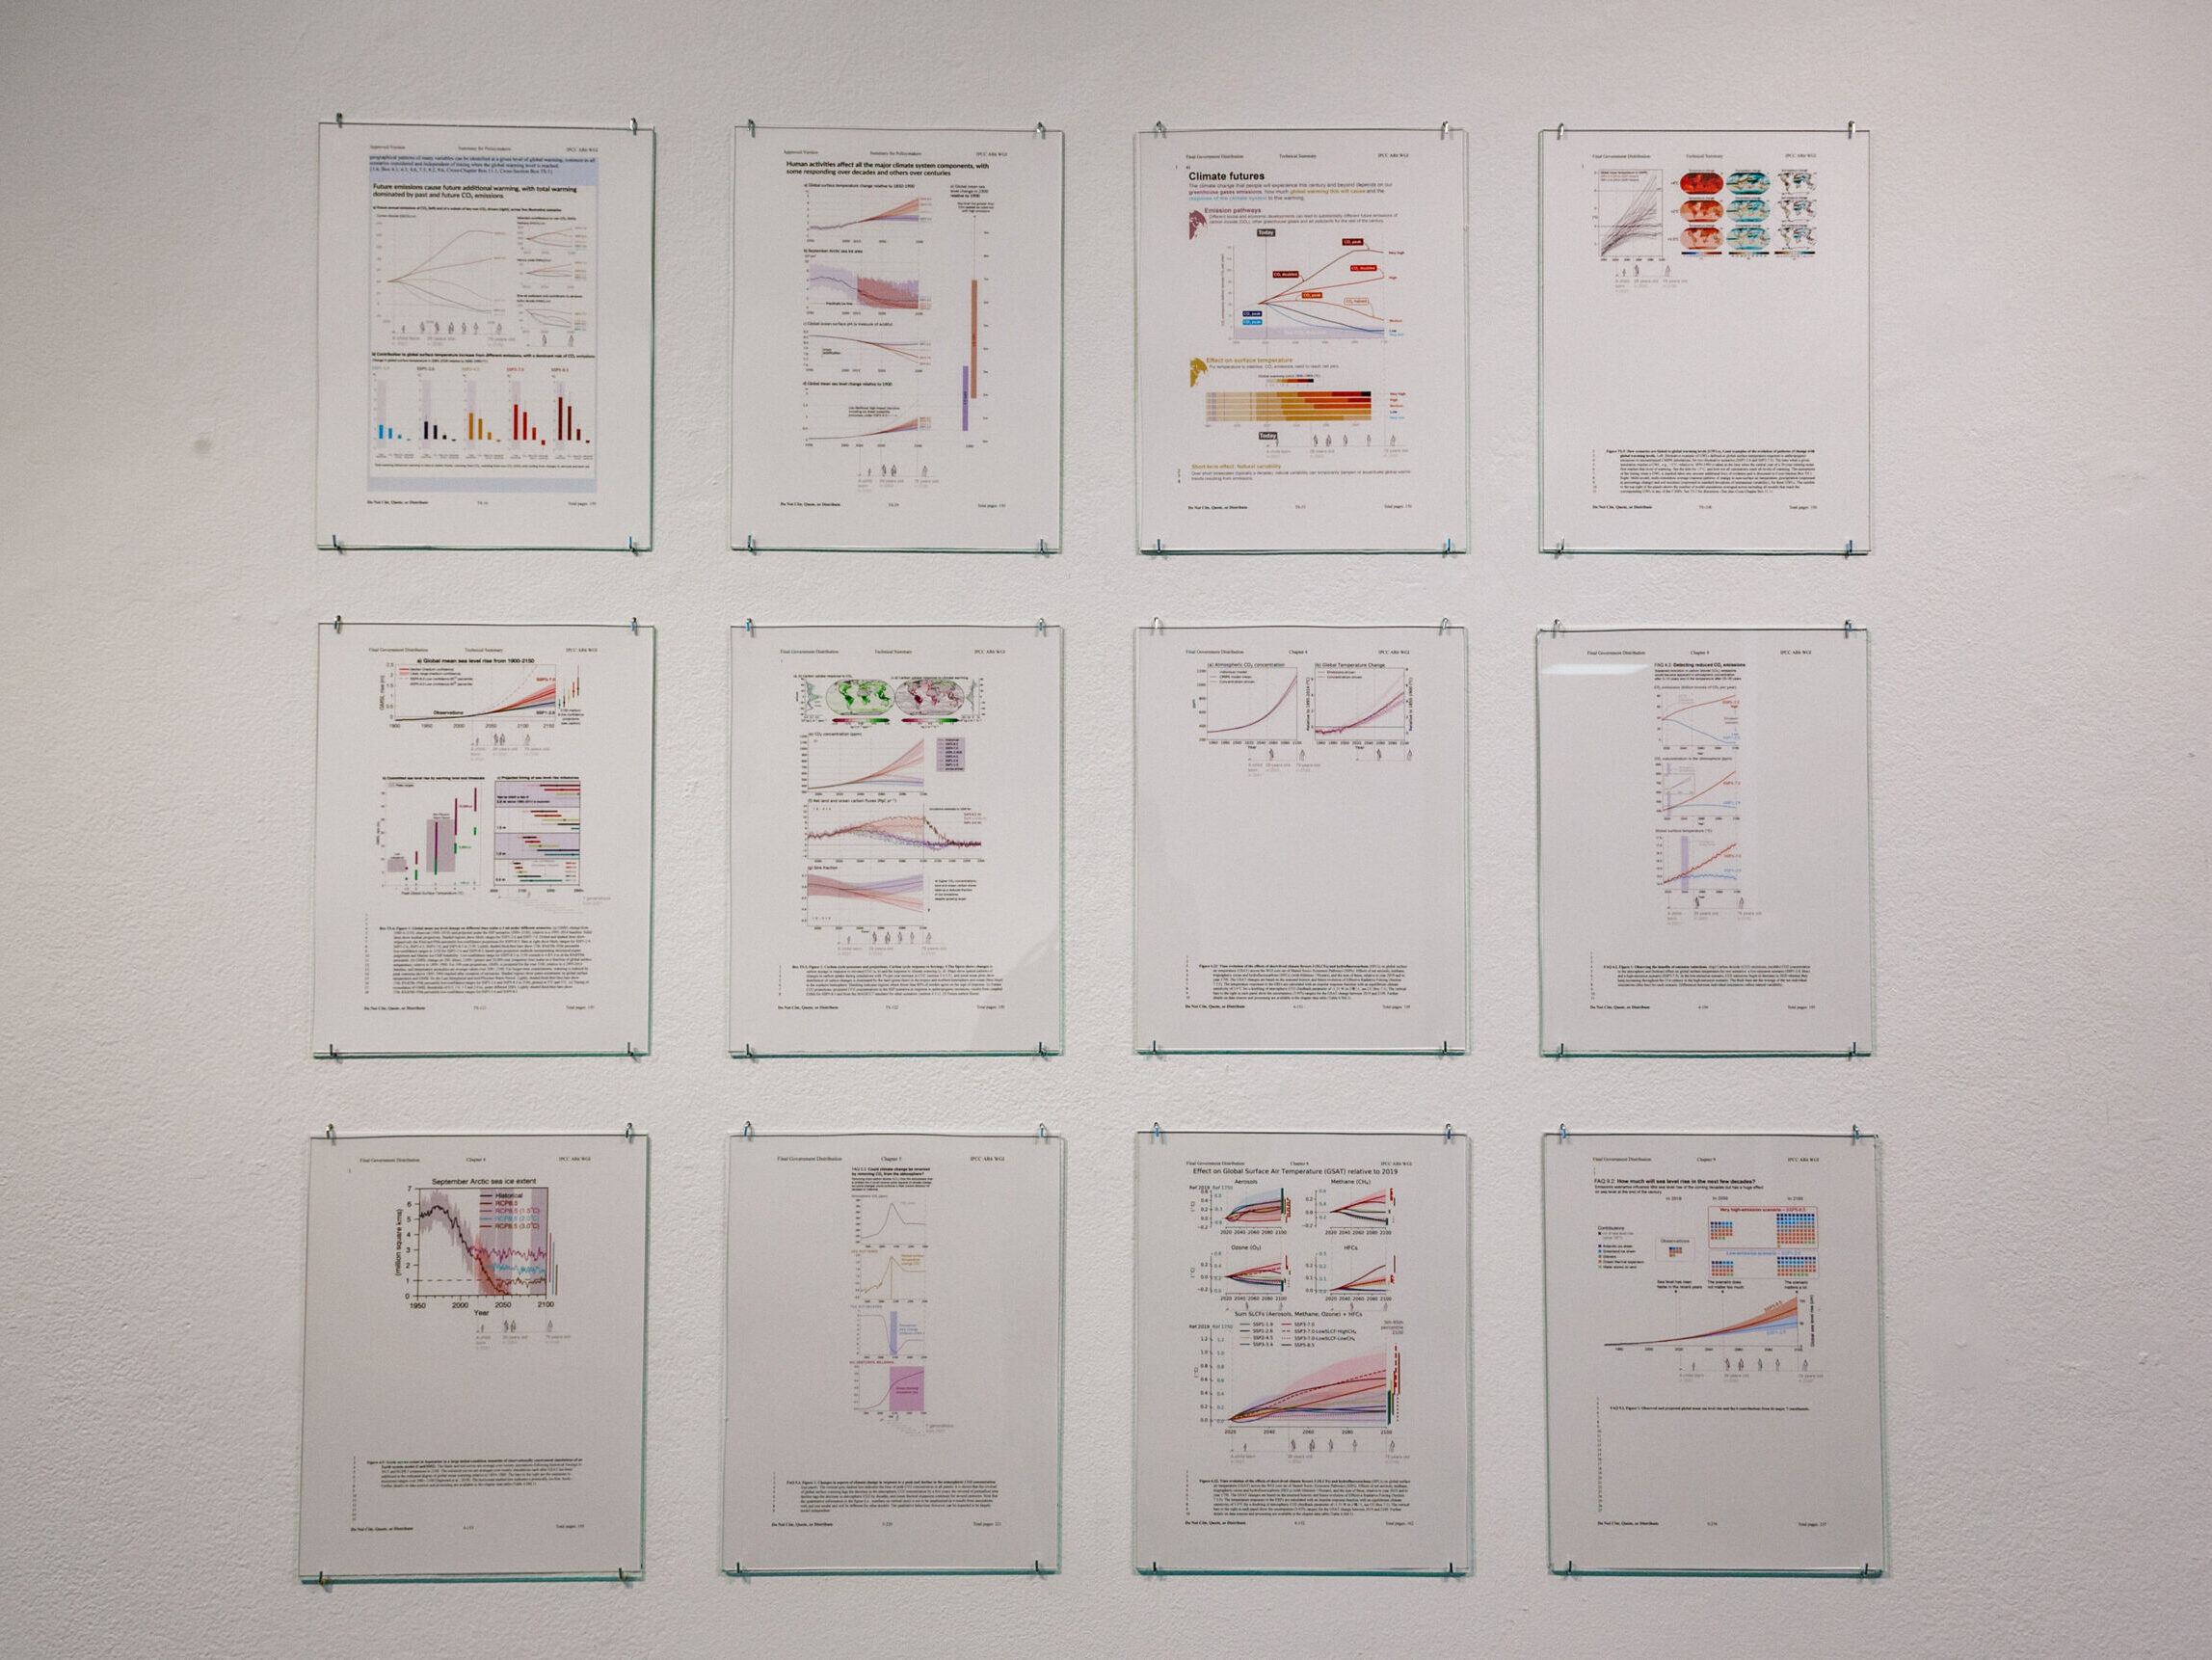
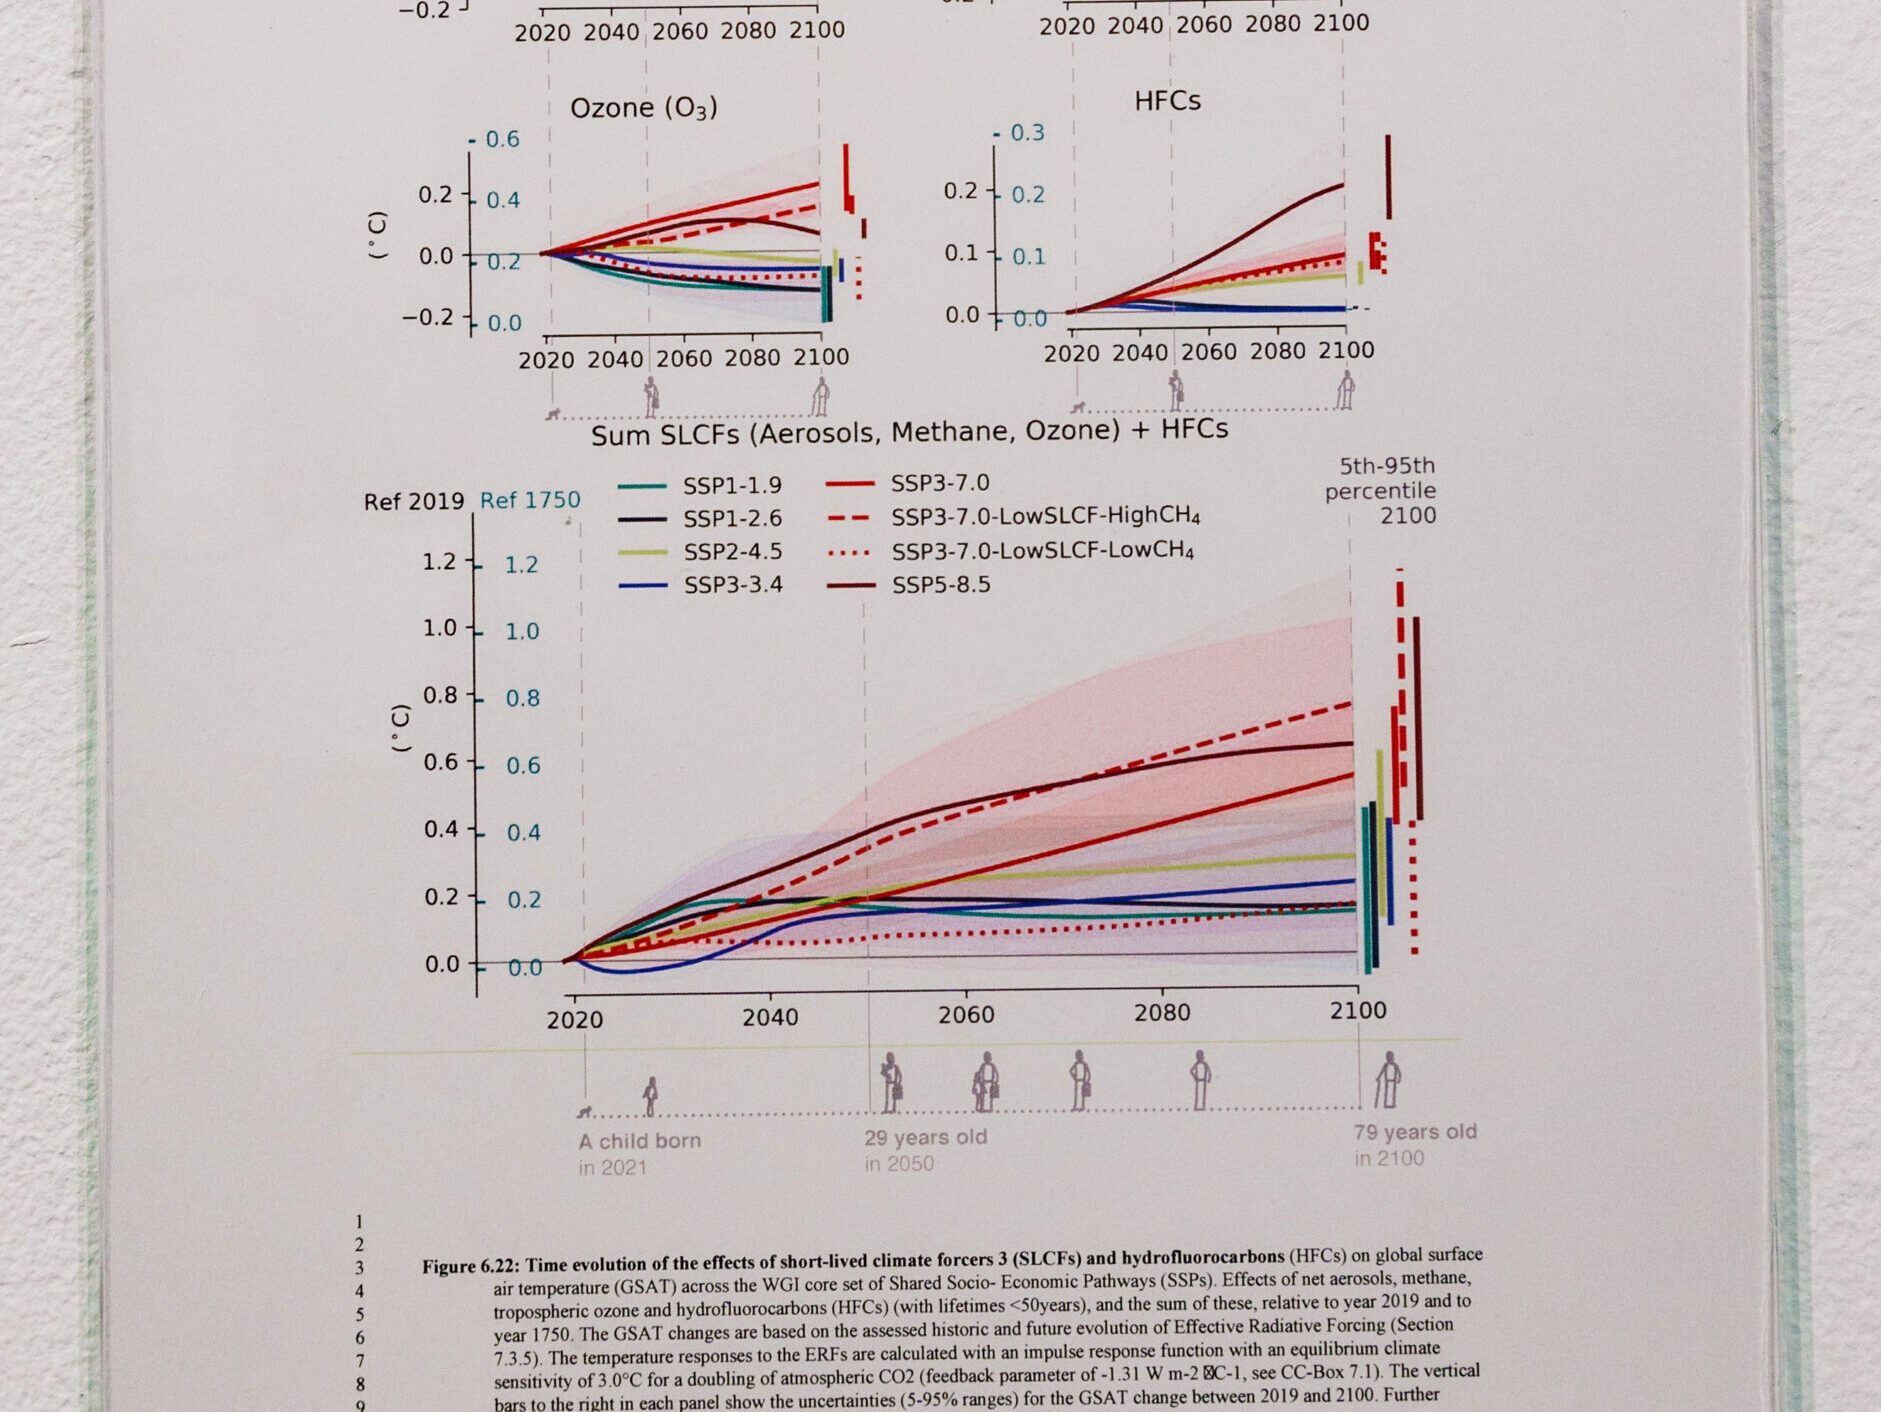
'A Child Born In...' IPCC Reports — Annotated:

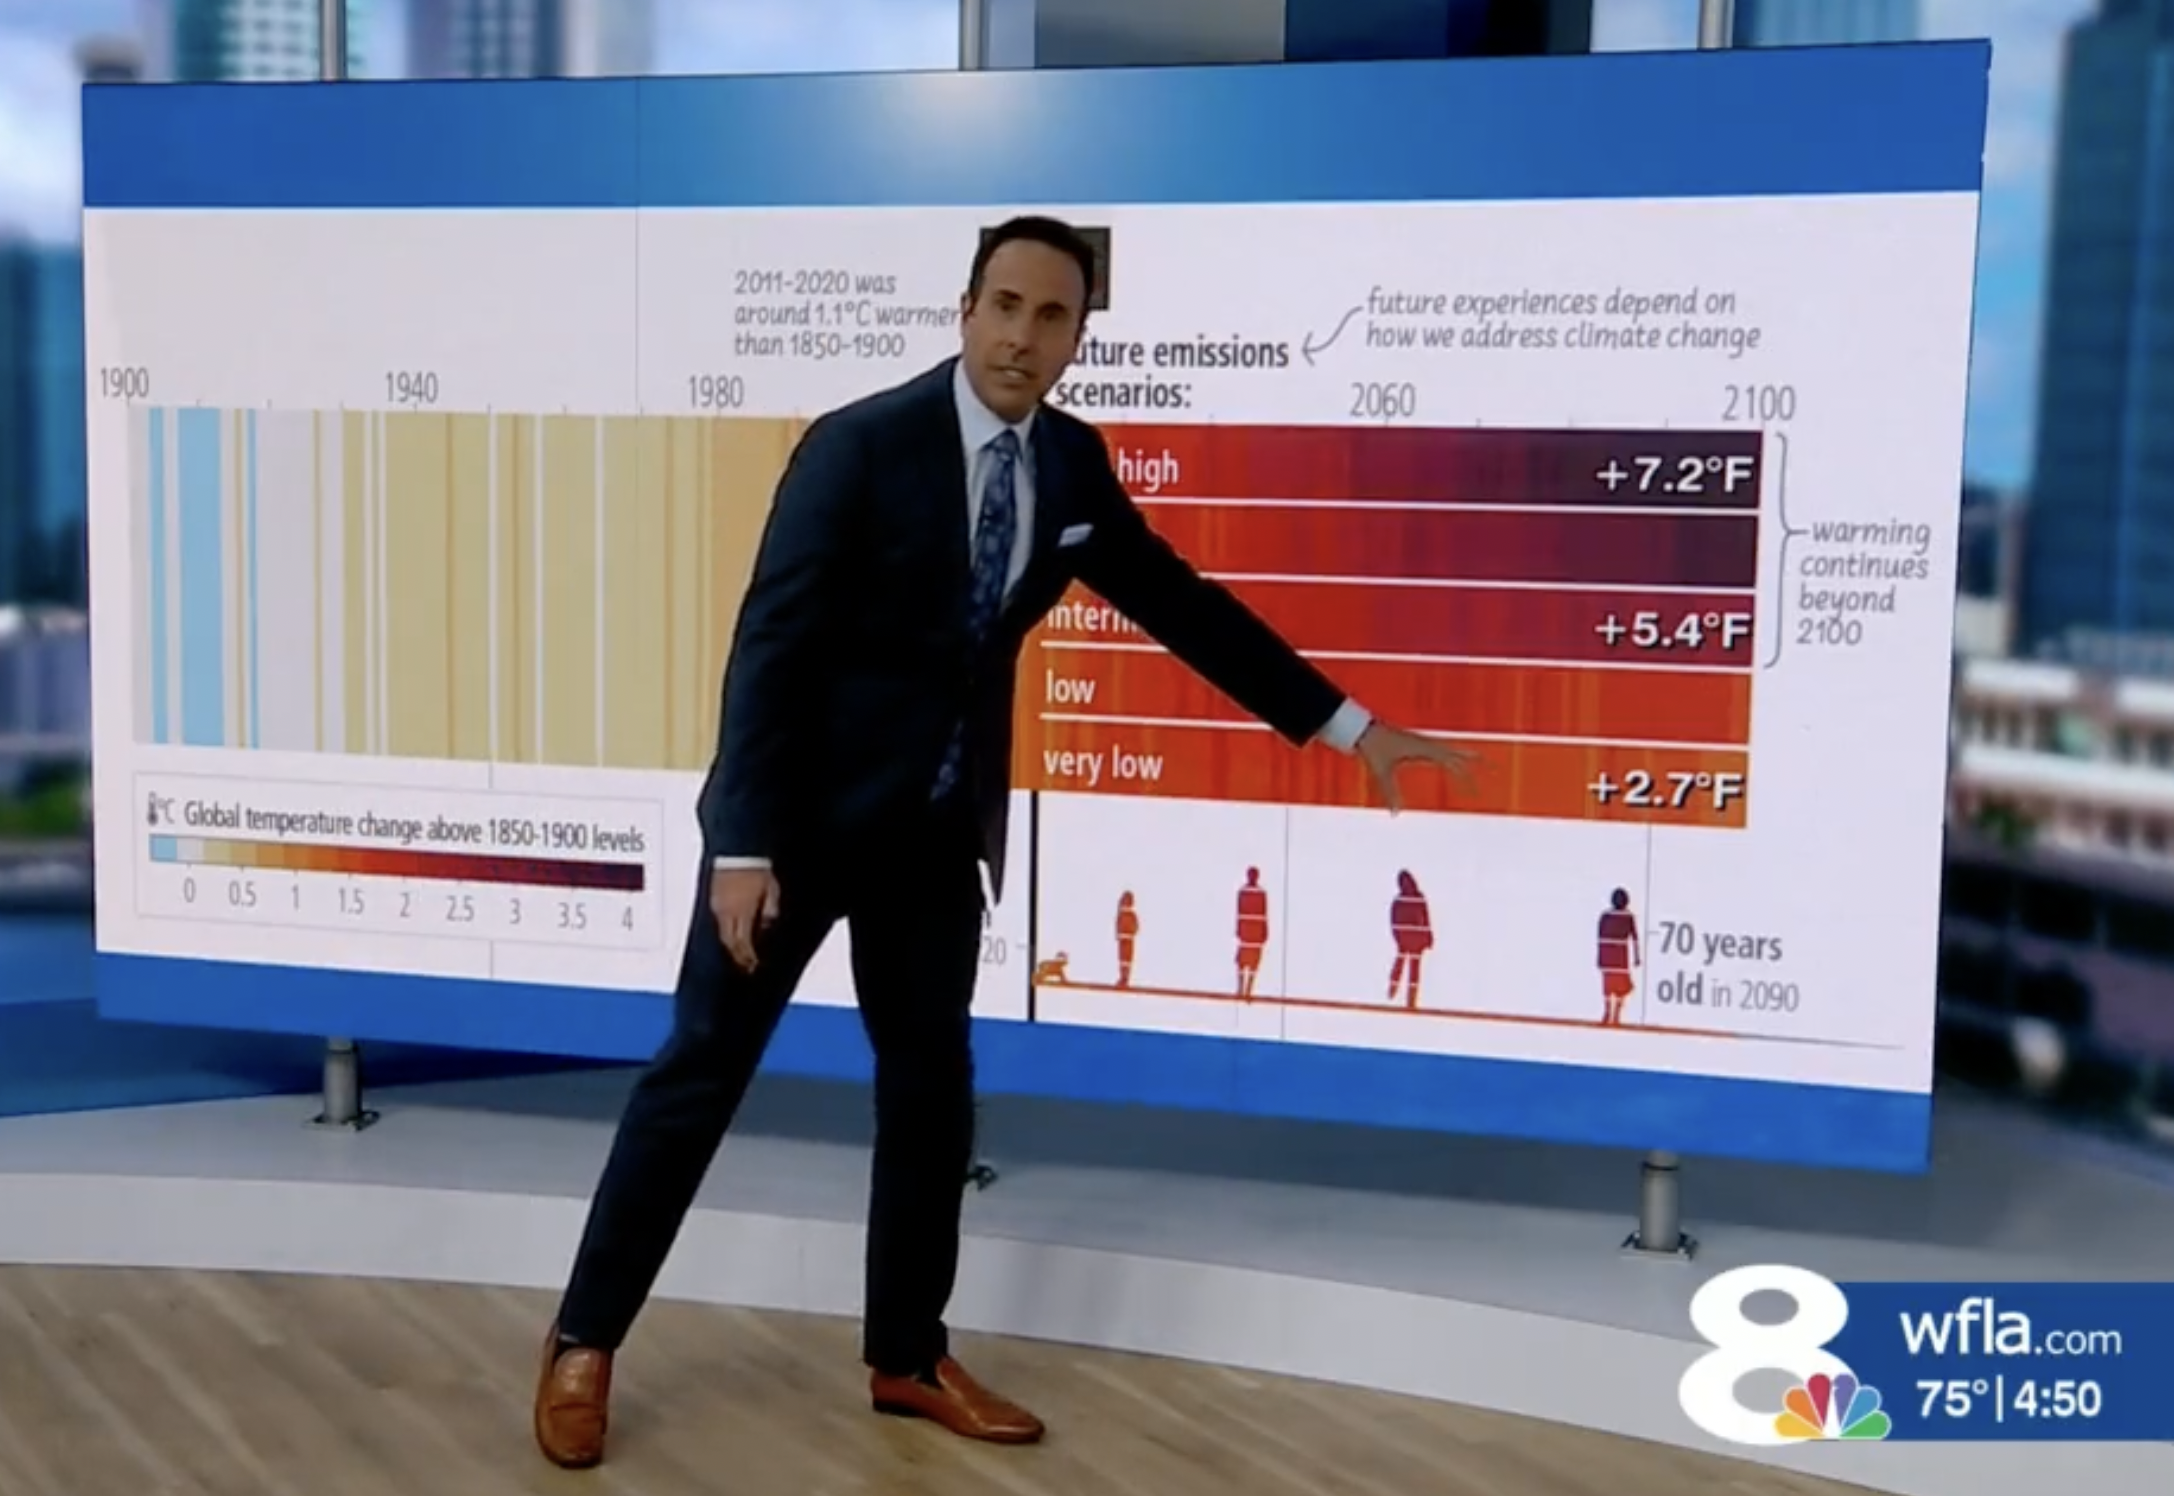
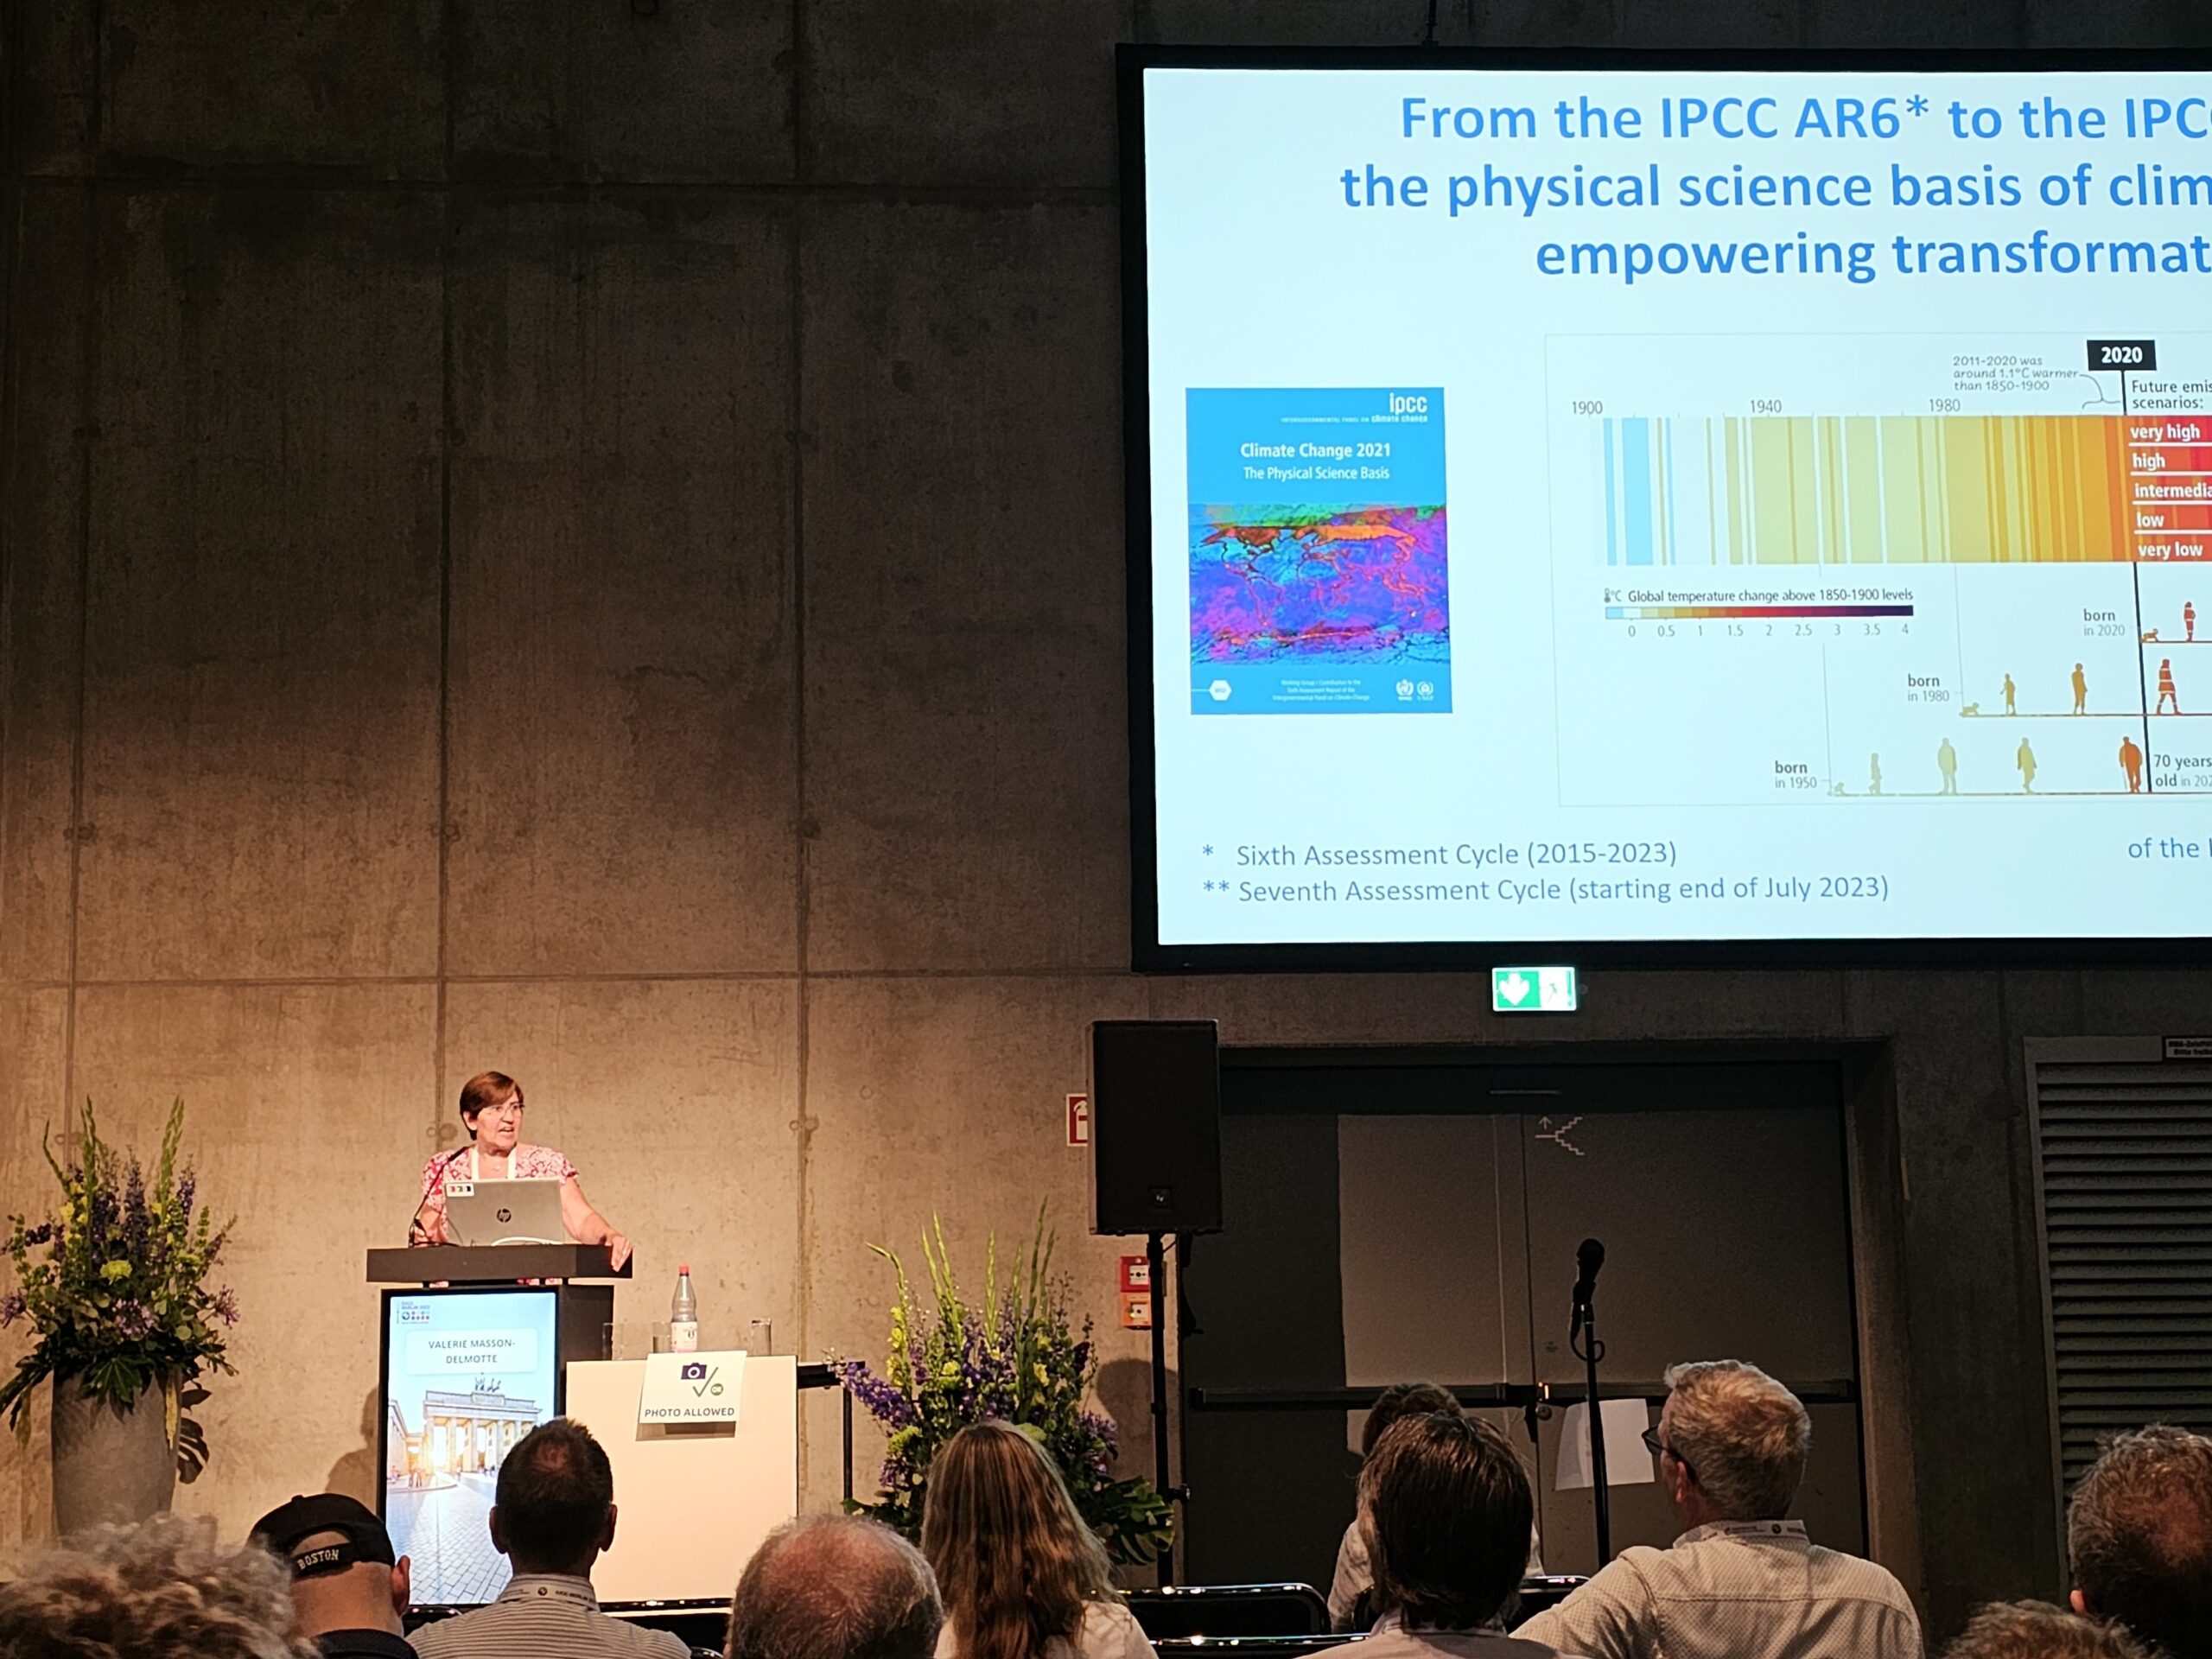
Graphs of the Working Group I contribution to the Sixth Assessment Report of the UN Intergovernmental Panel on Climate Change (IPCC) have been annotated with human life spans — to help viewers see themselves within the data.

As well as 2 other data-related creative projects:

Exponential makes visual 15 days of exponential growth - related to COVID-19, and Draw the Line, which sources data from a Life Cycle Assessment to show environmental consequences of pencil production.

2023

As Graphics Officer for the 2023 Synthesis Report, Arlene led the development of figures in the report - in collaboration with 60+ climate scientists from around the world, and with input and approval by 195 governments. 

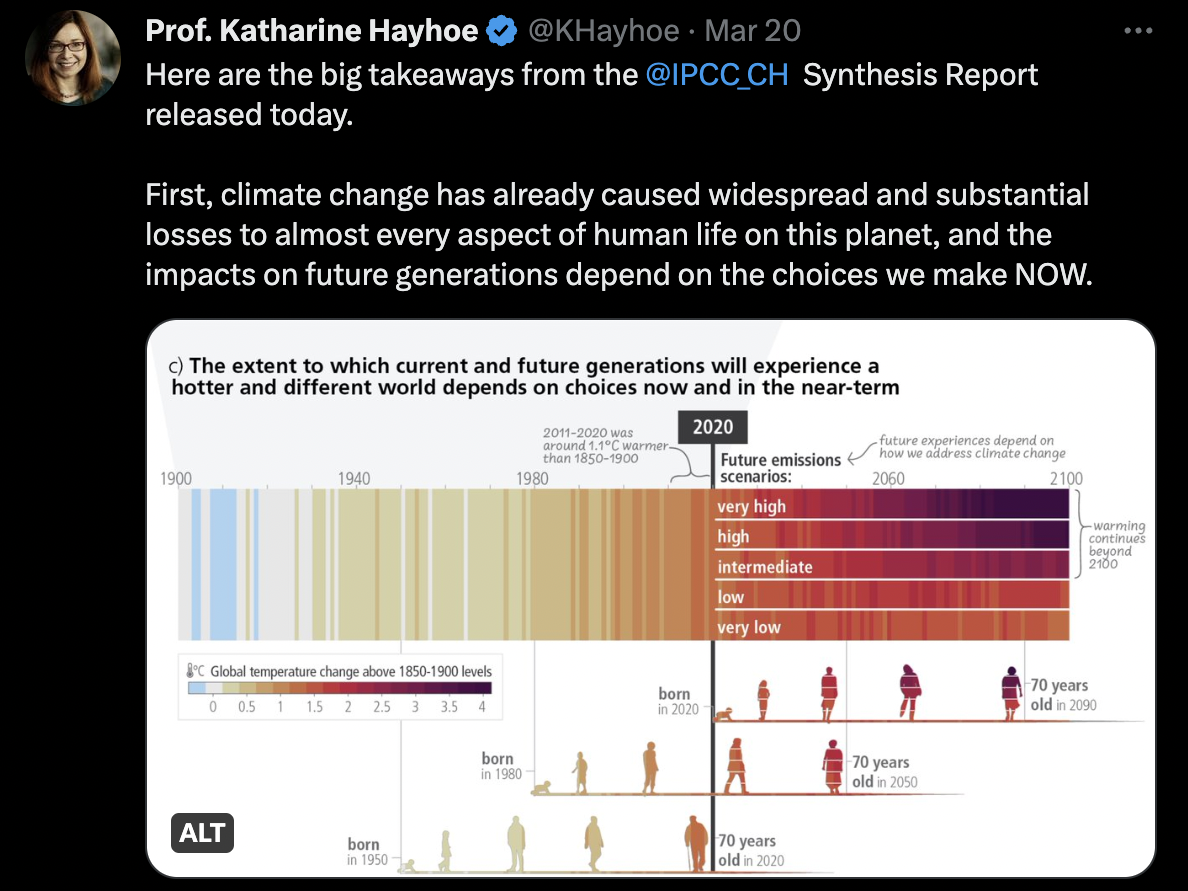
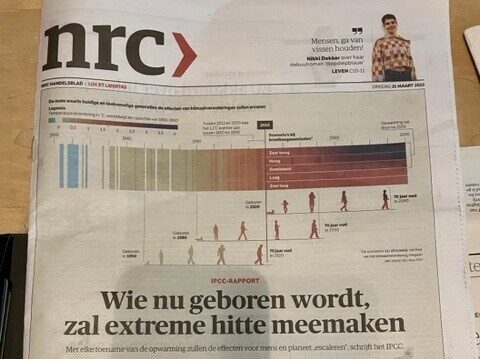
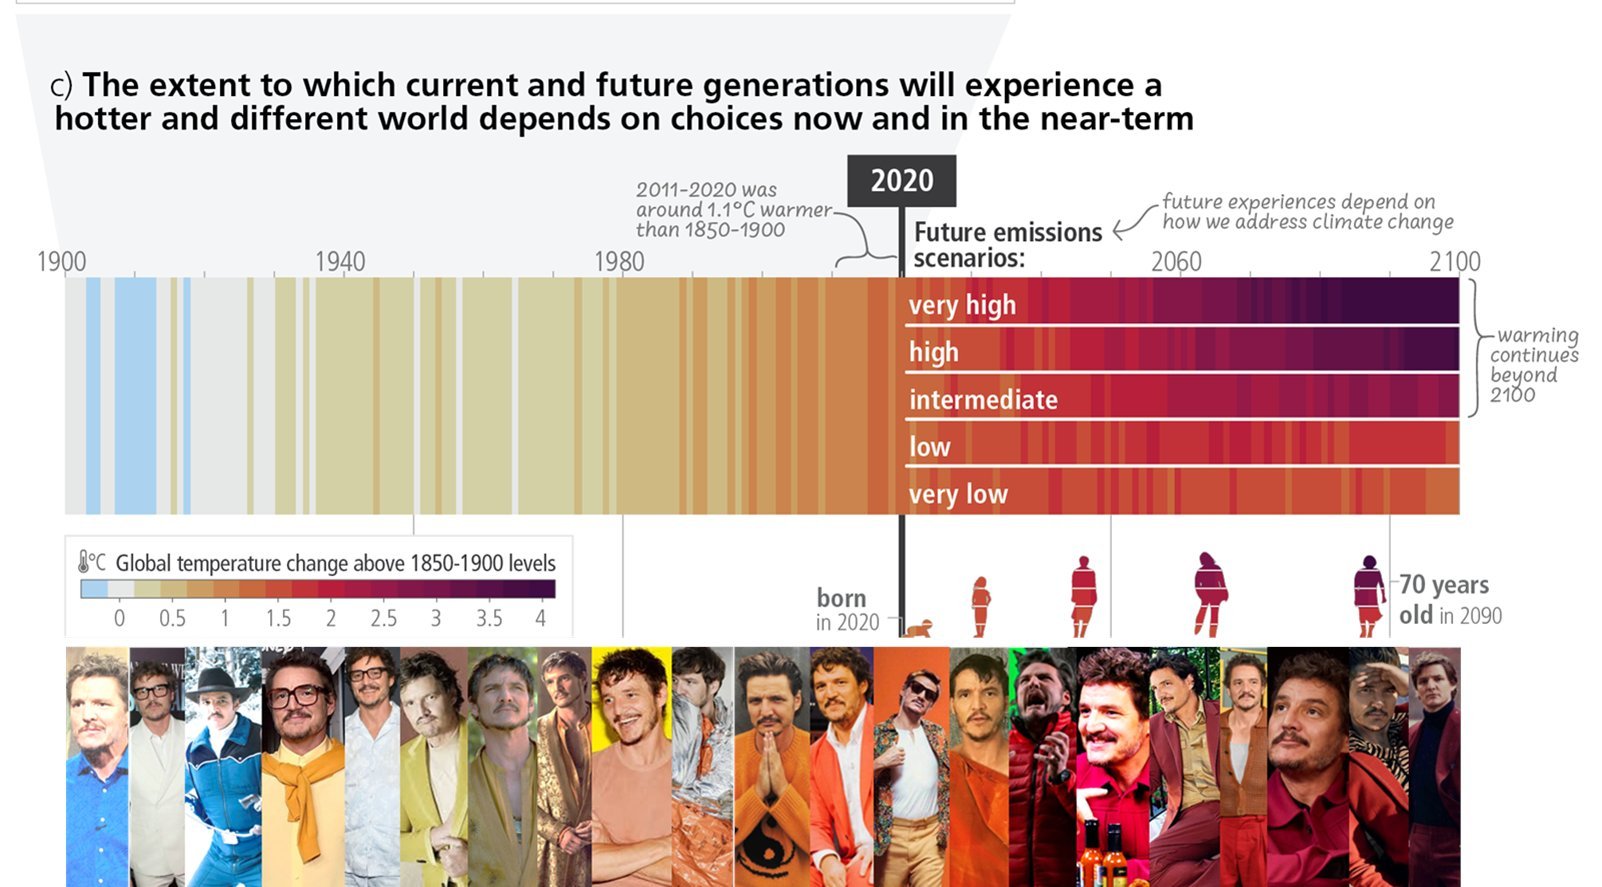
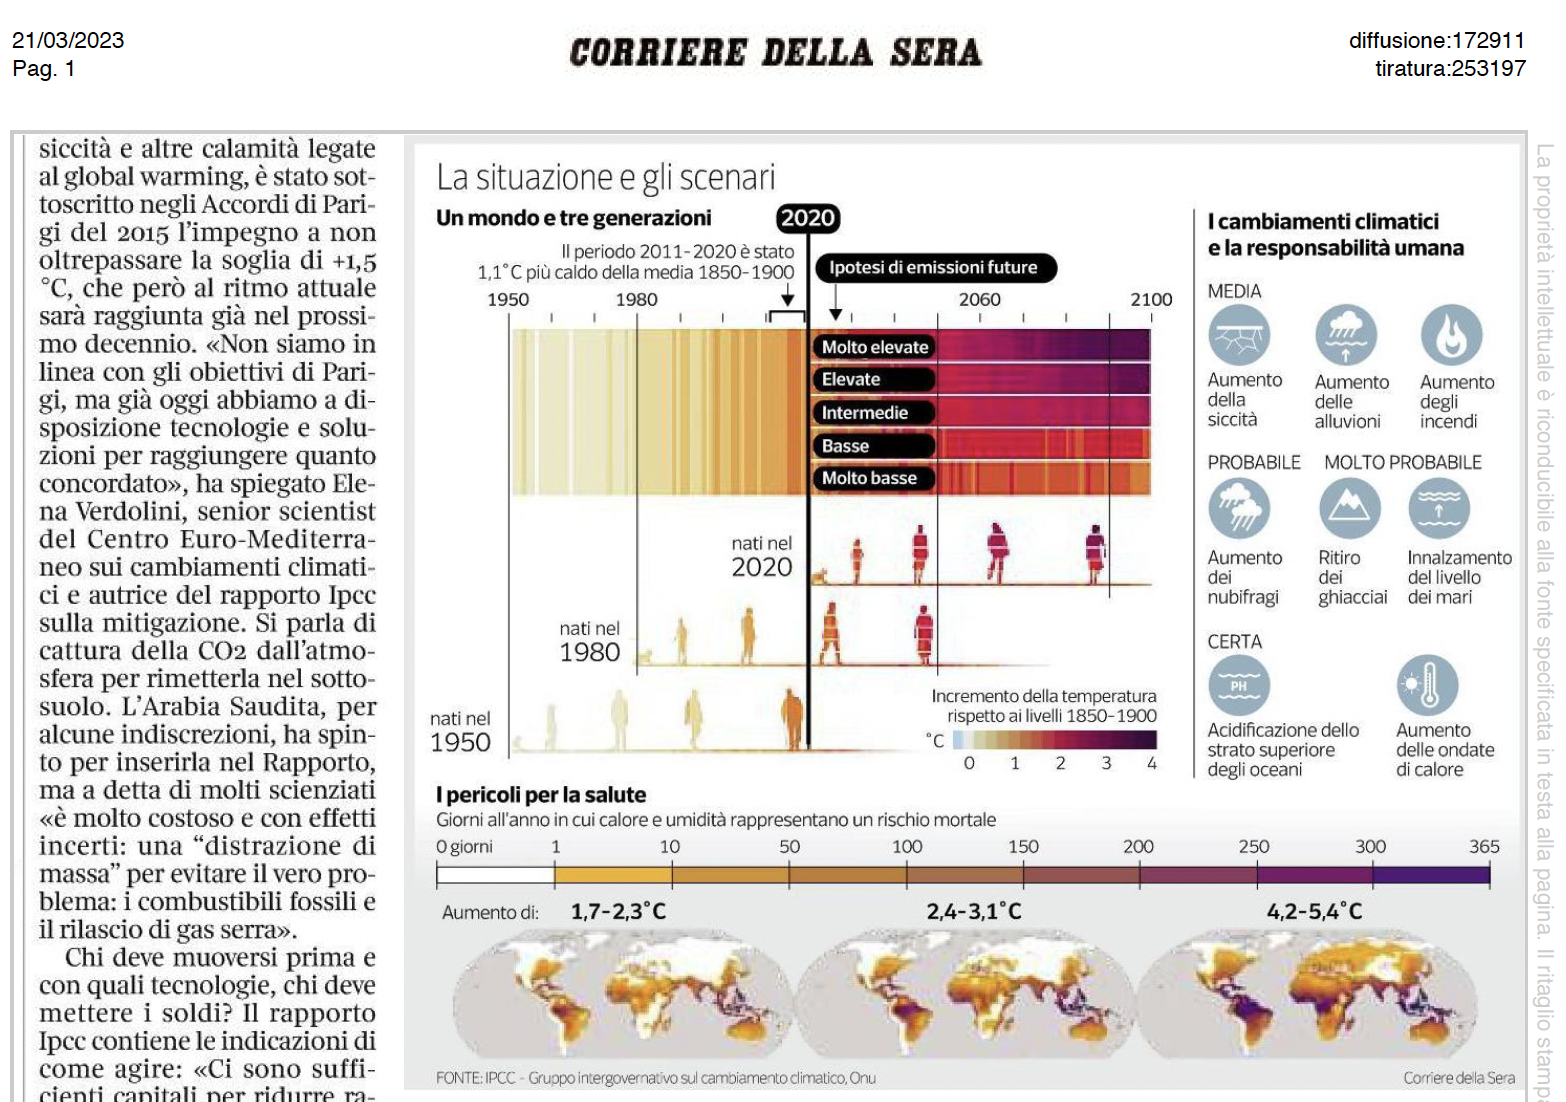
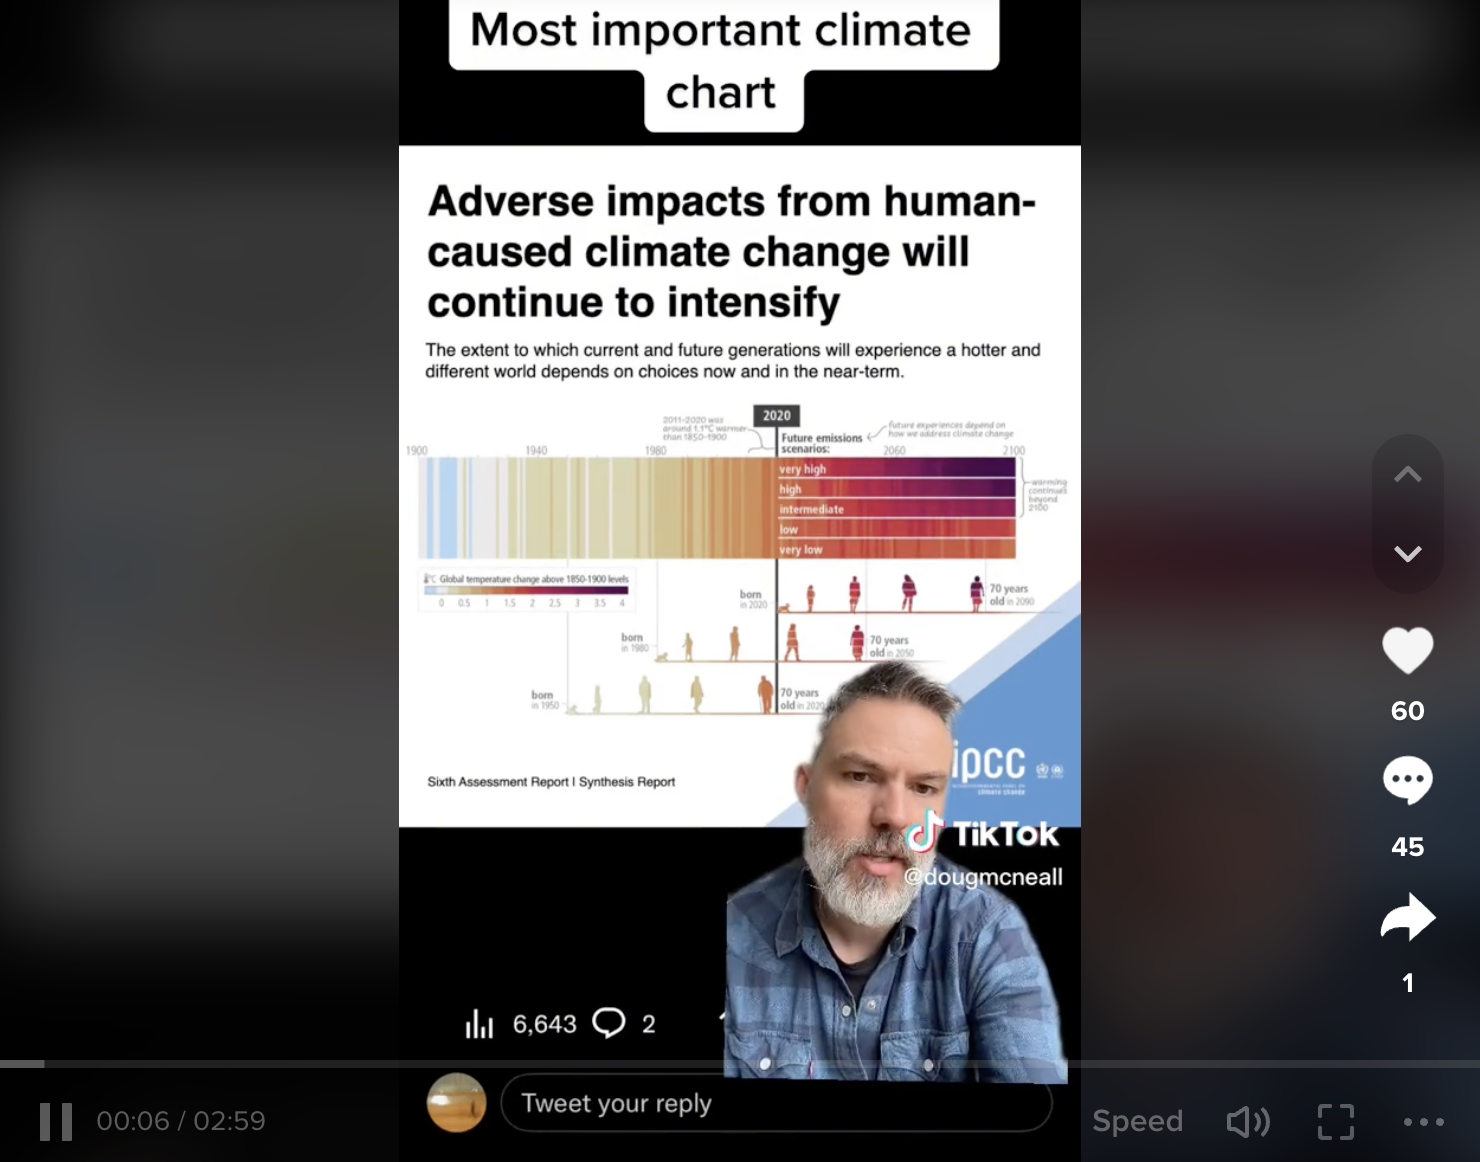
Arlene proposed and designed illustrations of human generations and combined them with climate stripes as part of the first figure of this IPCC report. The resulting graphic (Figure SPM1, panel c) was embraced by global news media, and picked up by numerous media around the world. "The one UN report climate graphic you need to see" by Axios media, and "the climate figure everyone is talking about" by Climatica. The figure powerfully communicates the idea that climate change will affect generations in an emotional way – particularly for those with children in their lives. It also inspired commentary, memes, and spin-off graphics.

Click above to play the video

“It's critical that we put climate data into a human context: to help us see ourselves within the information," said Birt.

While the visual reminder of human generations could have been overlaid atop many figures in the report, Birt found the combination of current and future generations atop basic temperatures would be most relevant and placed the element near the beginning of the report.

This figure was brought to life with the already well-known climate stripes by climate scientist Ed Hawkins. "The climate stripes make this even more emotionally powerful," said Birt. SPM1, panel c was developed in collaboration with scientists from IPCC Synthesis Report, and Ed Hawkins, to incorporate climate stripes. NASA climate scientist Alex Ruane helped to coordinate the science team across the 3 panels of figure SPM1. Alex Radtke inspired colors to extend the warming stripes into future projections. 

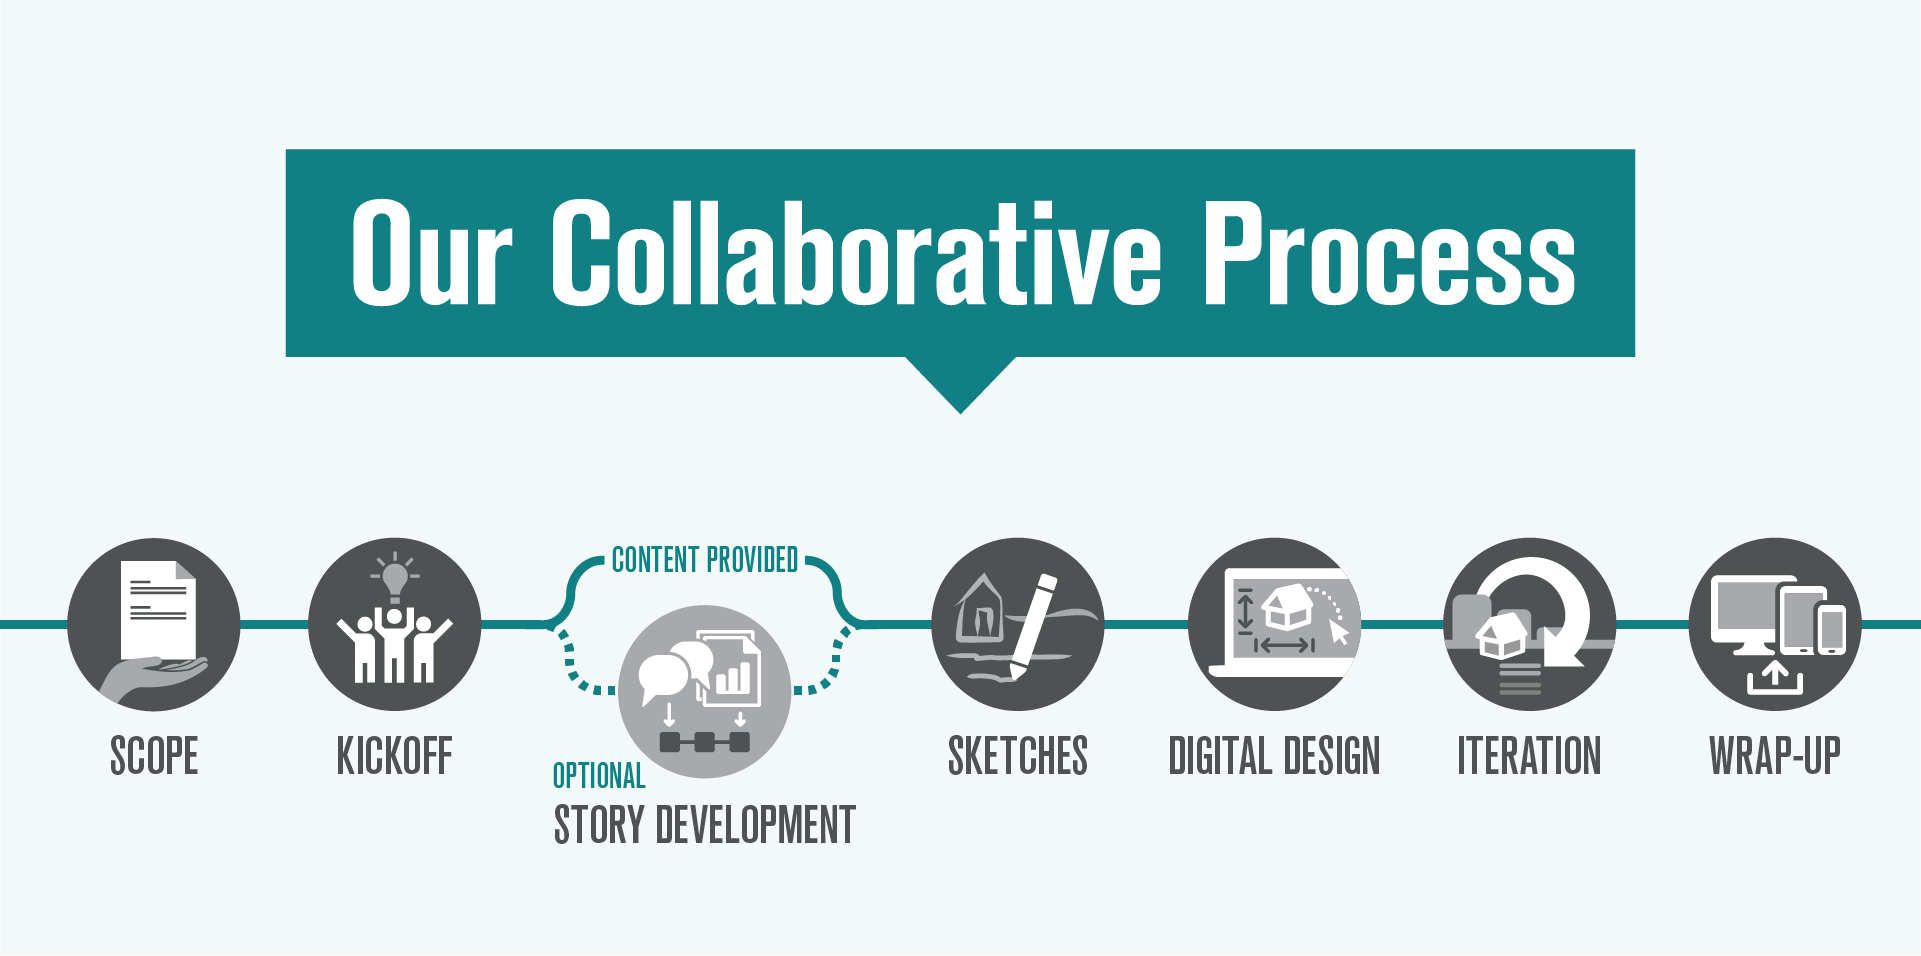
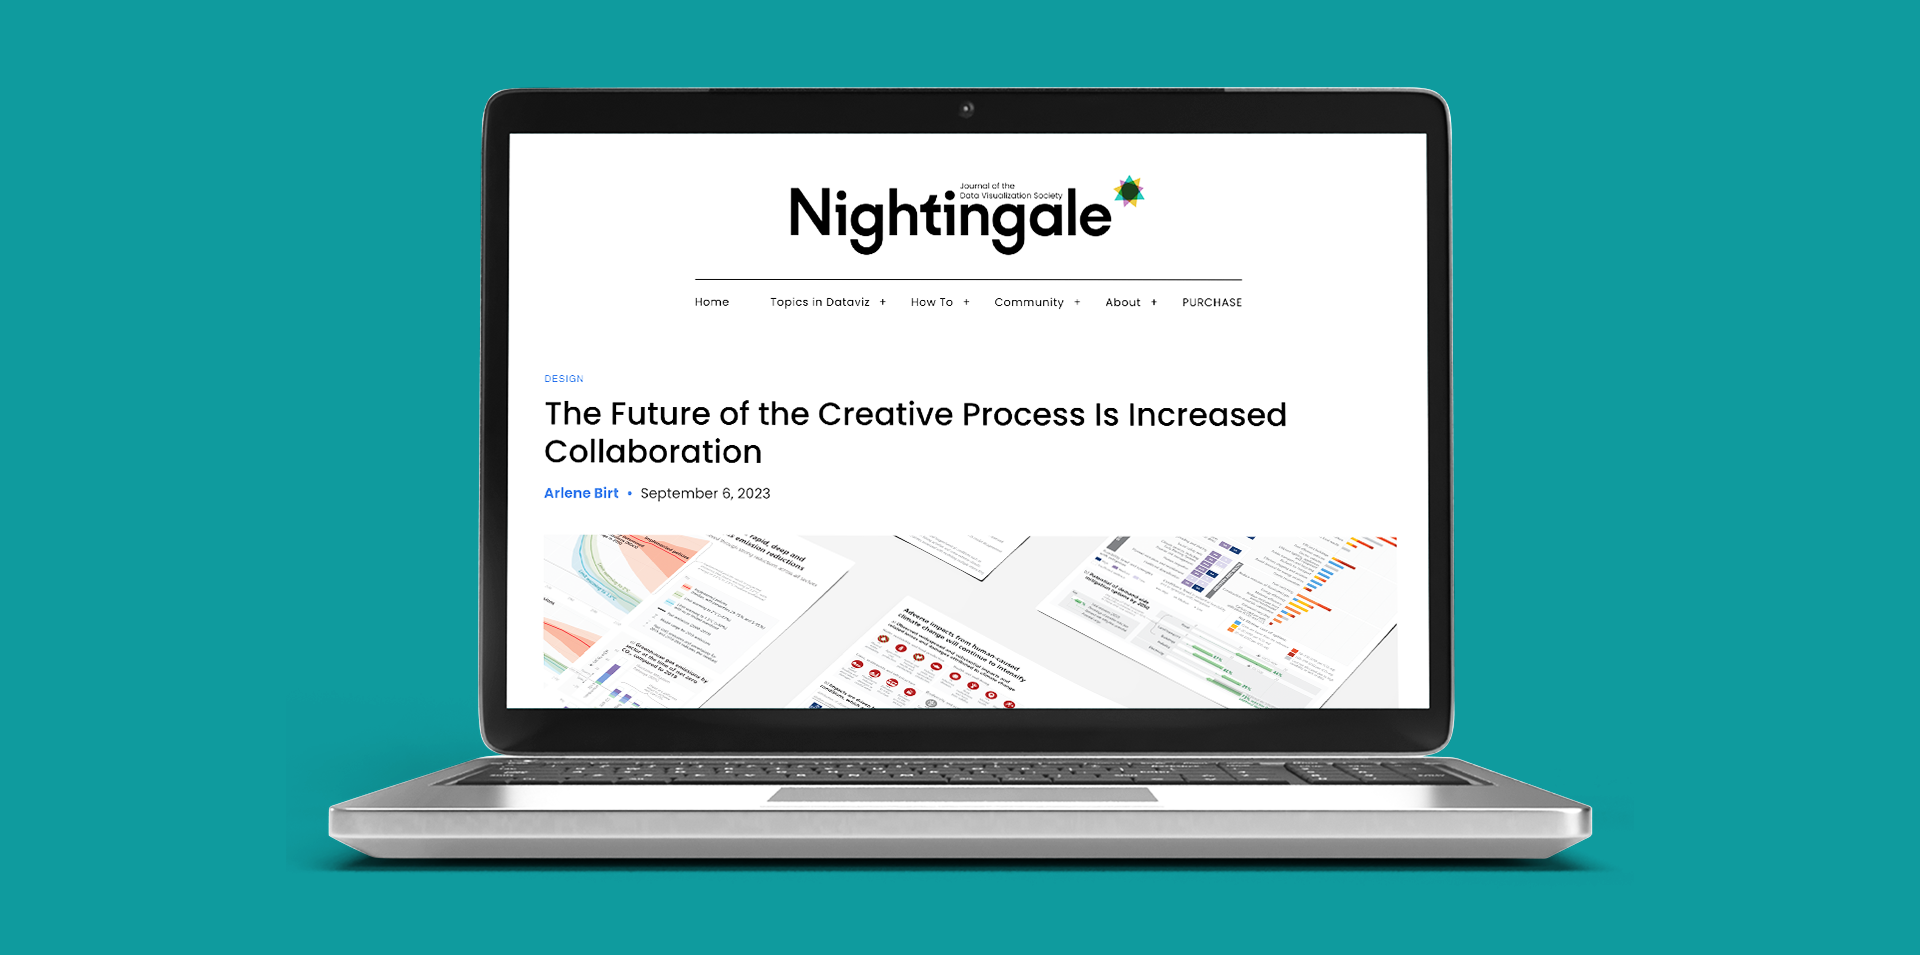
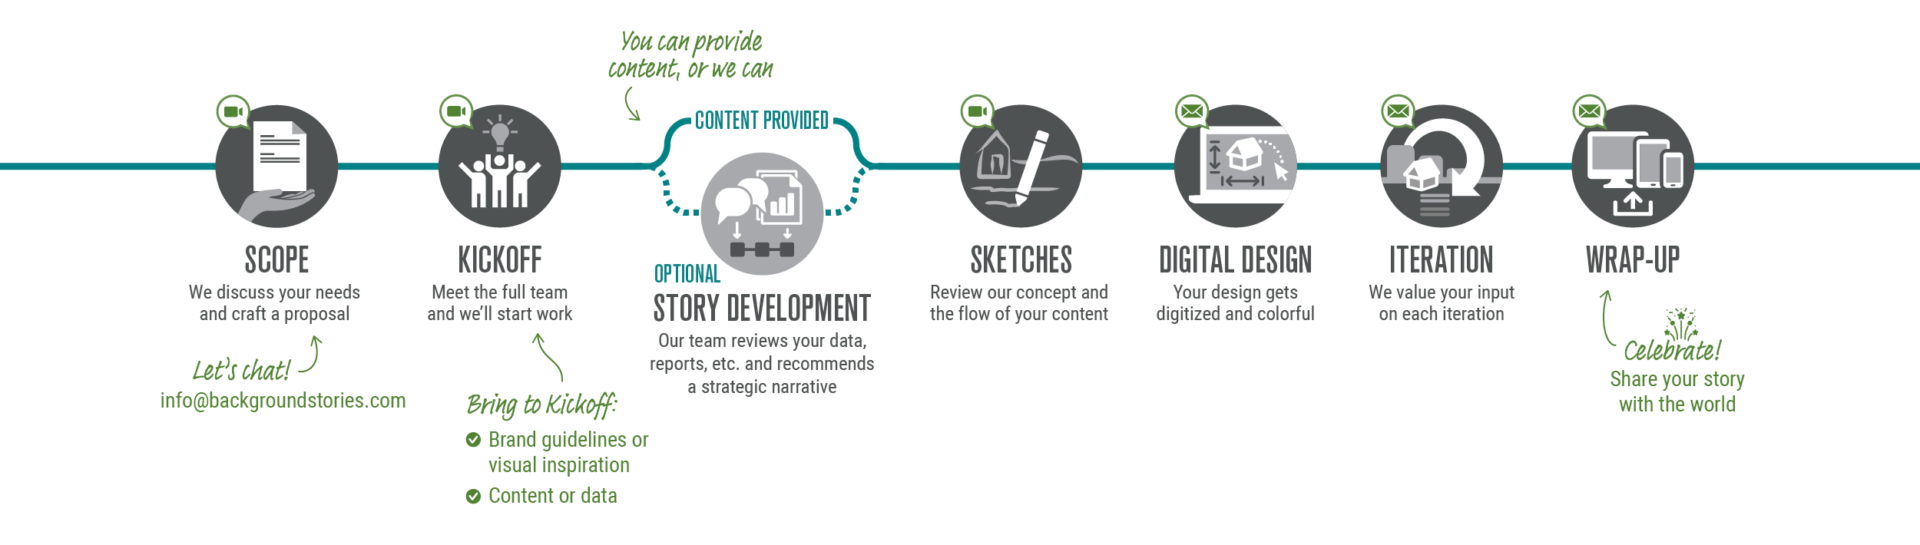
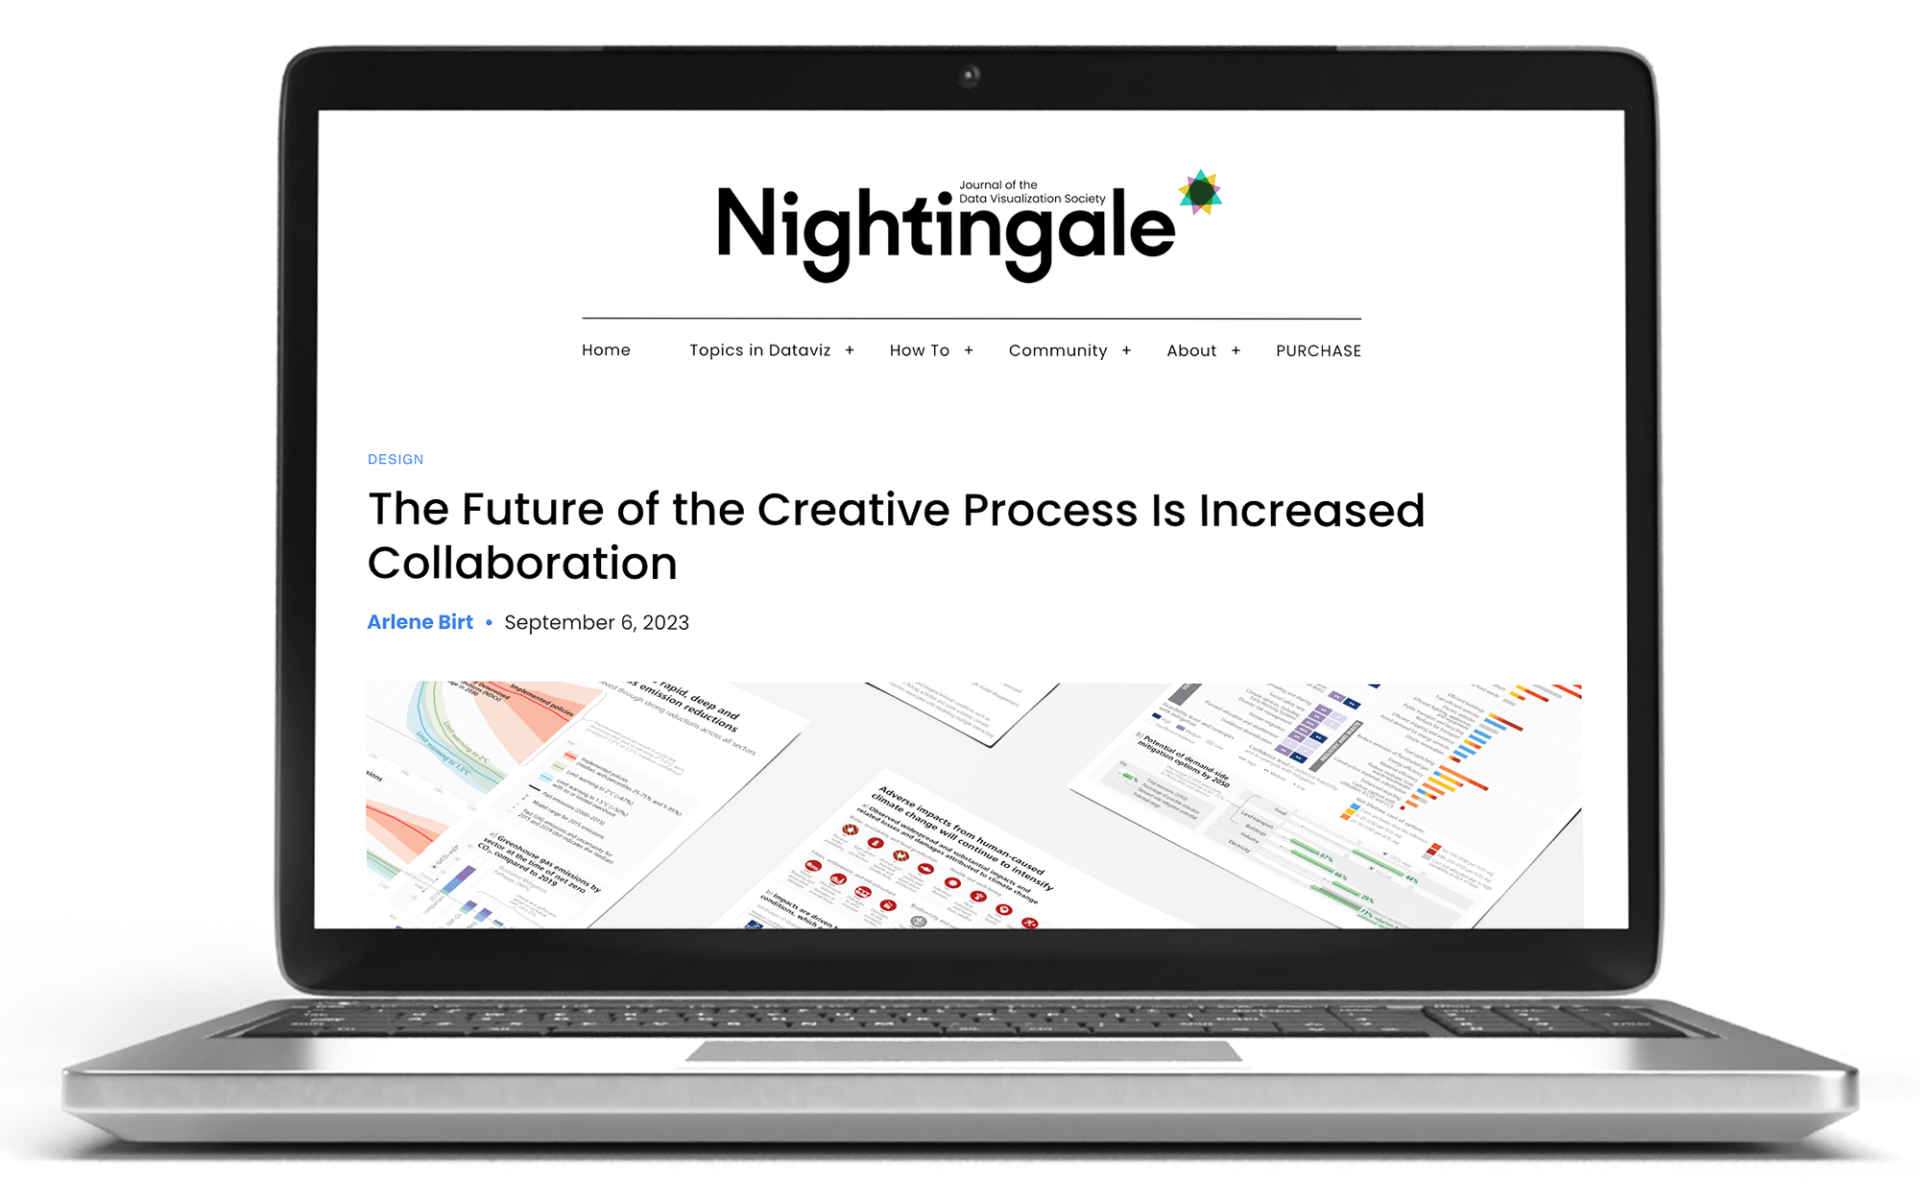
MORE DETAILS ON THE LARGE-SCALE COLLABORATIVE PROCESS BEHIND IPCC FIGURES ARE OUTLINED IN THIS ARTICLE.

2024

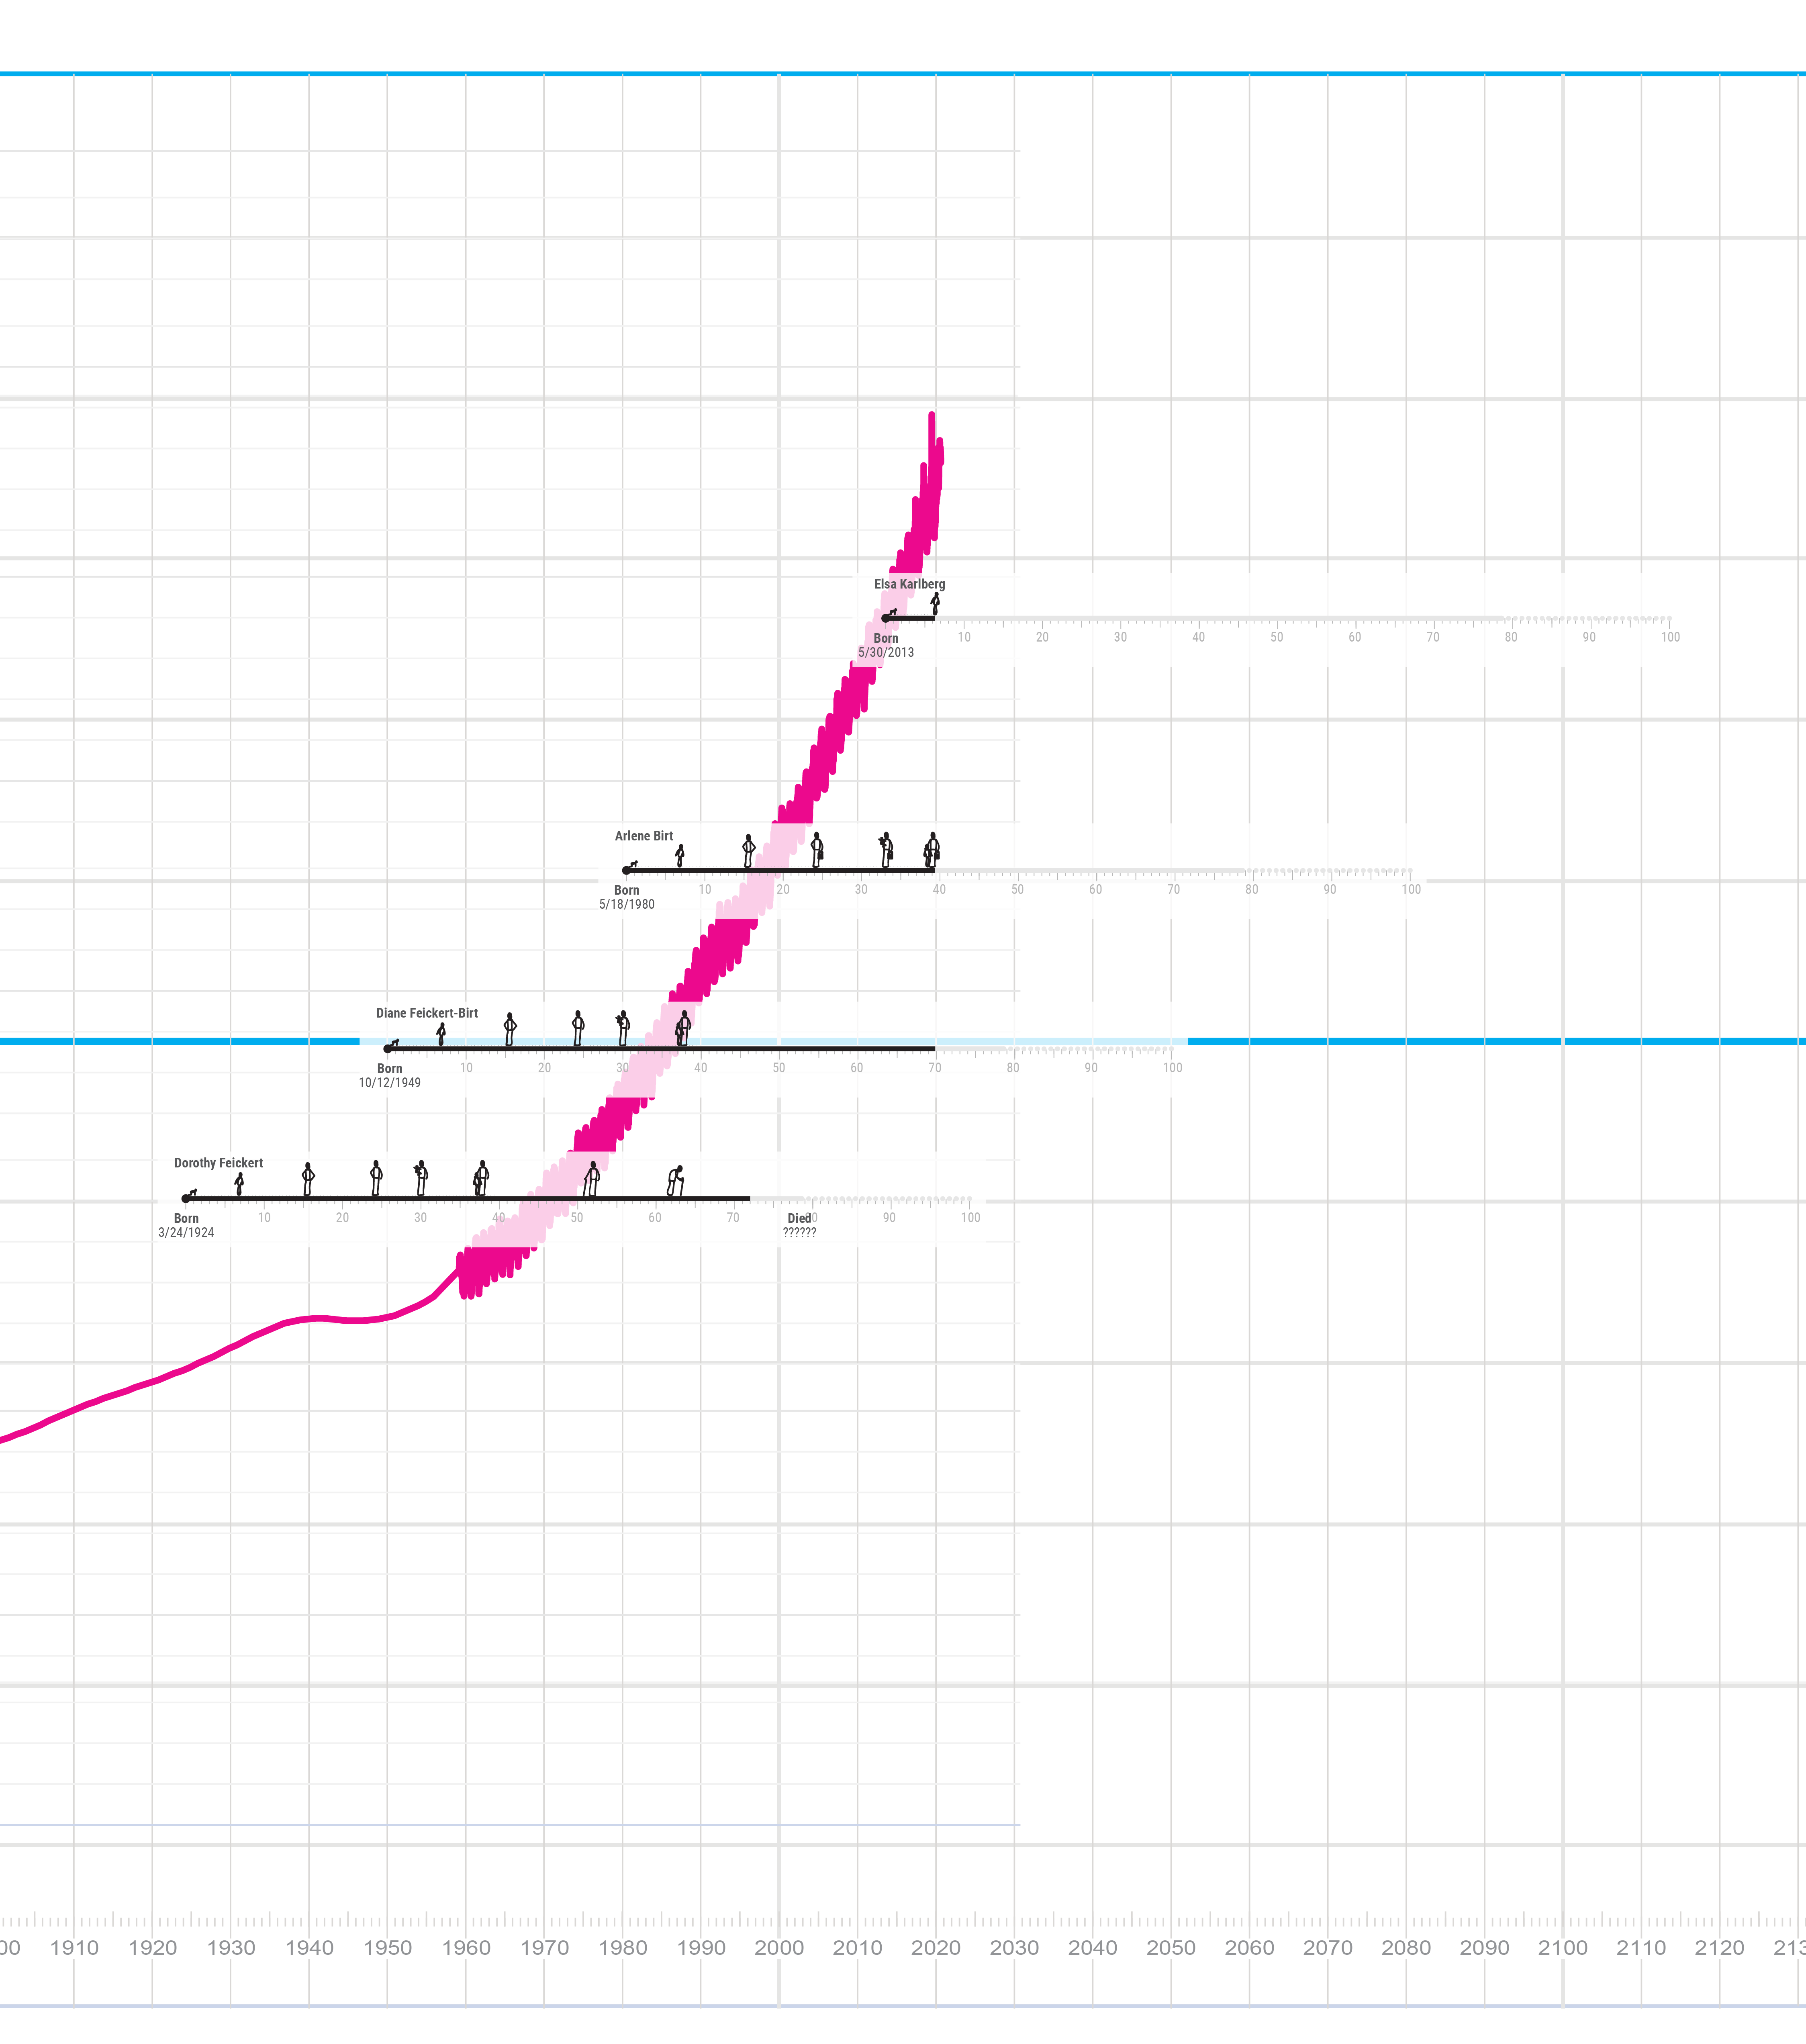
NASA, in collaboration with Arlene Birt and Ed Hawkins, develops a tool that enables visitors to generate their own climate legacies: using both human lifespan and climate stripes. With this interactive digital tool, visitors can input multiple people's names and birth years, and select silhouettes to represent each person at various ages. The tool generates graphics that include the lifespans based on this information and visitors can also select between 2 visual formats: one that aligns with the IPCC figure, and another that focuses on the individual lifespans, condensing the timeline.

Map YOUR family's climate legacy

Recent Blog Posts

BgStories_2023Wrapped_IntroVideo_6edited-ezgif.com-video-to-gif-converter

Happy 2024!

We're excited for another year of creating visuals people ‘get’ at a glance. Looking back at 2023, we’re really proud of the work we’ve done...
Read More

Path to a Successful Visual Story

A step-by-step guide to our collaborative process Visual storytelling is a powerful tool to help people understand and engage deeply with complex information. Whether developing...
Read More
Nightingale_mockup_thumbnail

The Future of the Creative Process Is Increased Collaboration

Our founder/creative director, Arlene Birt, collaborated with more than 60 scientists on data visualizations for the Intergovernmental Panel on Climate Change (IPCC) climate report. She...
Read More

Happy 2024!

We're excited for another year of creating visuals people ‘get’ at a glance.

Looking back at 2023, we’re really proud of the work we’ve done — thanks to our amazing partners.

Recent Blog Posts

NASA climate legacies interactive tool to create climate generations

Create your Own Climate Generation Visual

Map your family's climate legacy We're excited that a UN Intergovernmental IPCC figure designed by our creative director has been adapted into a customizable digital...
Read More

Path to a Successful Visual Story

A step-by-step guide to our collaborative process Visual storytelling is a powerful tool to help people understand and engage deeply with complex information. Whether developing...
Read More
Nightingale_mockup_thumbnail

The Future of the Creative Process Is Increased Collaboration

Our founder/creative director, Arlene Birt, collaborated with more than 60 scientists on data visualizations for the Intergovernmental Panel on Climate Change (IPCC) climate report. She...
Read More

Path to a Successful Visual Story

Diagram showing steps of the Background Stories collaborative process. Steps are labelled Scope, Kickoff, Story Development, Sketches, Digital Design, Iteration, Wrap-up

A step-by-step guide to our collaborative process

Visual storytelling is a powerful tool to help people understand and engage deeply with complex information.

Whether developing an infographic, printed sign, or animated video, we approach every project with a time-tested collaborative process. We can help your team benefit from the power of visual stories.

We’ve refined this process over the years to find a good balance of client-facing steps and “backstage” steps—in other words, the work we do behind the scenes.

Your Path with Background Stories

  1. Scope

  2. Kickoff

  3. Story Development (optional)

  4. Sketches

  5. Digital Design

  6. Iteration

  7. Wrap-Up

Scope

Are we ready to work together? Let’s find out!
  1. Consider these questions:

    • What is the budget?

    • What is the scope?

    • What is the deadline?

    • Do I have a refined content outline? (If not, we can help! Our capabilities include research and content development.)

    • Who will be the primary point of contact on my team?

  2. We’ll discuss these questions with you and craft a proposal specific to your needs.

  3. Review and accept that proposal to start working together.

  4. Share any relevant background materials, including existing brand guidelines and data. We like to review these ahead of the kickoff meeting.

Backstage: We assemble our design team. This includes a creative director and a designer whose skills and interests best fit the project. Typically, the designer serves as project manager and main point of contact.

Kickoff

Beginning our work together
At this initial meeting, our teams meet and the journey begins! We will chat about the details of the project, confirm the scope, and review the timeline.

  1. Consider these questions:

    • Who is my audience? (If needed, we can adapt a visual story for multiple audiences.)

    • What are my goals?

    • What key messages do I want to communicate?

    • What are my deliverables?

  2. Share any examples that inspire your team.
We are a remote-based company and are comfortable meeting virtually. We’re also available to meet in person within the Twin Cities area.
Backstage: In advance of the kickoff meeting, we review any materials you’ve provided and compile questions to help us better understand your content, audience, and objectives.

Story Development (Optional)

Finding the key messages

You can provide content to us, or we can develop content based on raw materials that you provide. When we do Story Development, we’ll share an outline and ask you to provide feedback.

If you provide content, we’ll make high-level recommendations to refine the story in a visual format and tune it to your audience.

Backstage: We research your topic and dig into the content that you have provided. With your goals in mind, we create a visually-driven story that communicates the key messages to your audience.
Graphic showing research and data turning into a refined content outline

Sketches

Confirming the flow with your team

At a meeting, we walk you through our rough sketches and invite you to share feedback. We may show different options and discuss which approach best fits aspects that you want to showcase.

If developing the “look and feel” (visual style) is part of the project scope, we'll propose color schemes, fonts, and/or illustration styles.

Backstage: Using the content outline as a guide, we develop a rough sketch that uses visuals to communicate your message. The primary designer leads hands-on design work, while the creative director provides guidance.
Graphic showing a refined content outline turning into a rough sketch

Digital Design

Your story comes to life

We share a first draft with you via email and ask for your feedback.

Backstage: We turn the sketched concepts into refined deliverables using color, typography, and illustration.
Graphic showing a rough sketch turning into a digital design with full color and illustration

Iteration

Collaborating to find the best solutions

The fun has begun! We send you each design iteration via email, and your team compiles feedback in response. You can contact us with questions or request a check-in meeting at any time.

Most projects include two rounds of revision and one additional round of minor tweaks. If you prefer more iterations, this can be added during the initial Scope phase.

Recommendation: If approval is needed from external team members (such as other people in the department), wait until the second design iteration to share with others. This allows us to address your early feedback in a streamlined process.

Backstage: We use your feedback to refine the design. With each iteration, we may ask specific questions or propose ideas in the email.

Wrap-Up

Share your story with the world

We send you final files, and our account manager follows up with wrap-up steps. We’d welcome your feedback on our process and will confirm whether we can share your project in our public portfolio.

If the project scope includes extra deliverables (social media graphics, slide decks, etc.), we will start developing those with a similar collaborative process.

Backstage: We prepare the final files according to your needs and the project scope. Usually, this means a PDF or image file that you can easily share with your audience.
Graphic showing a finished infographic and additional deliverables like social media graphics and a physical mailer

Ready to get started?

Recent Blog Posts

NASA climate legacies interactive tool to create climate generations

Create your Own Climate Generation Visual

Map your family's climate legacy We're excited that a UN Intergovernmental IPCC figure designed by our creative director has been adapted into a customizable digital...
Read More
BgStories_2023Wrapped_IntroVideo_6edited-ezgif.com-video-to-gif-converter

Happy 2024!

We're excited for another year of creating visuals people ‘get’ at a glance. Looking back at 2023, we’re really proud of the work we’ve done...
Read More
Nightingale_mockup_thumbnail

The Future of the Creative Process Is Increased Collaboration

Our founder/creative director, Arlene Birt, collaborated with more than 60 scientists on data visualizations for the Intergovernmental Panel on Climate Change (IPCC) climate report. She...
Read More

The Future of the Creative Process Is Increased Collaboration

Our founder/creative director, Arlene Birt, collaborated with more than 60 scientists on data visualizations for the Intergovernmental Panel on Climate Change (IPCC) climate report. She shares her key lessons in a recent article published by Nightingale.

Laptop with Nightingale article on the screen

"With growing focus on pairing creativity with technical fields — like science, technology, and policy — and because the future of problem-solving is multinational collaboration, creative disciplines must evolve collaboration strategies to sync with this method of work. "

Recent Blog Posts

NASA climate legacies interactive tool to create climate generations

Create your Own Climate Generation Visual

Map your family's climate legacy We're excited that a UN Intergovernmental IPCC figure designed by our creative director has been adapted into a customizable digital...
Read More
BgStories_2023Wrapped_IntroVideo_6edited-ezgif.com-video-to-gif-converter

Happy 2024!

We're excited for another year of creating visuals people ‘get’ at a glance. Looking back at 2023, we’re really proud of the work we’ve done...
Read More

Path to a Successful Visual Story

A step-by-step guide to our collaborative process Visual storytelling is a powerful tool to help people understand and engage deeply with complex information. Whether developing...
Read More