
Beginning any infographic project, a big question is 'How do I make this information visual?’ Lucky for us, clues exist within the information itself. Once we determine what message we’re aiming to communicate to a specific audience, the form of the infographic begins to emerge.
Designers from all disciplines talk about ‘form follows function’. For infographics, visual form follows the content.
When working with narrative information (where we’re trying to explain something to the audience) there are two high-level visual structures that consistently re-occur: Processes and scenarios.
PROCESSES:
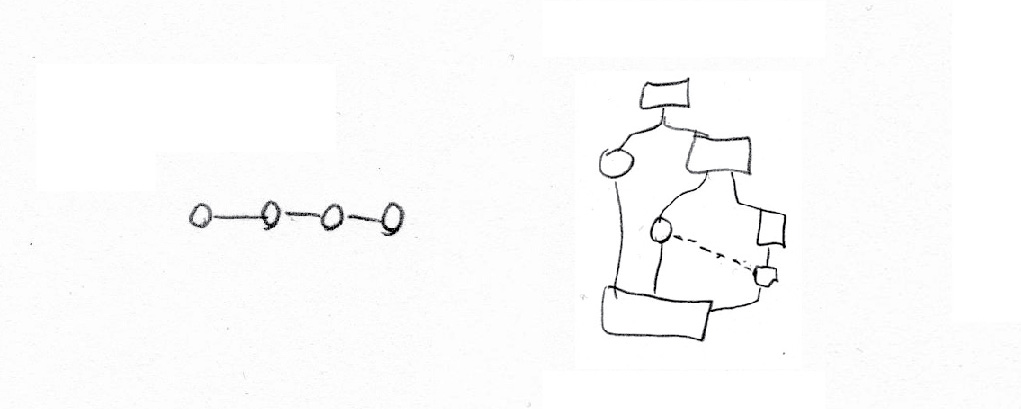
Processes include timelines and step-by-step flows of information. These can be visualized through any of the following sketches. A process has an entry/exit point (or points) and an order to the steps (at least some of them).
Examine your content and ask yourself:
- Are we guiding the viewer through a series of steps?
- Is the order of the elements important to the message we’re trying to communicate?
If so, you might have a visual process on your hands.
Here's some examples of process-focused infographics:


SCENARIOS:
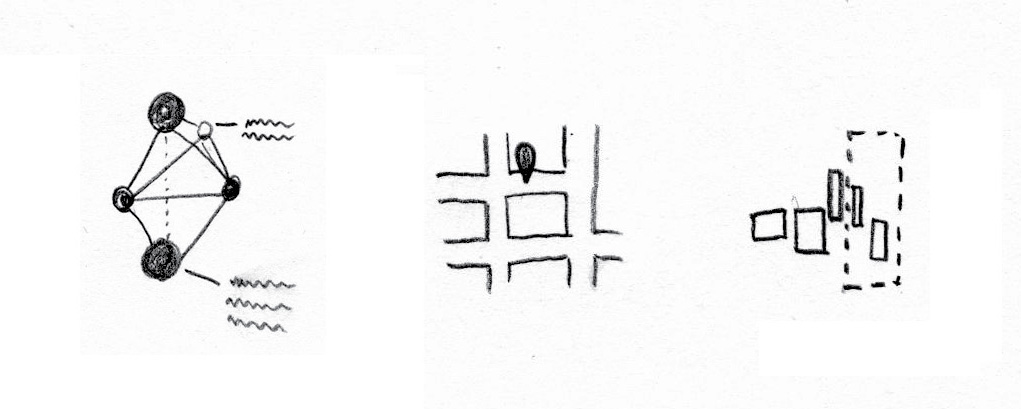
Scenario-based visual structures include maps (both geographic and conceptual), systems, networks, and lay-of-the-lands. These show how pieces of info relate to other pieces, and to whole contexts. Scenarios are often annotated to help viewers understand the components of the visual.
Examine your content and ask yourself:
- Is it important that viewers understand the big-picture of this message?
- Is the organization of the pieces of content important?
- Would a zoom-in or zoom-out of the information be interesting?
If so, a visual that shows the scenario could be useful.
Here's some examples of some scenario-focused infographics:


COMBO:
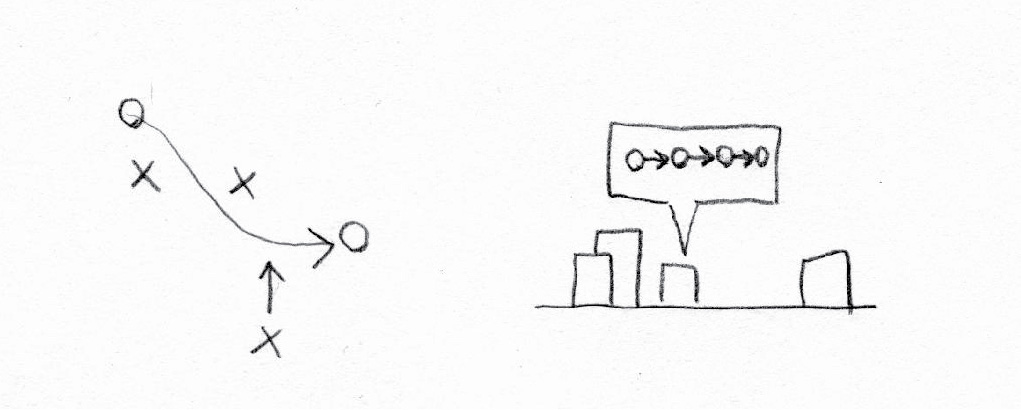
Sometimes, a combination of these two approaches leads to the most engaging and educational visual. In these cases, typically one or the other approach becomes the most prominent.
Keep in mind that the more visual approaches you combine, the more complex your infographic gets: and the more careful you have to be about using the principles of design. And that’s a topic for another time 🙂
Here are some examples of the combination of Scenarios & Processes used together in infographics:

