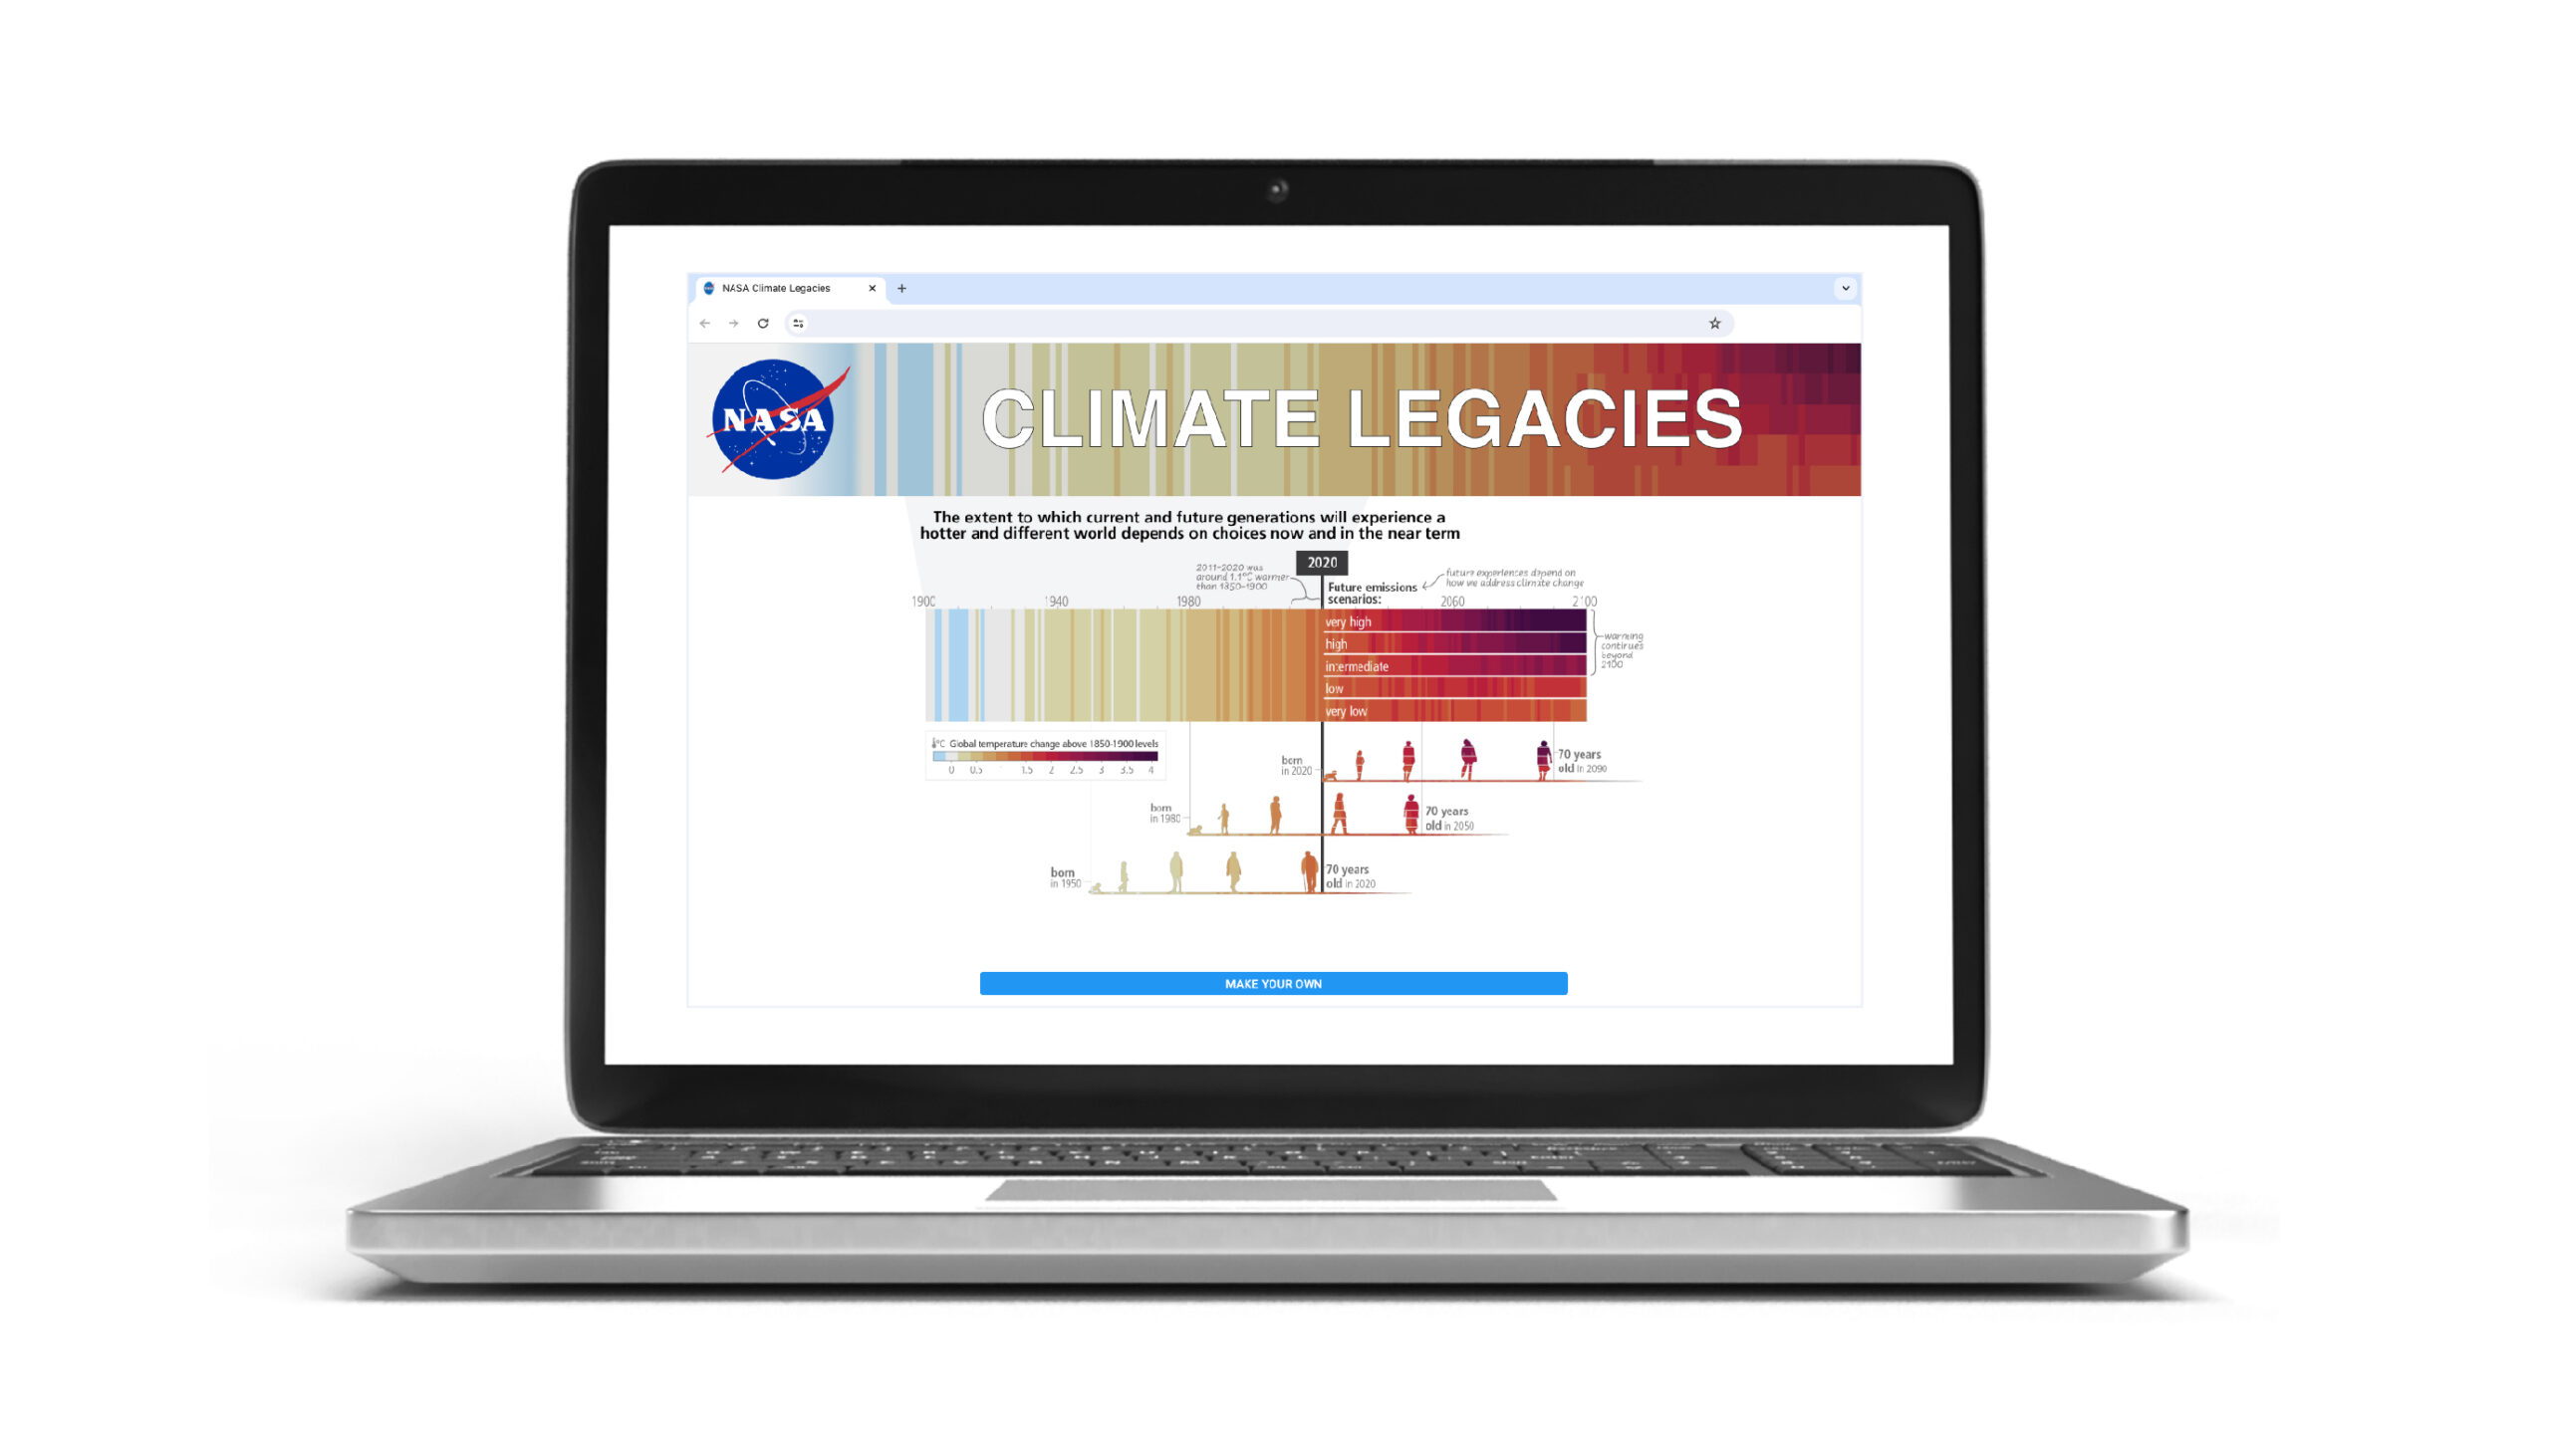
NASA climate legacies interactive tool to create climate generations

Create your Own Climate Generation Visual

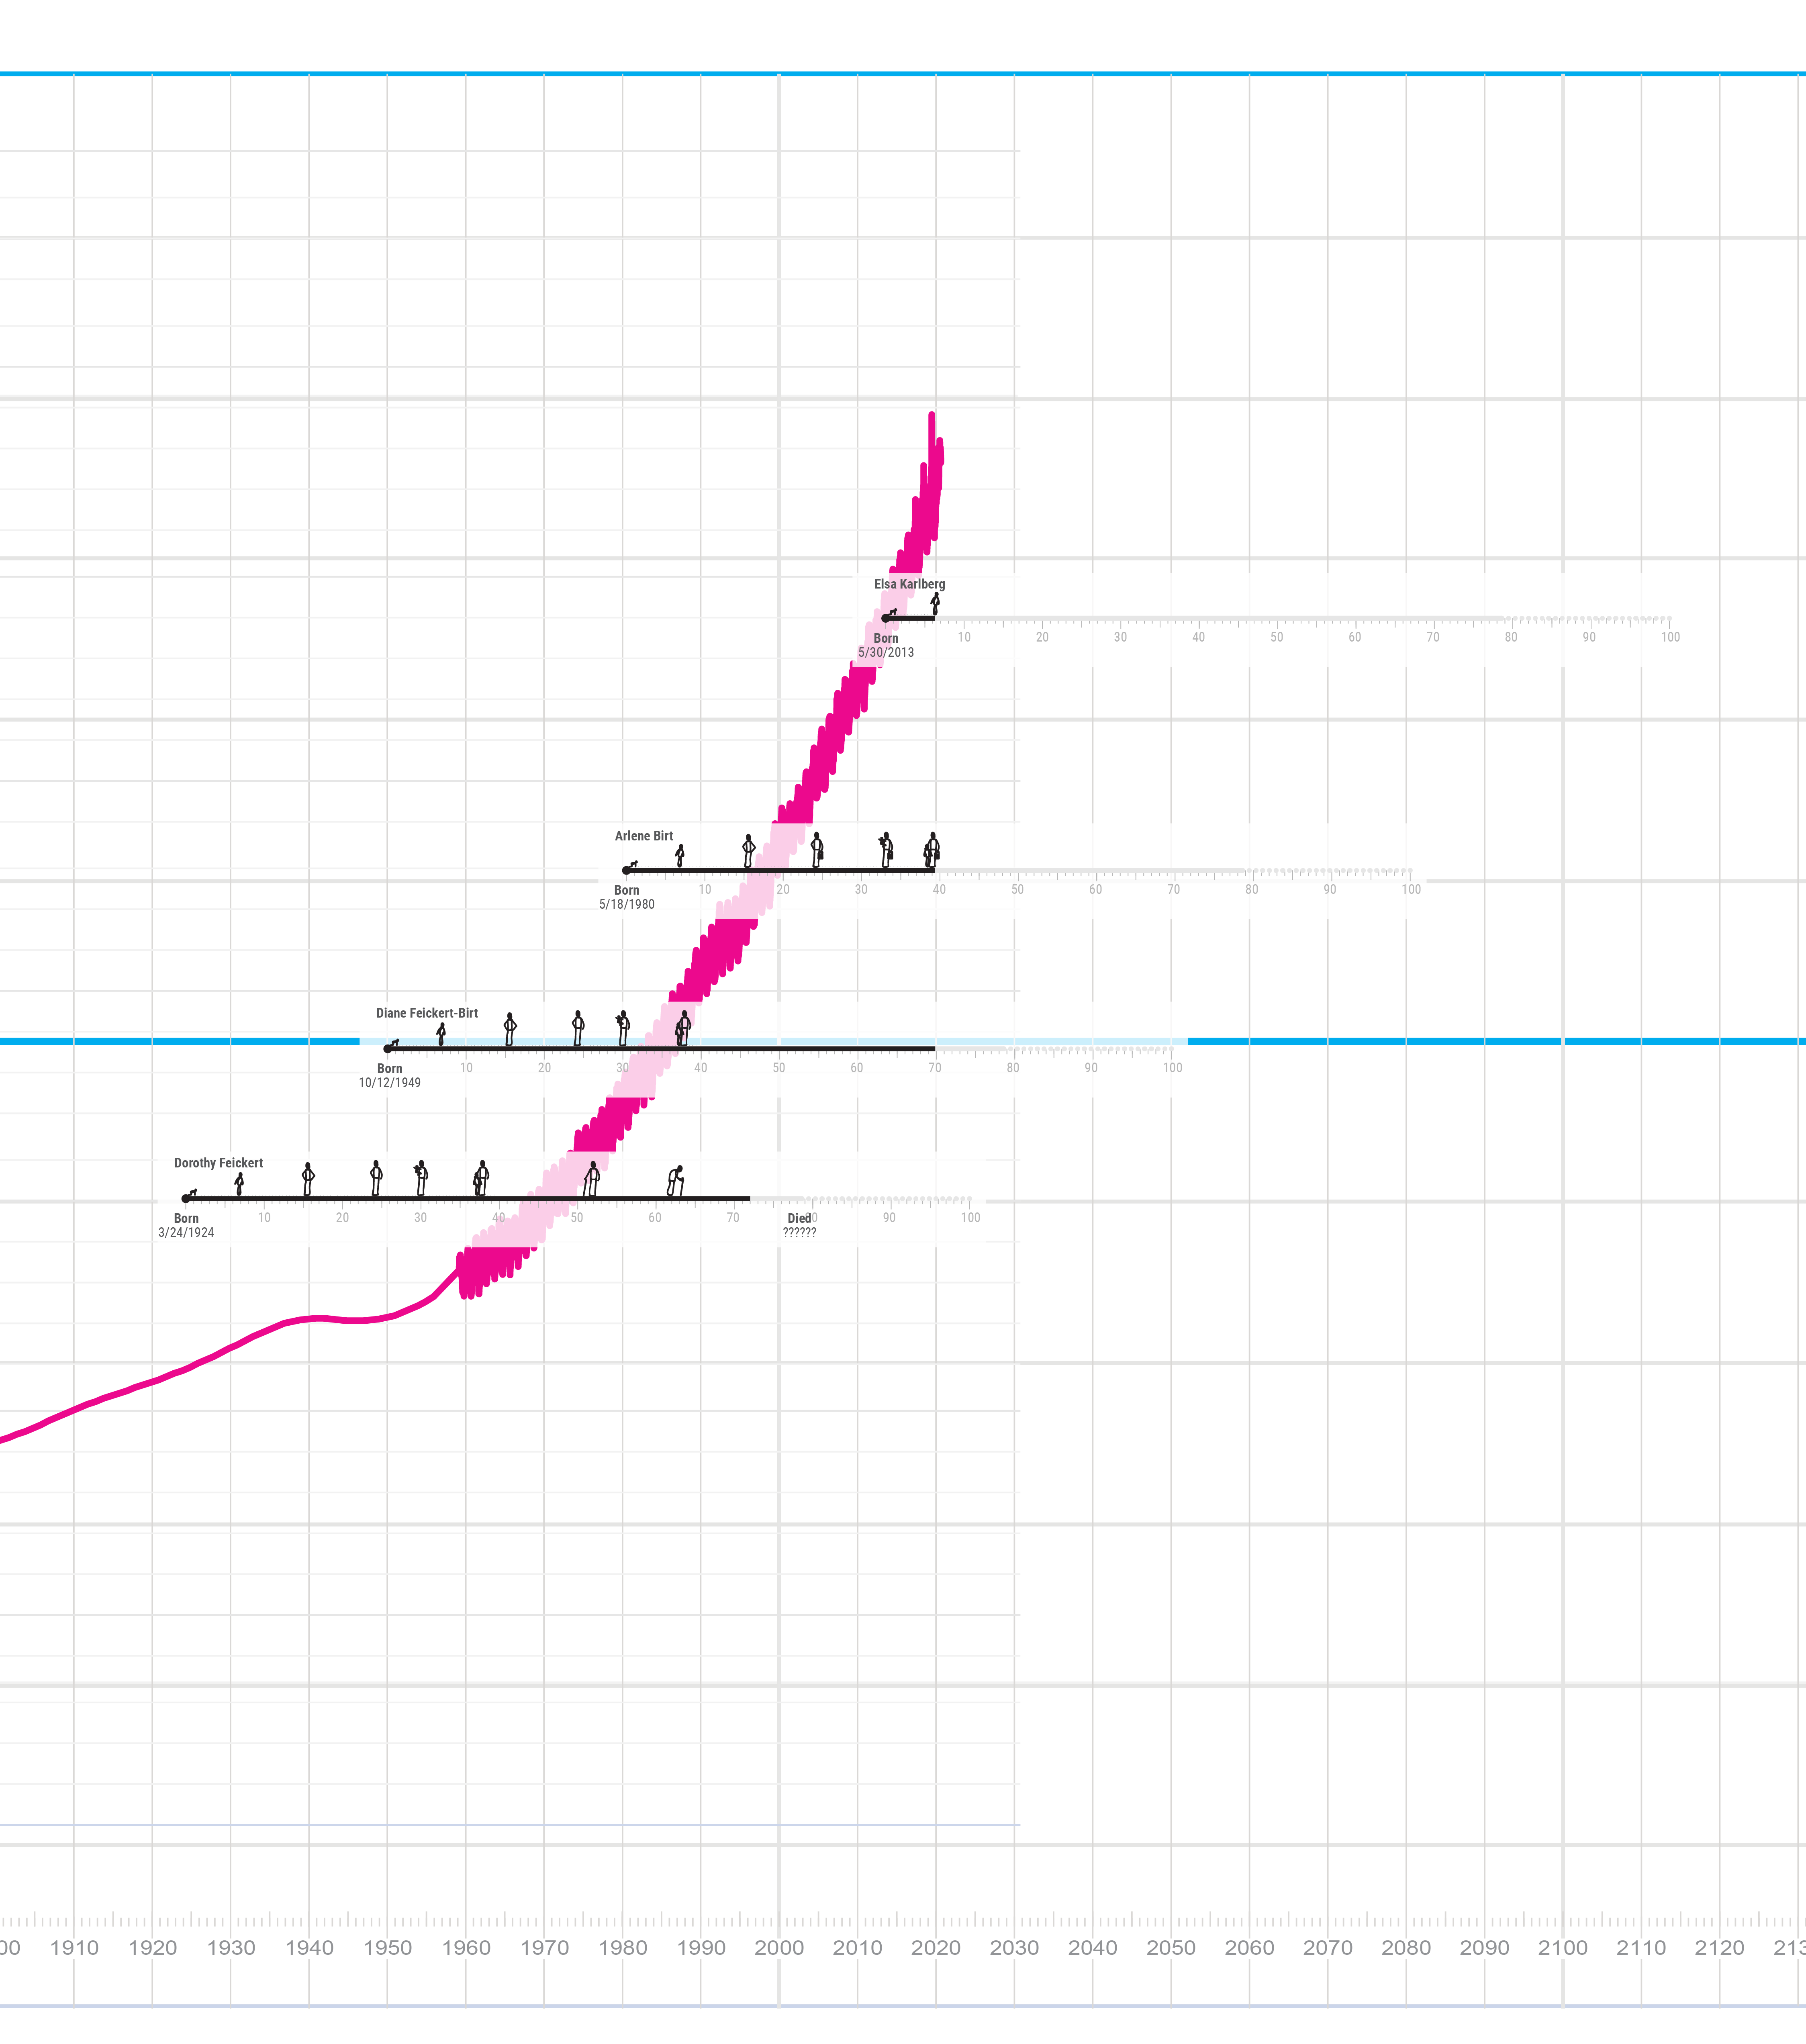
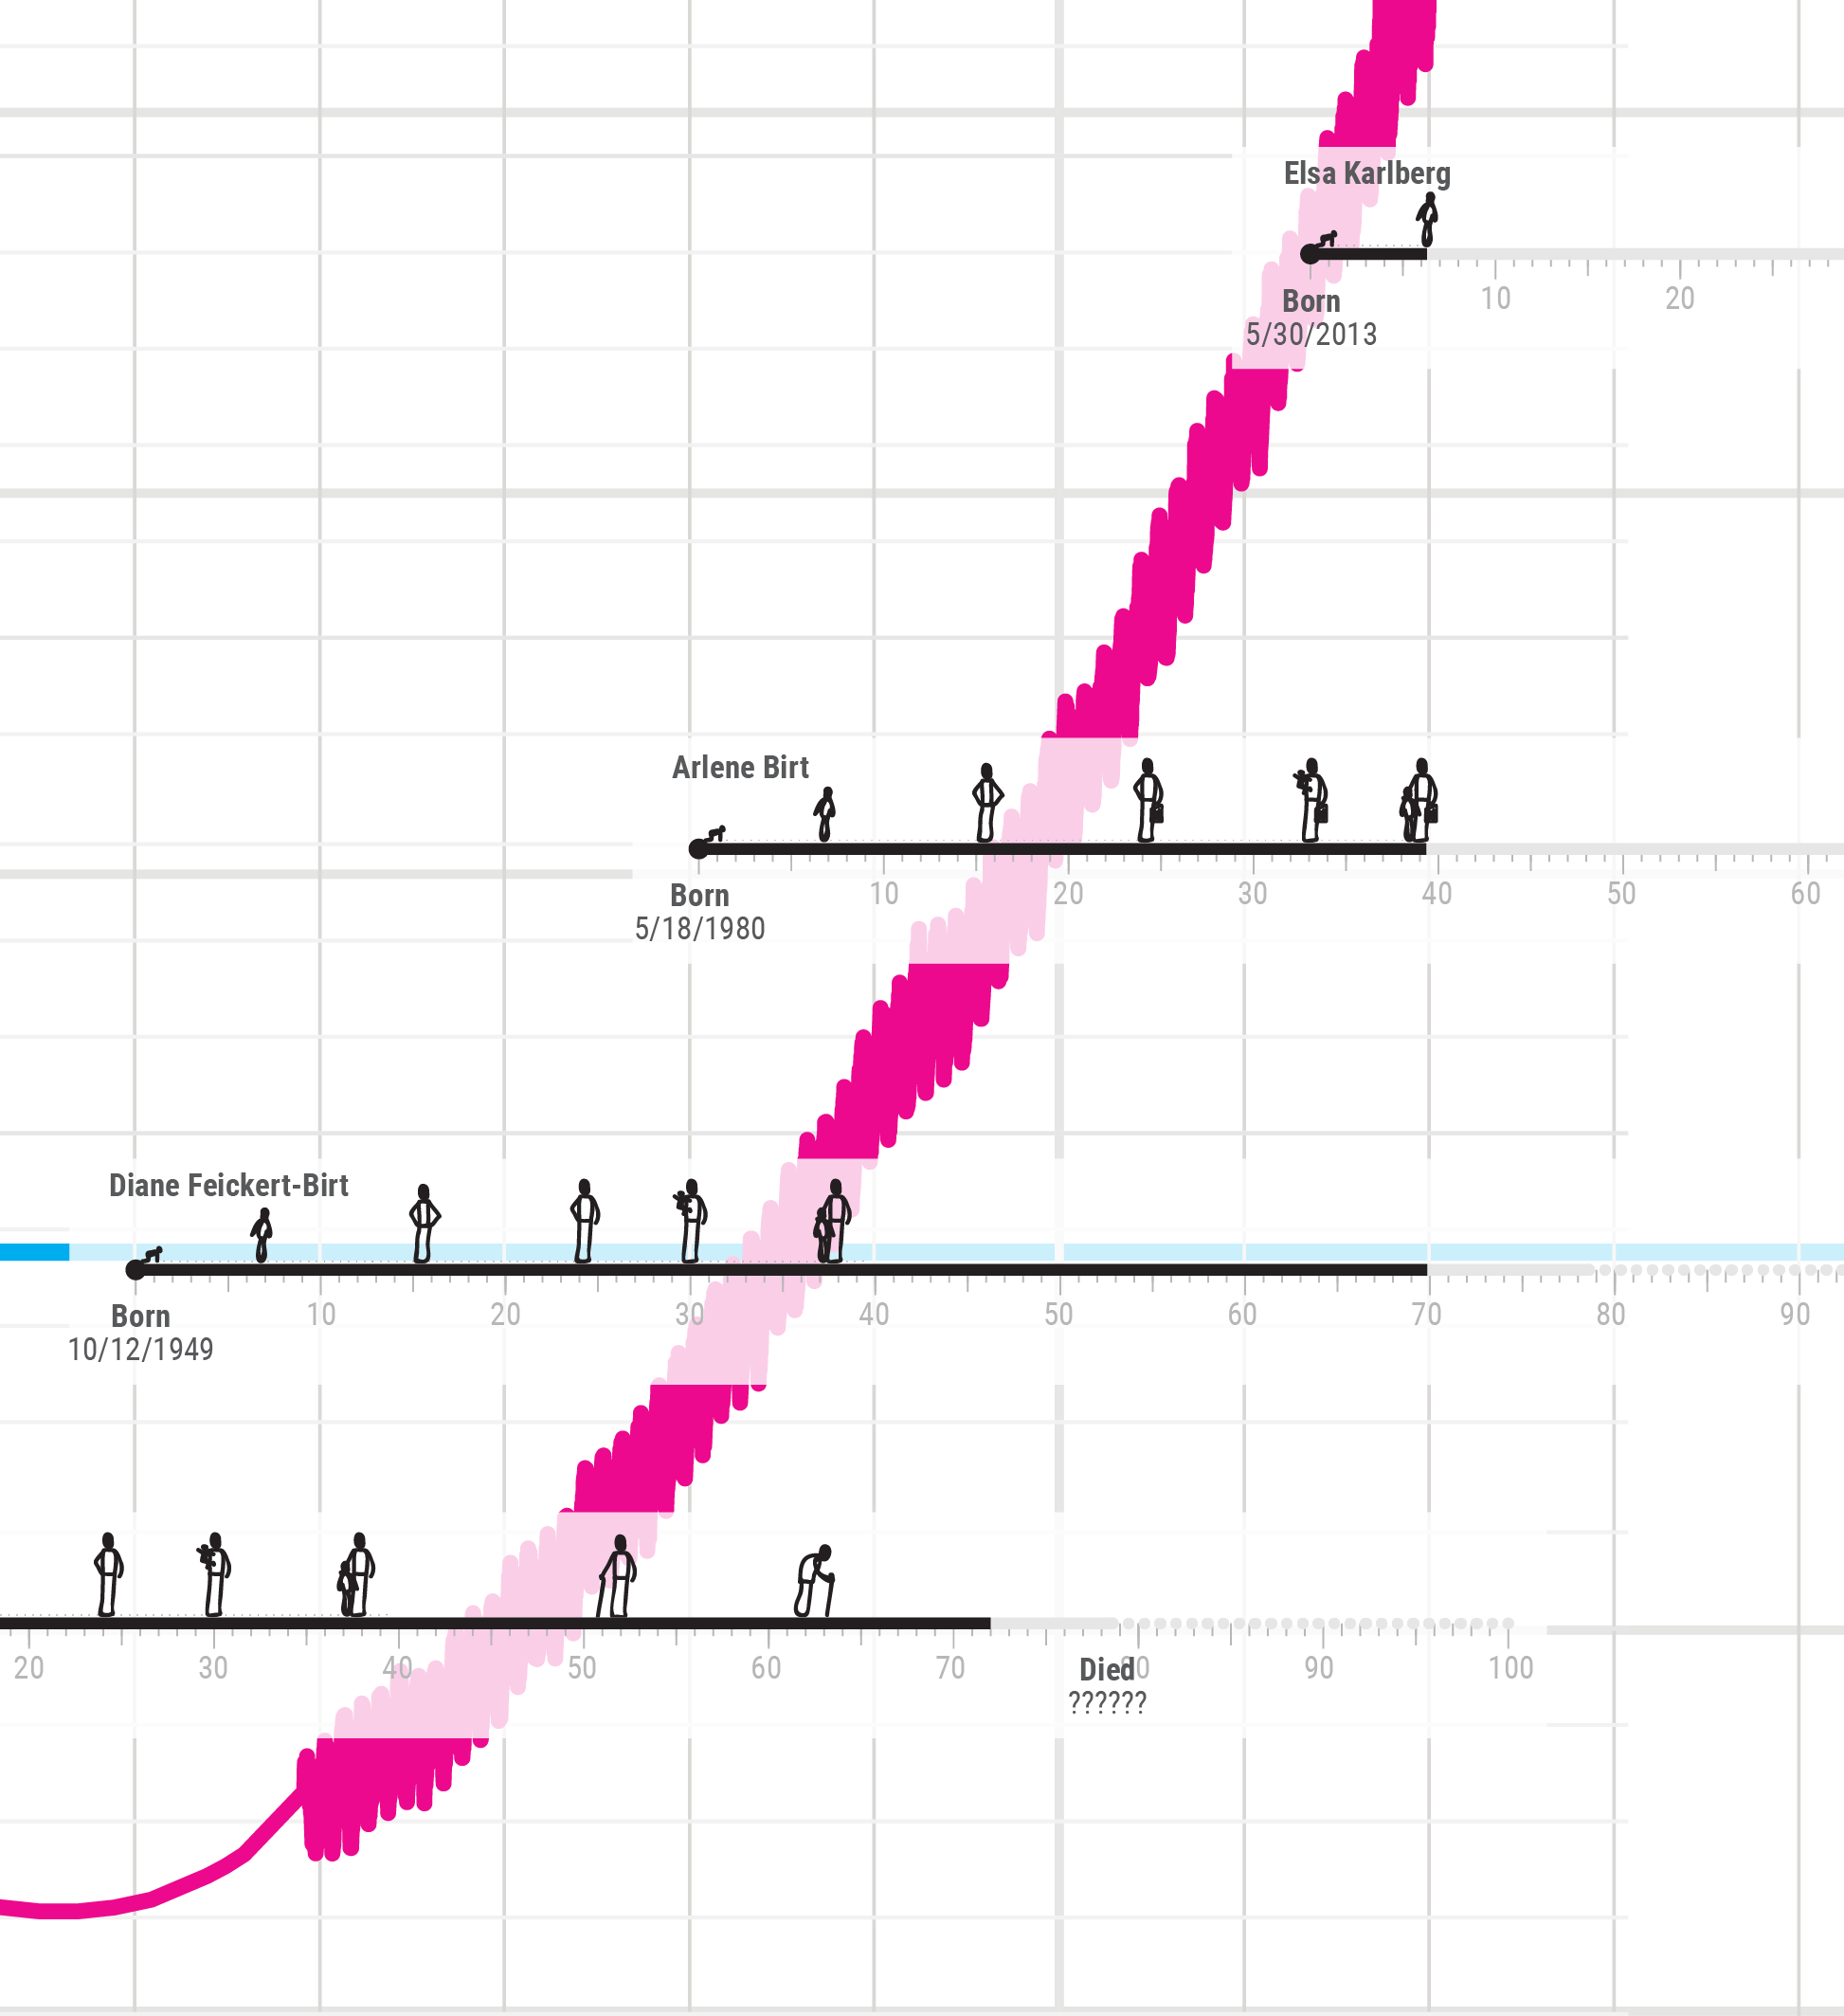
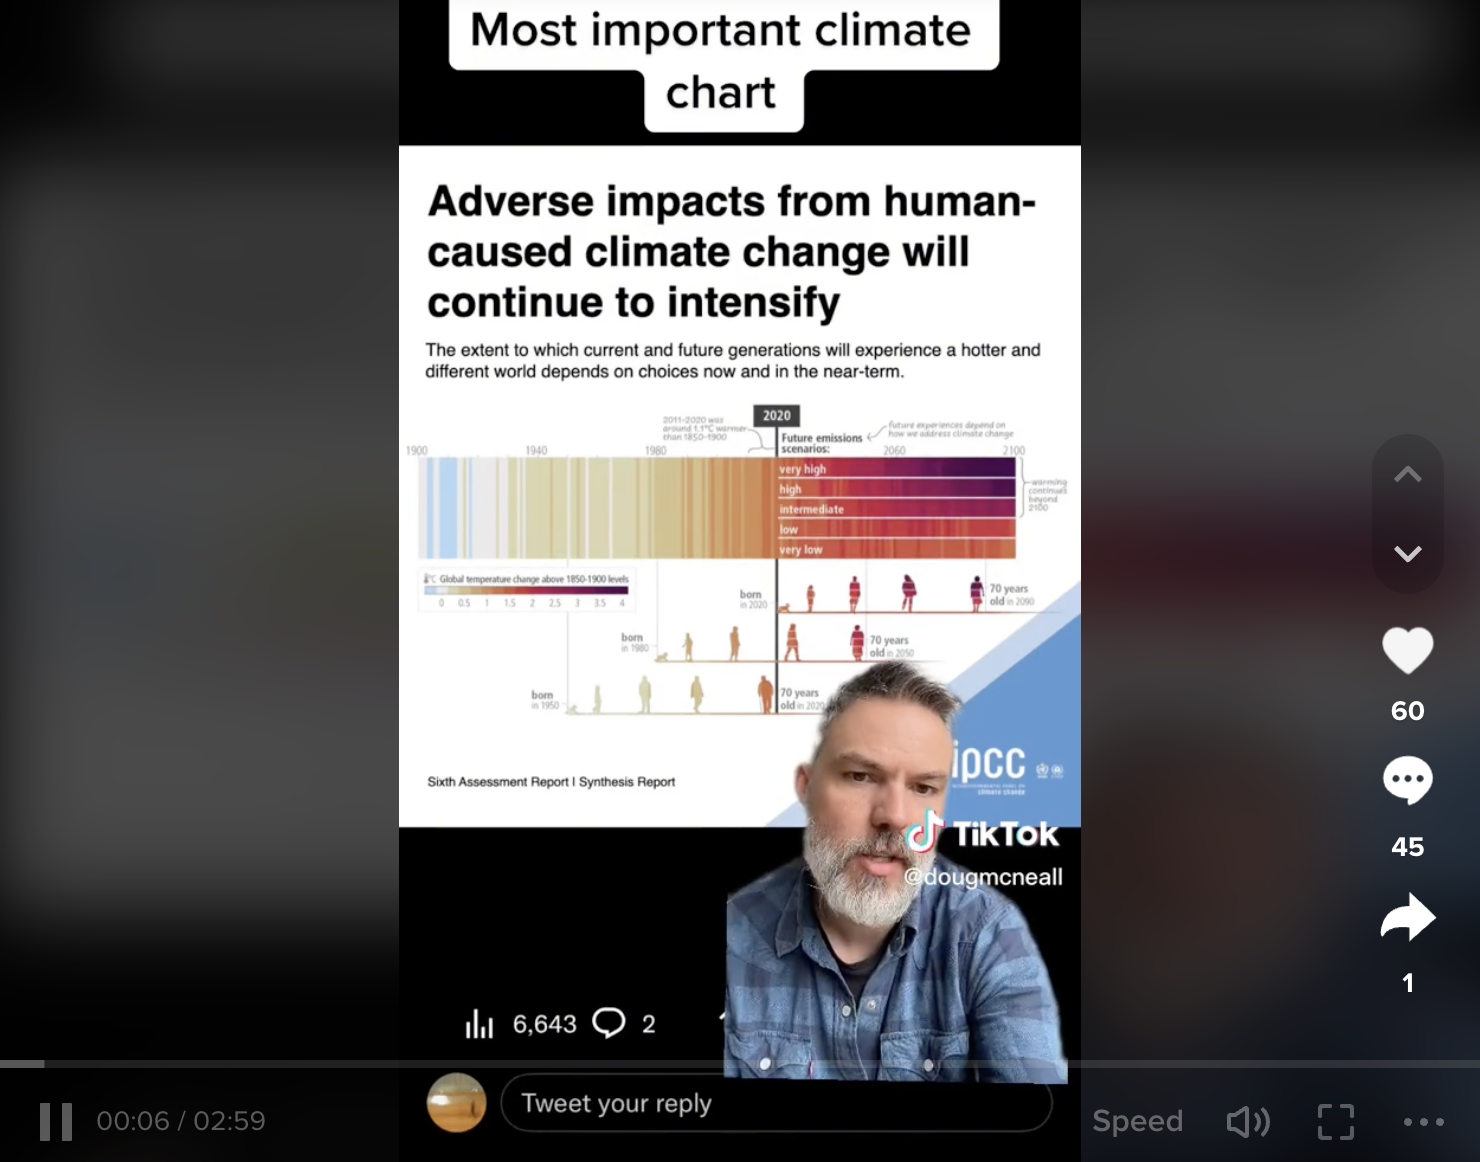
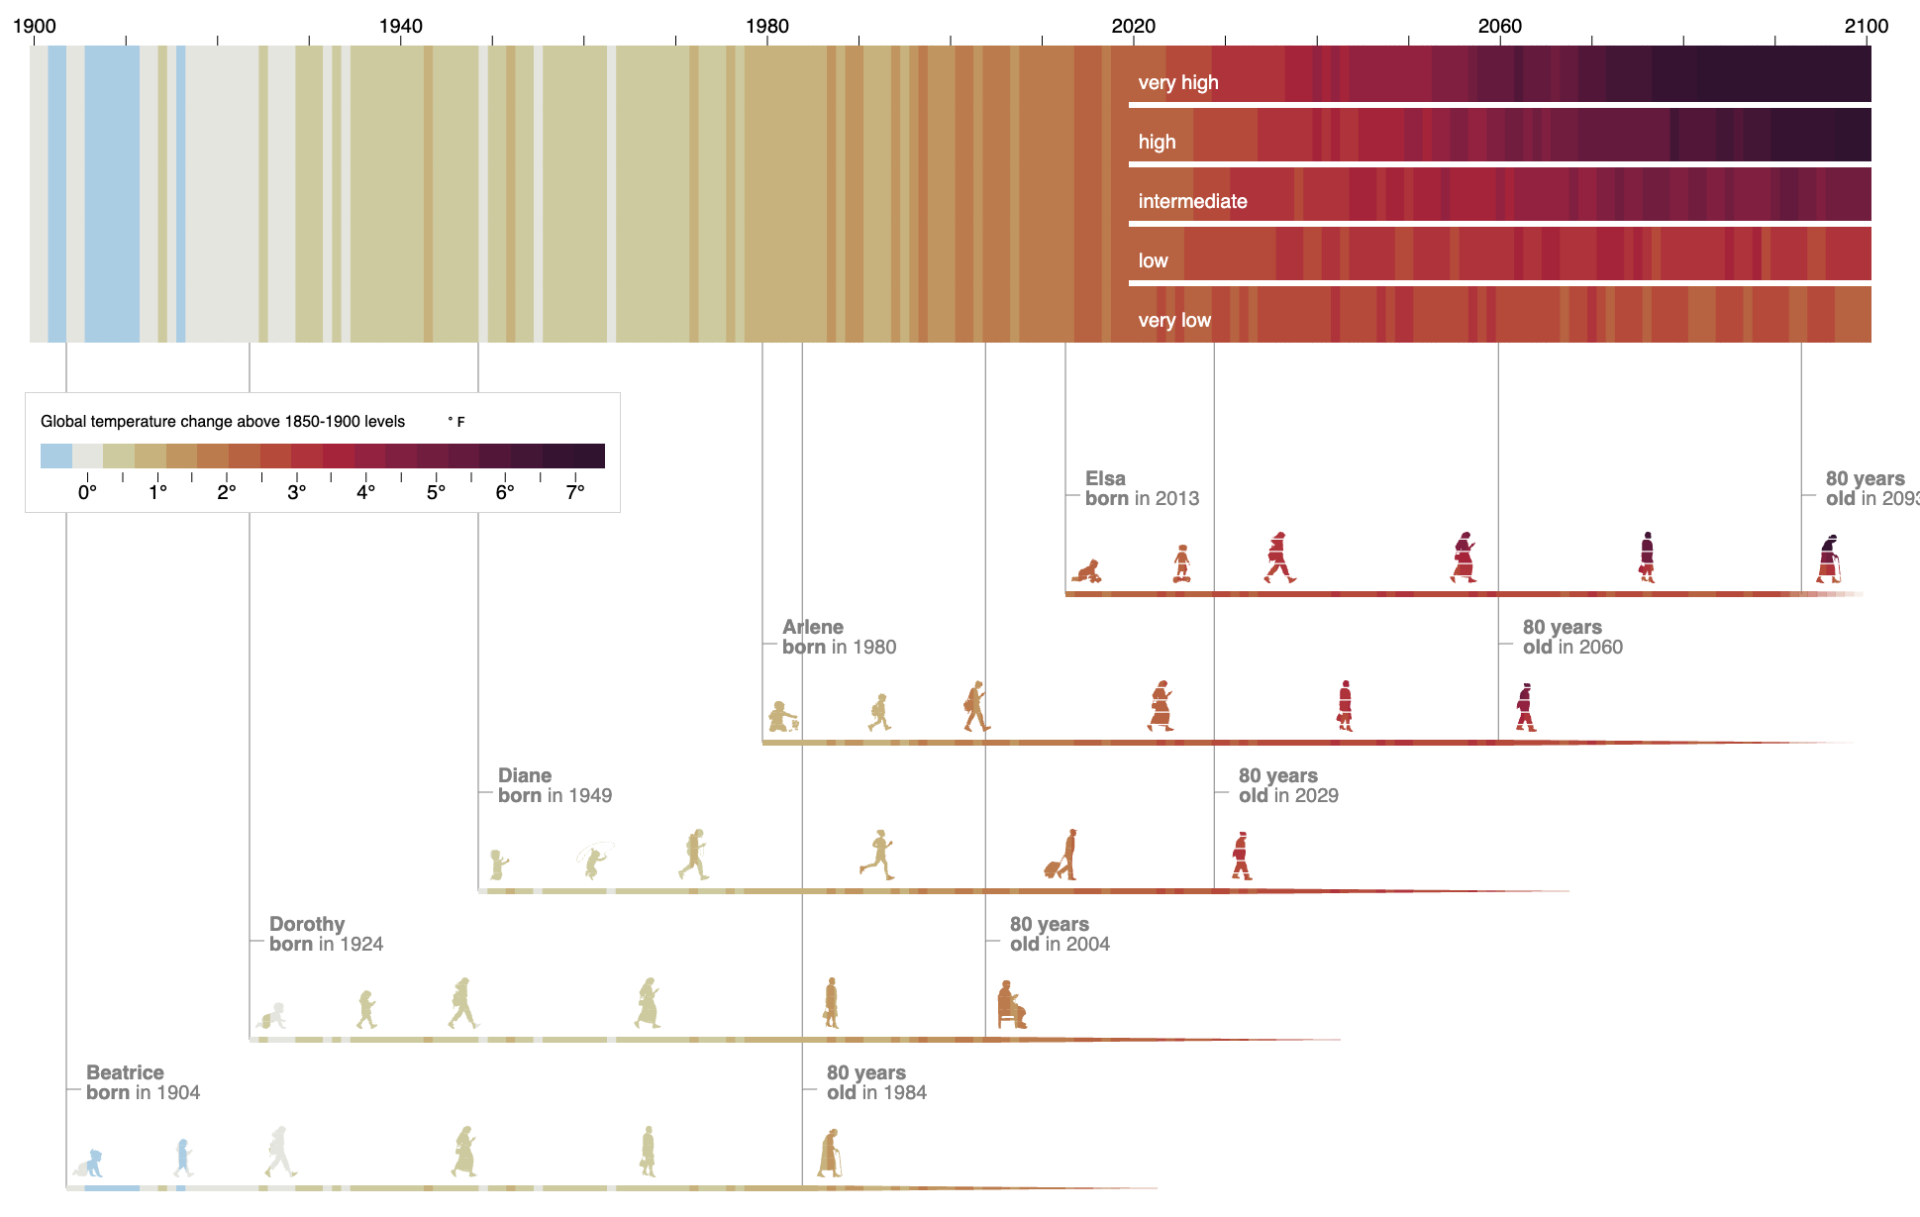
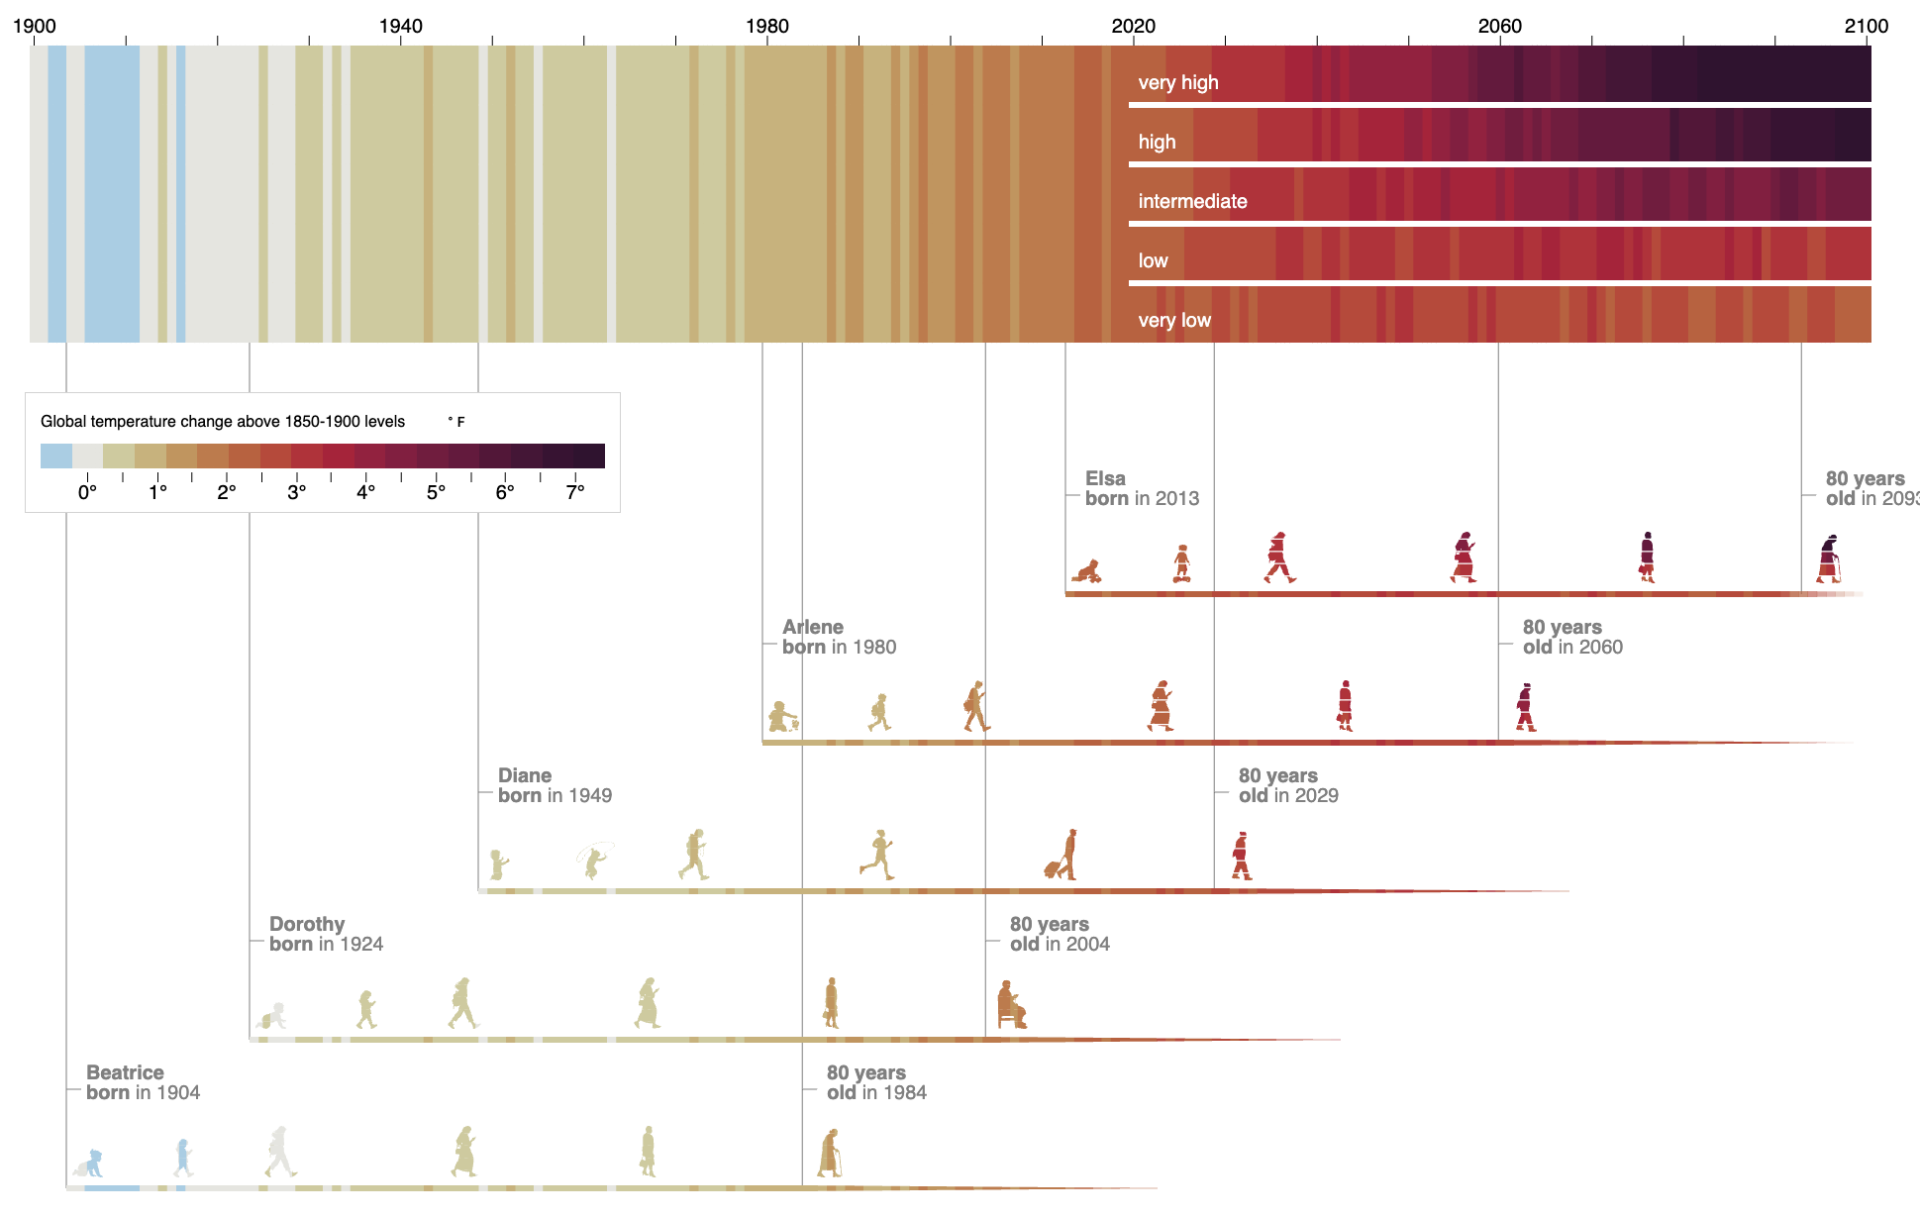
Generations of the Birt family in climate stripes created using the NASA Climate Legacies tool

Map your family's climate legacy

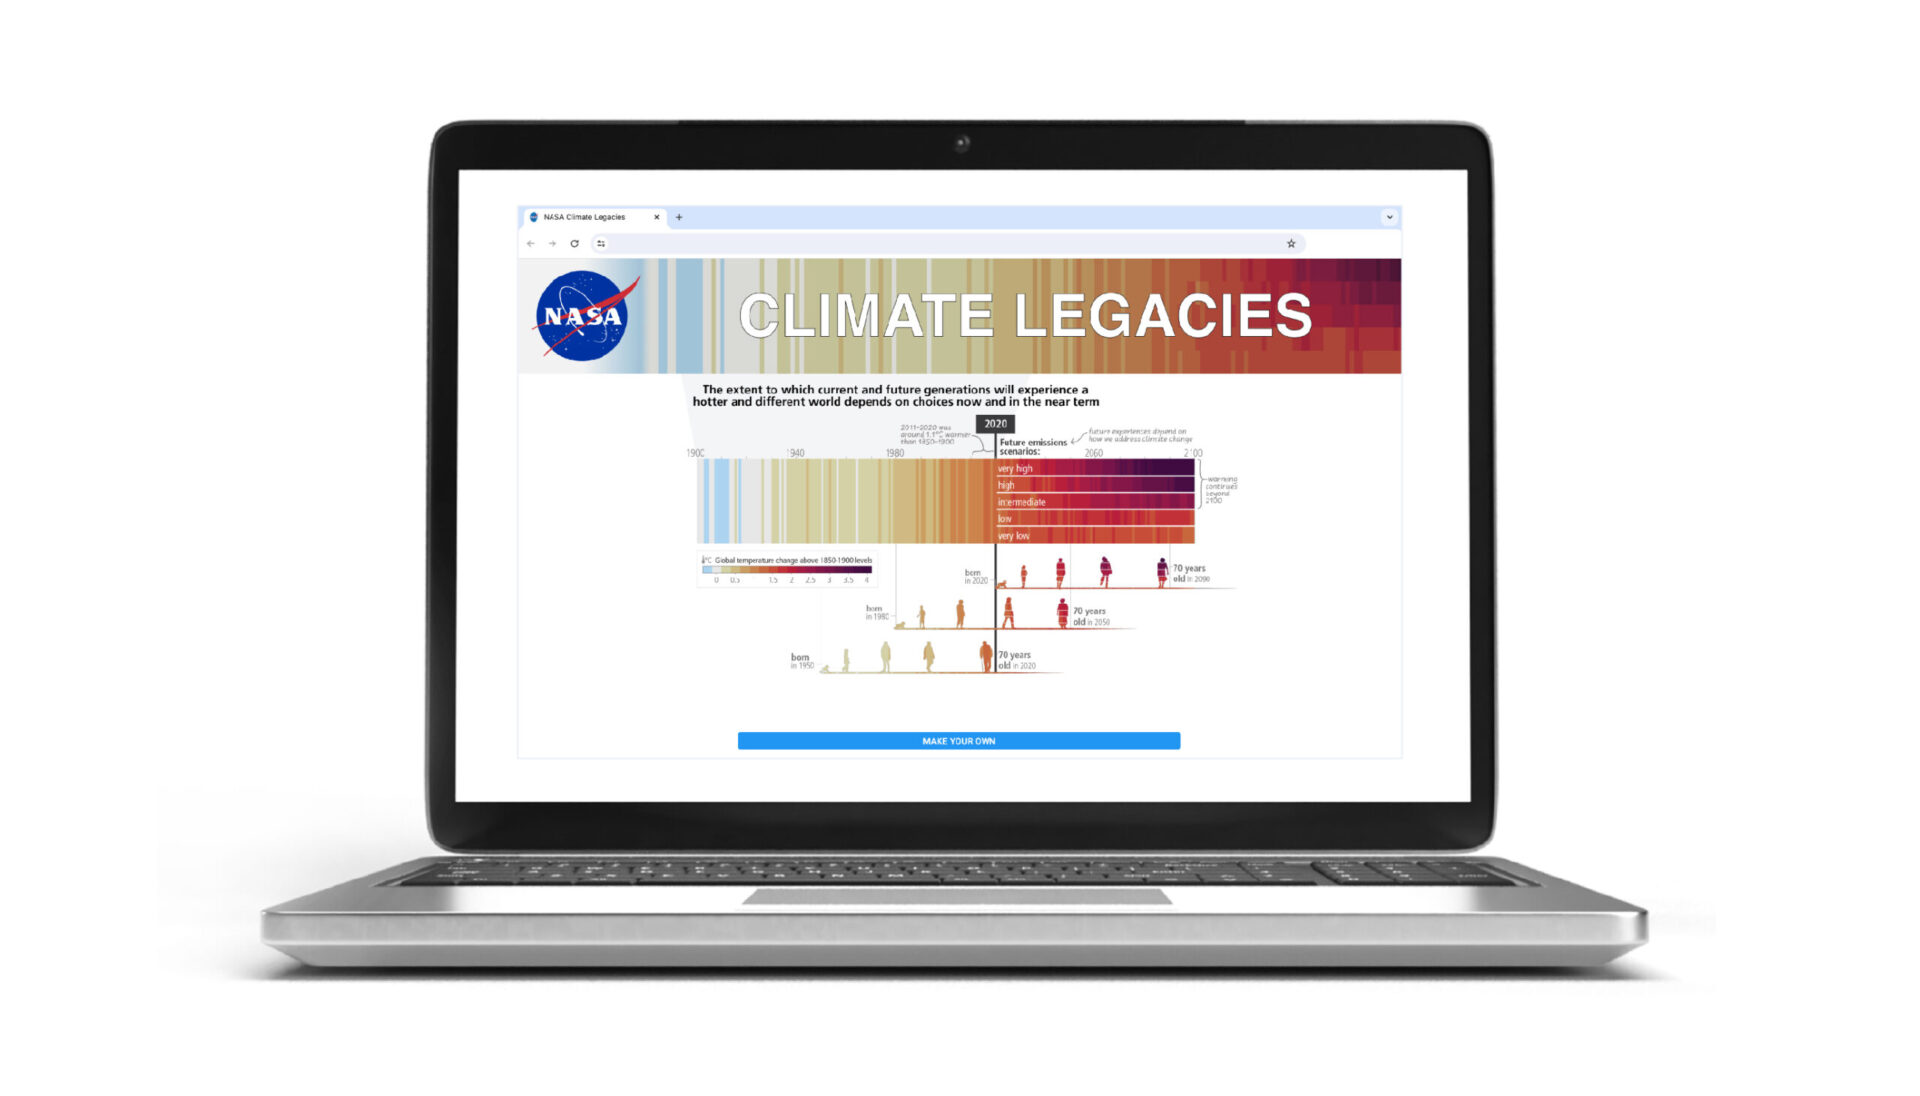
We're excited that a UN Intergovernmental IPCC figure designed by our creative director has been adapted into a customizable digital tool by the amazing team at NASA.

With the NASA tool, you can visualize your lifespan in climate temperatures - along with your family and friends: quickly comparing how different generations live through completely different worlds (in terms of temperature averages).

NASA climate legacies interactive tool to create climate generations

Before this tool, and before the infamous IPCC figure that this tool is based upon, here's the history of the people-focused aspect of this figure: How the combination of human generations and climate data emerged during a personal creative project in 2019, and evolved into today's symbol of climate impact across generations.

2019 (Summer)

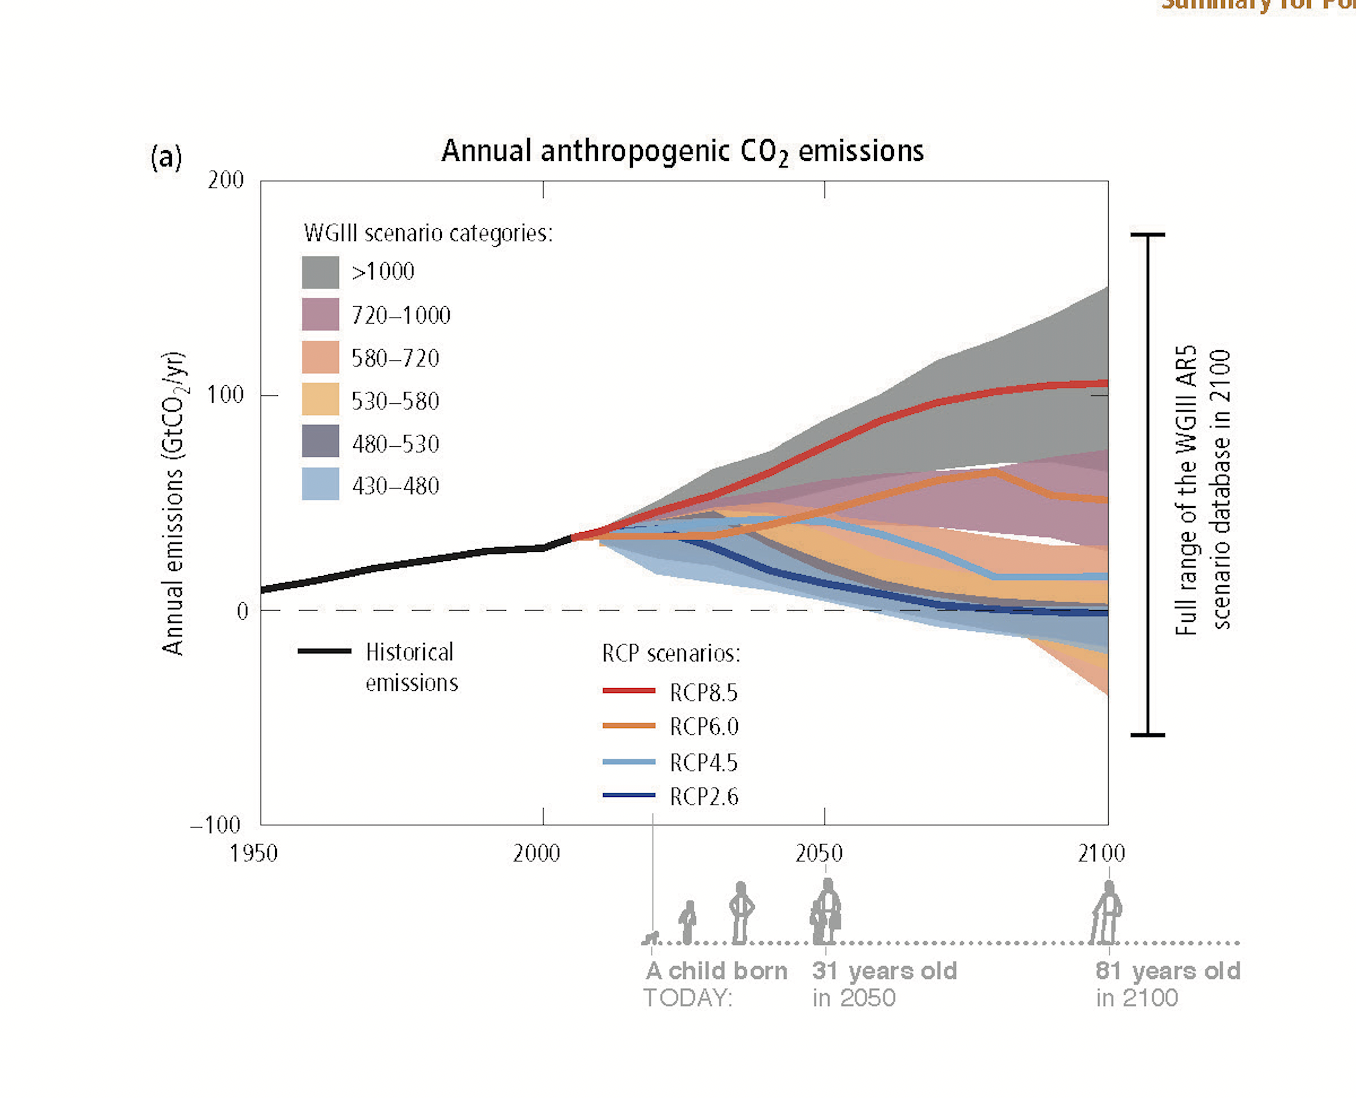
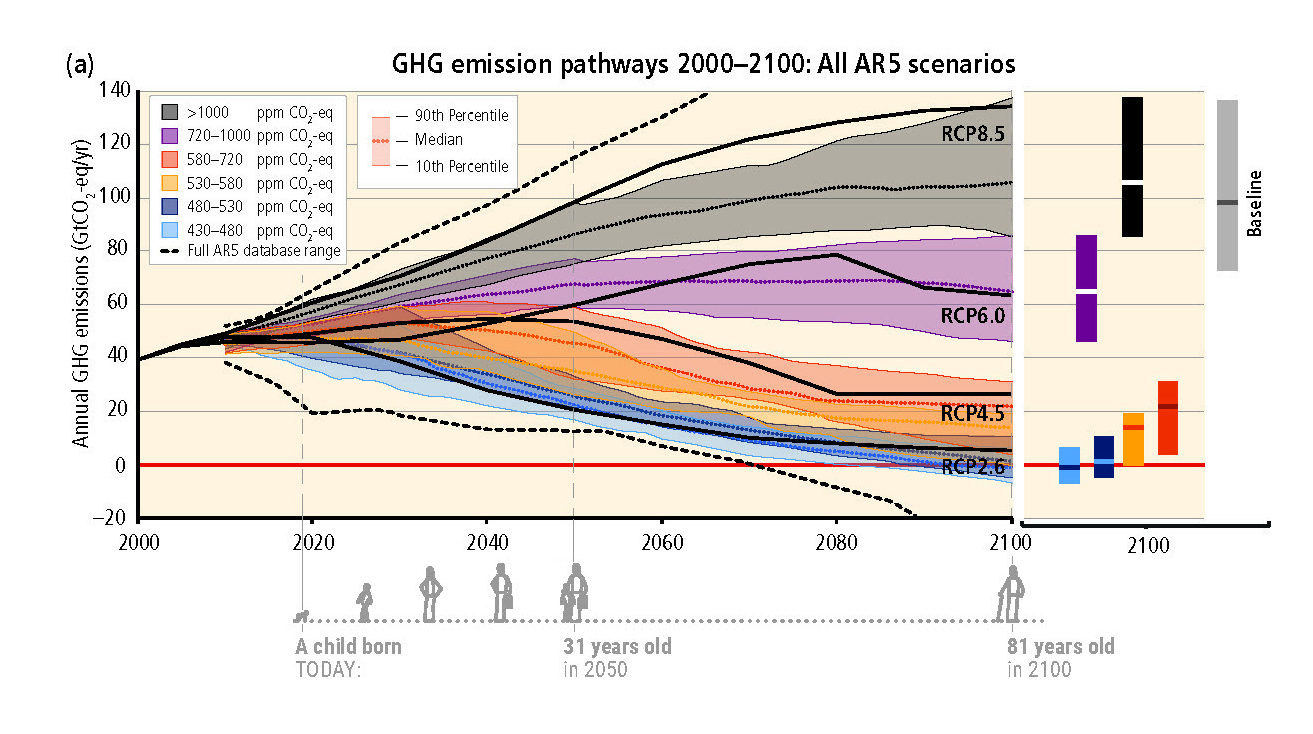
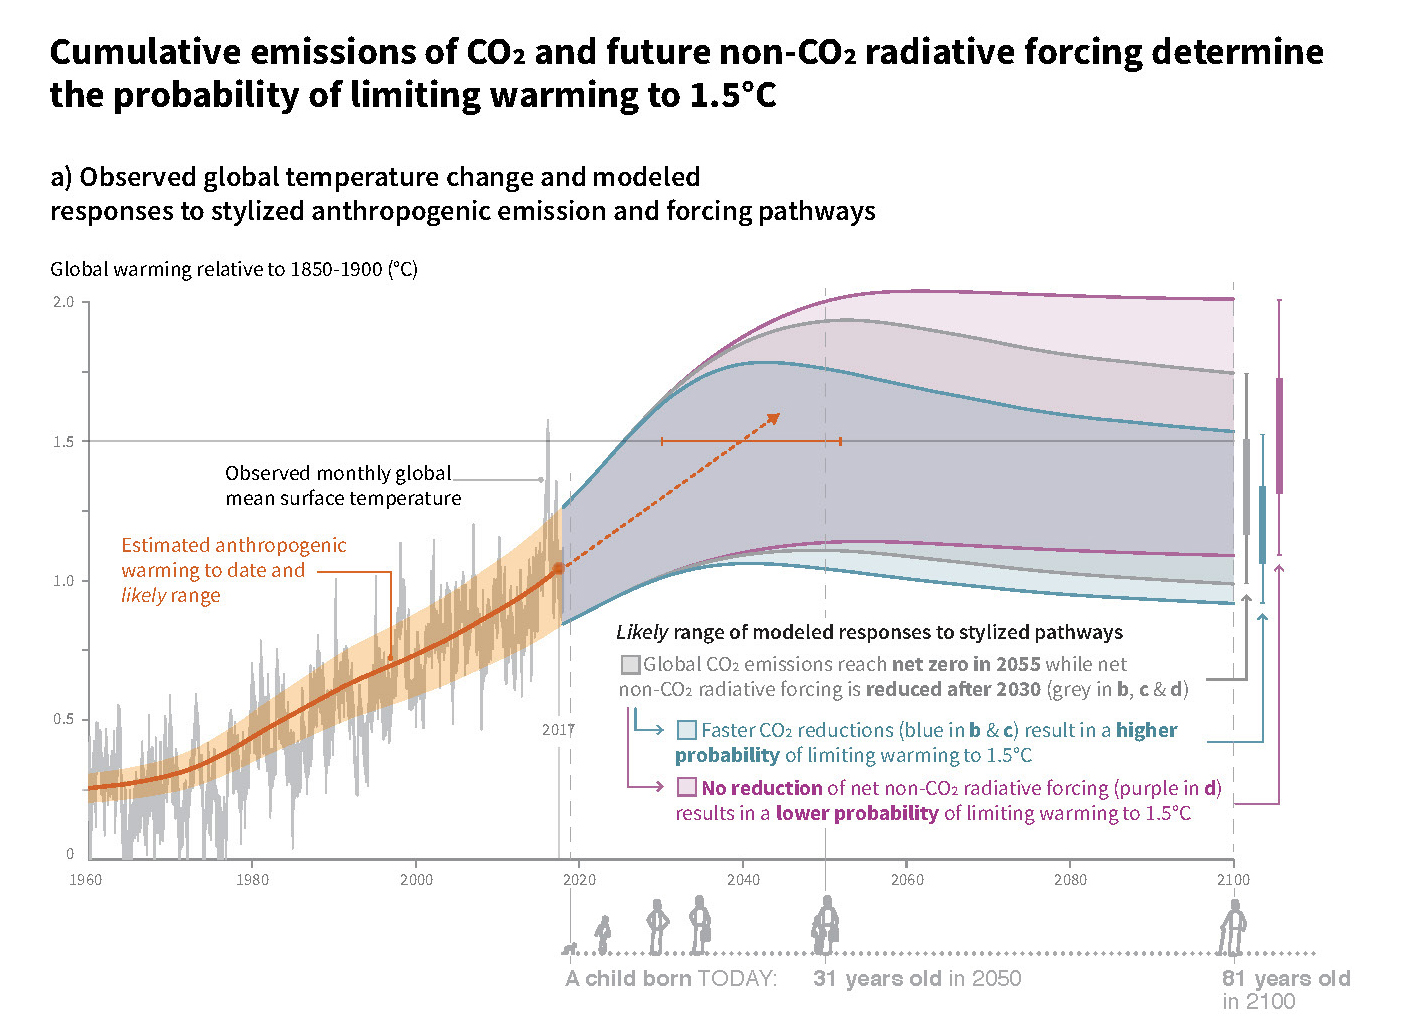
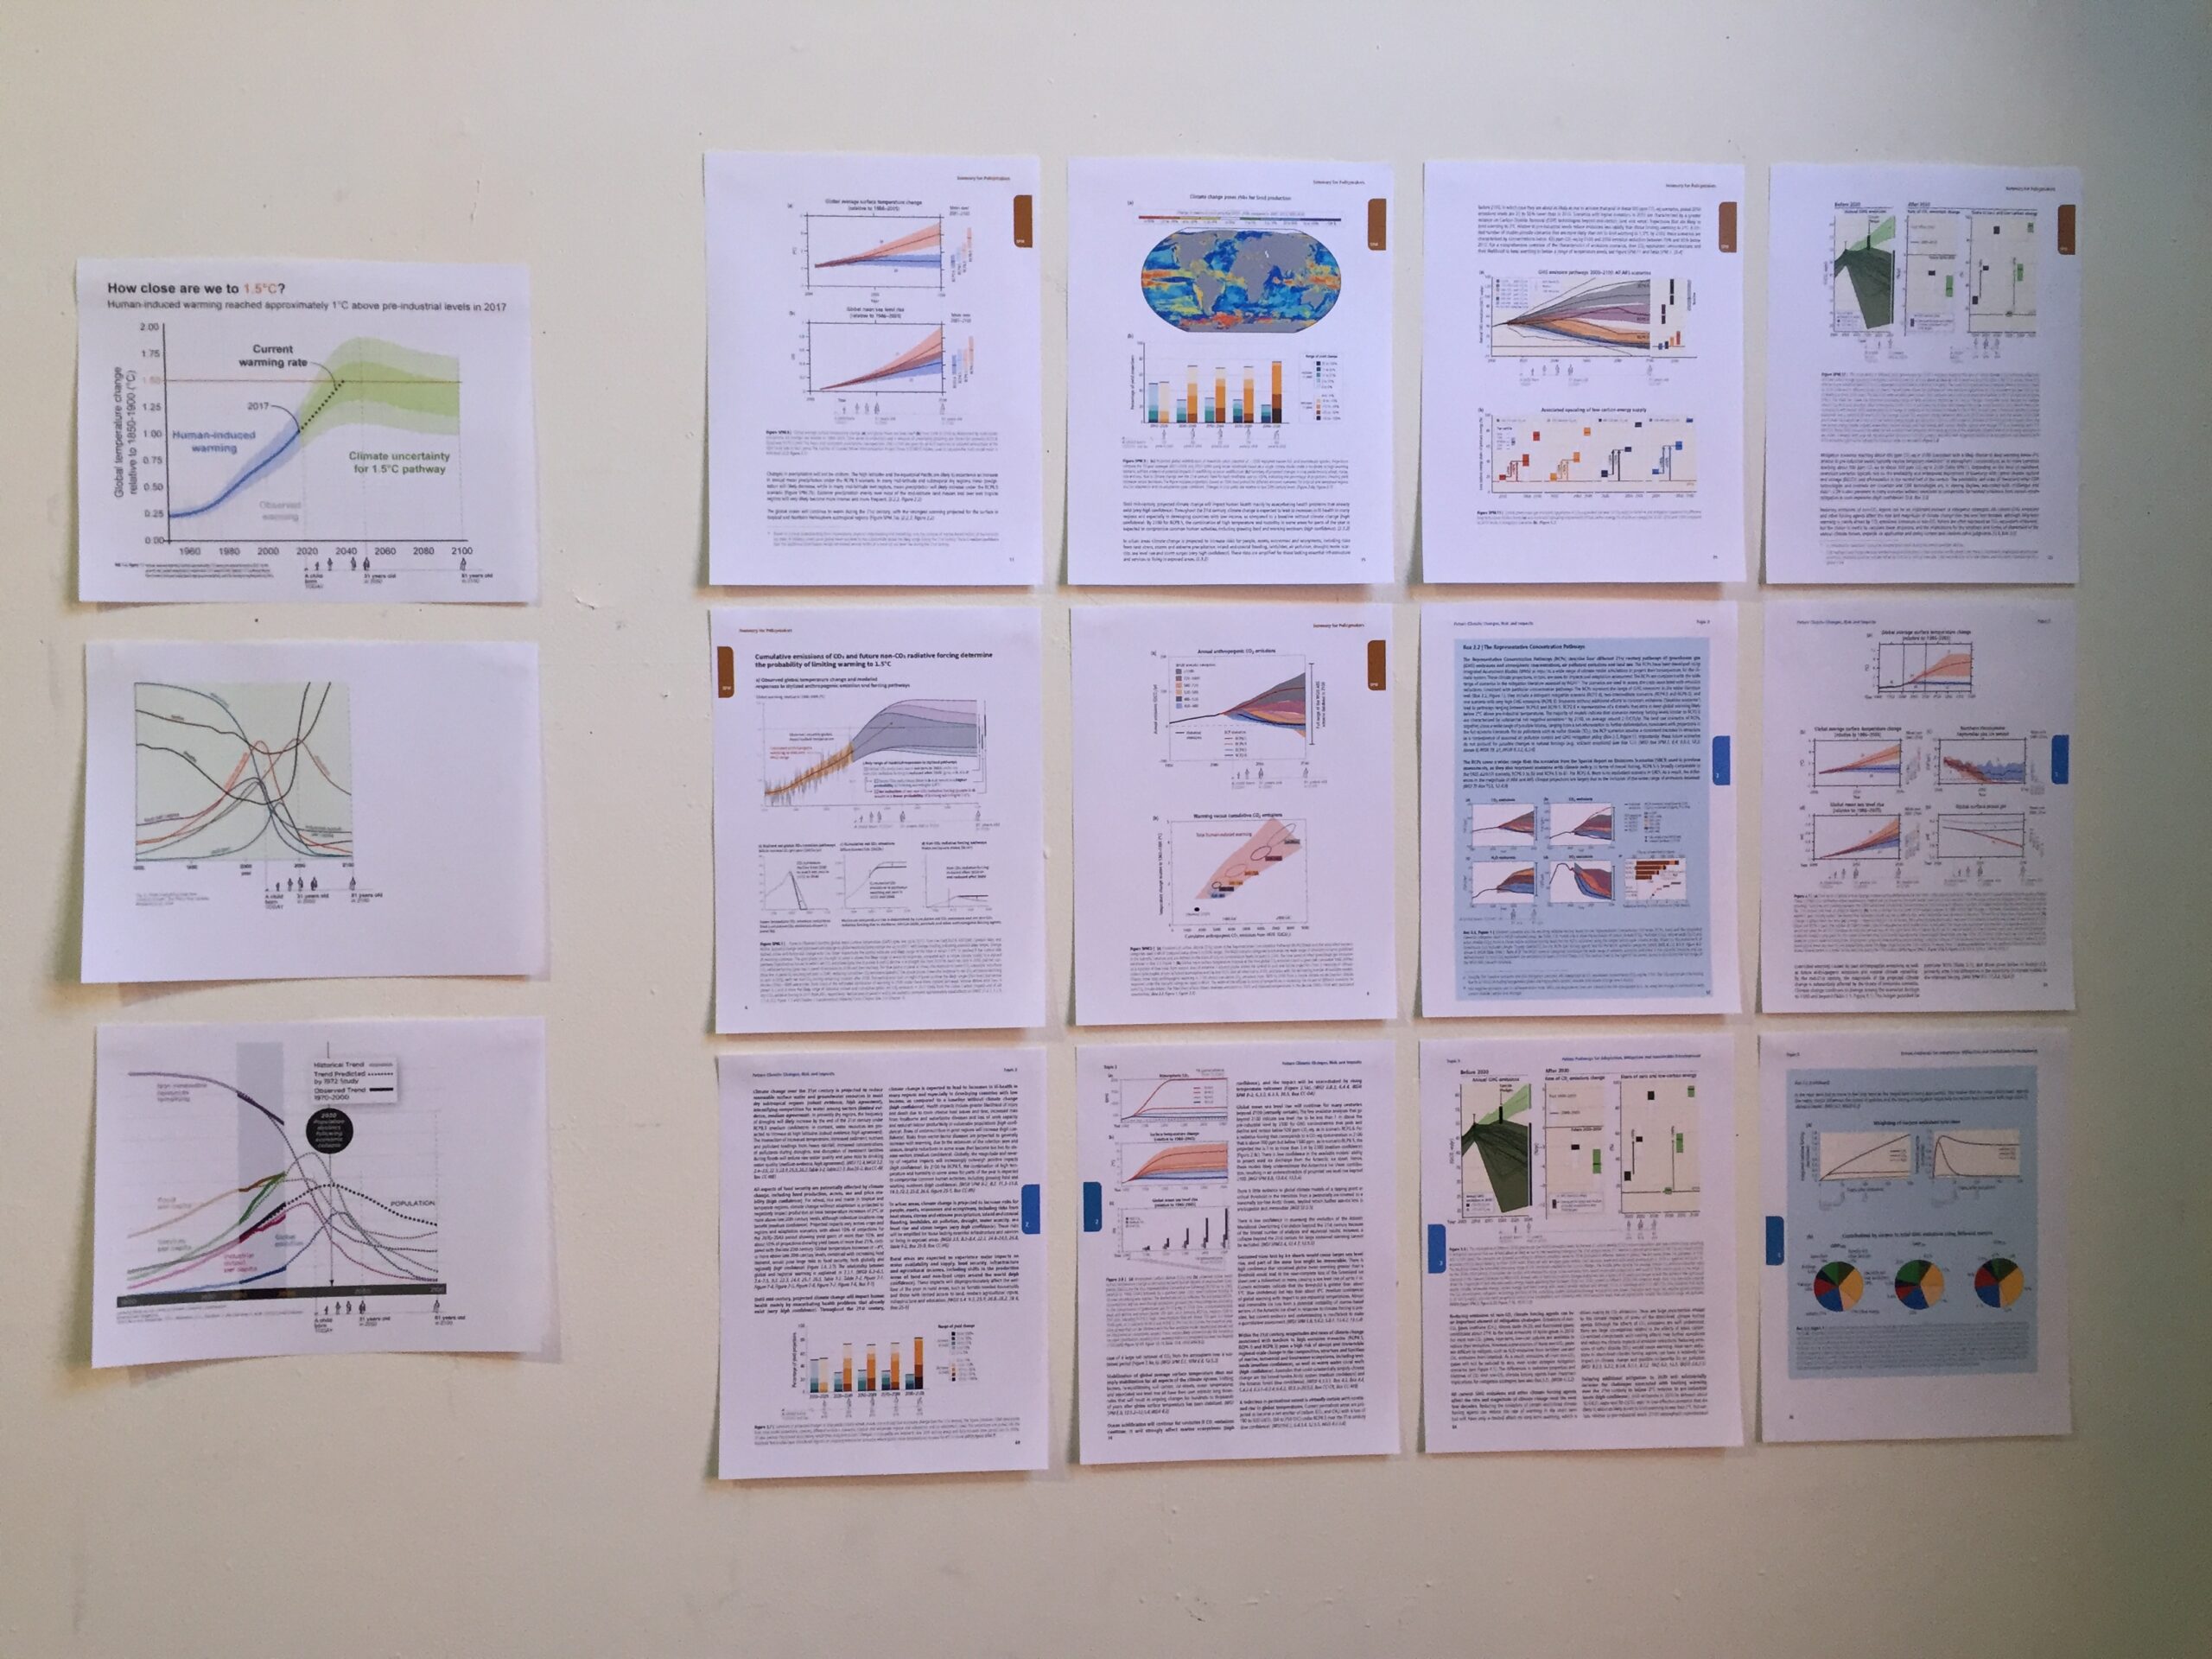
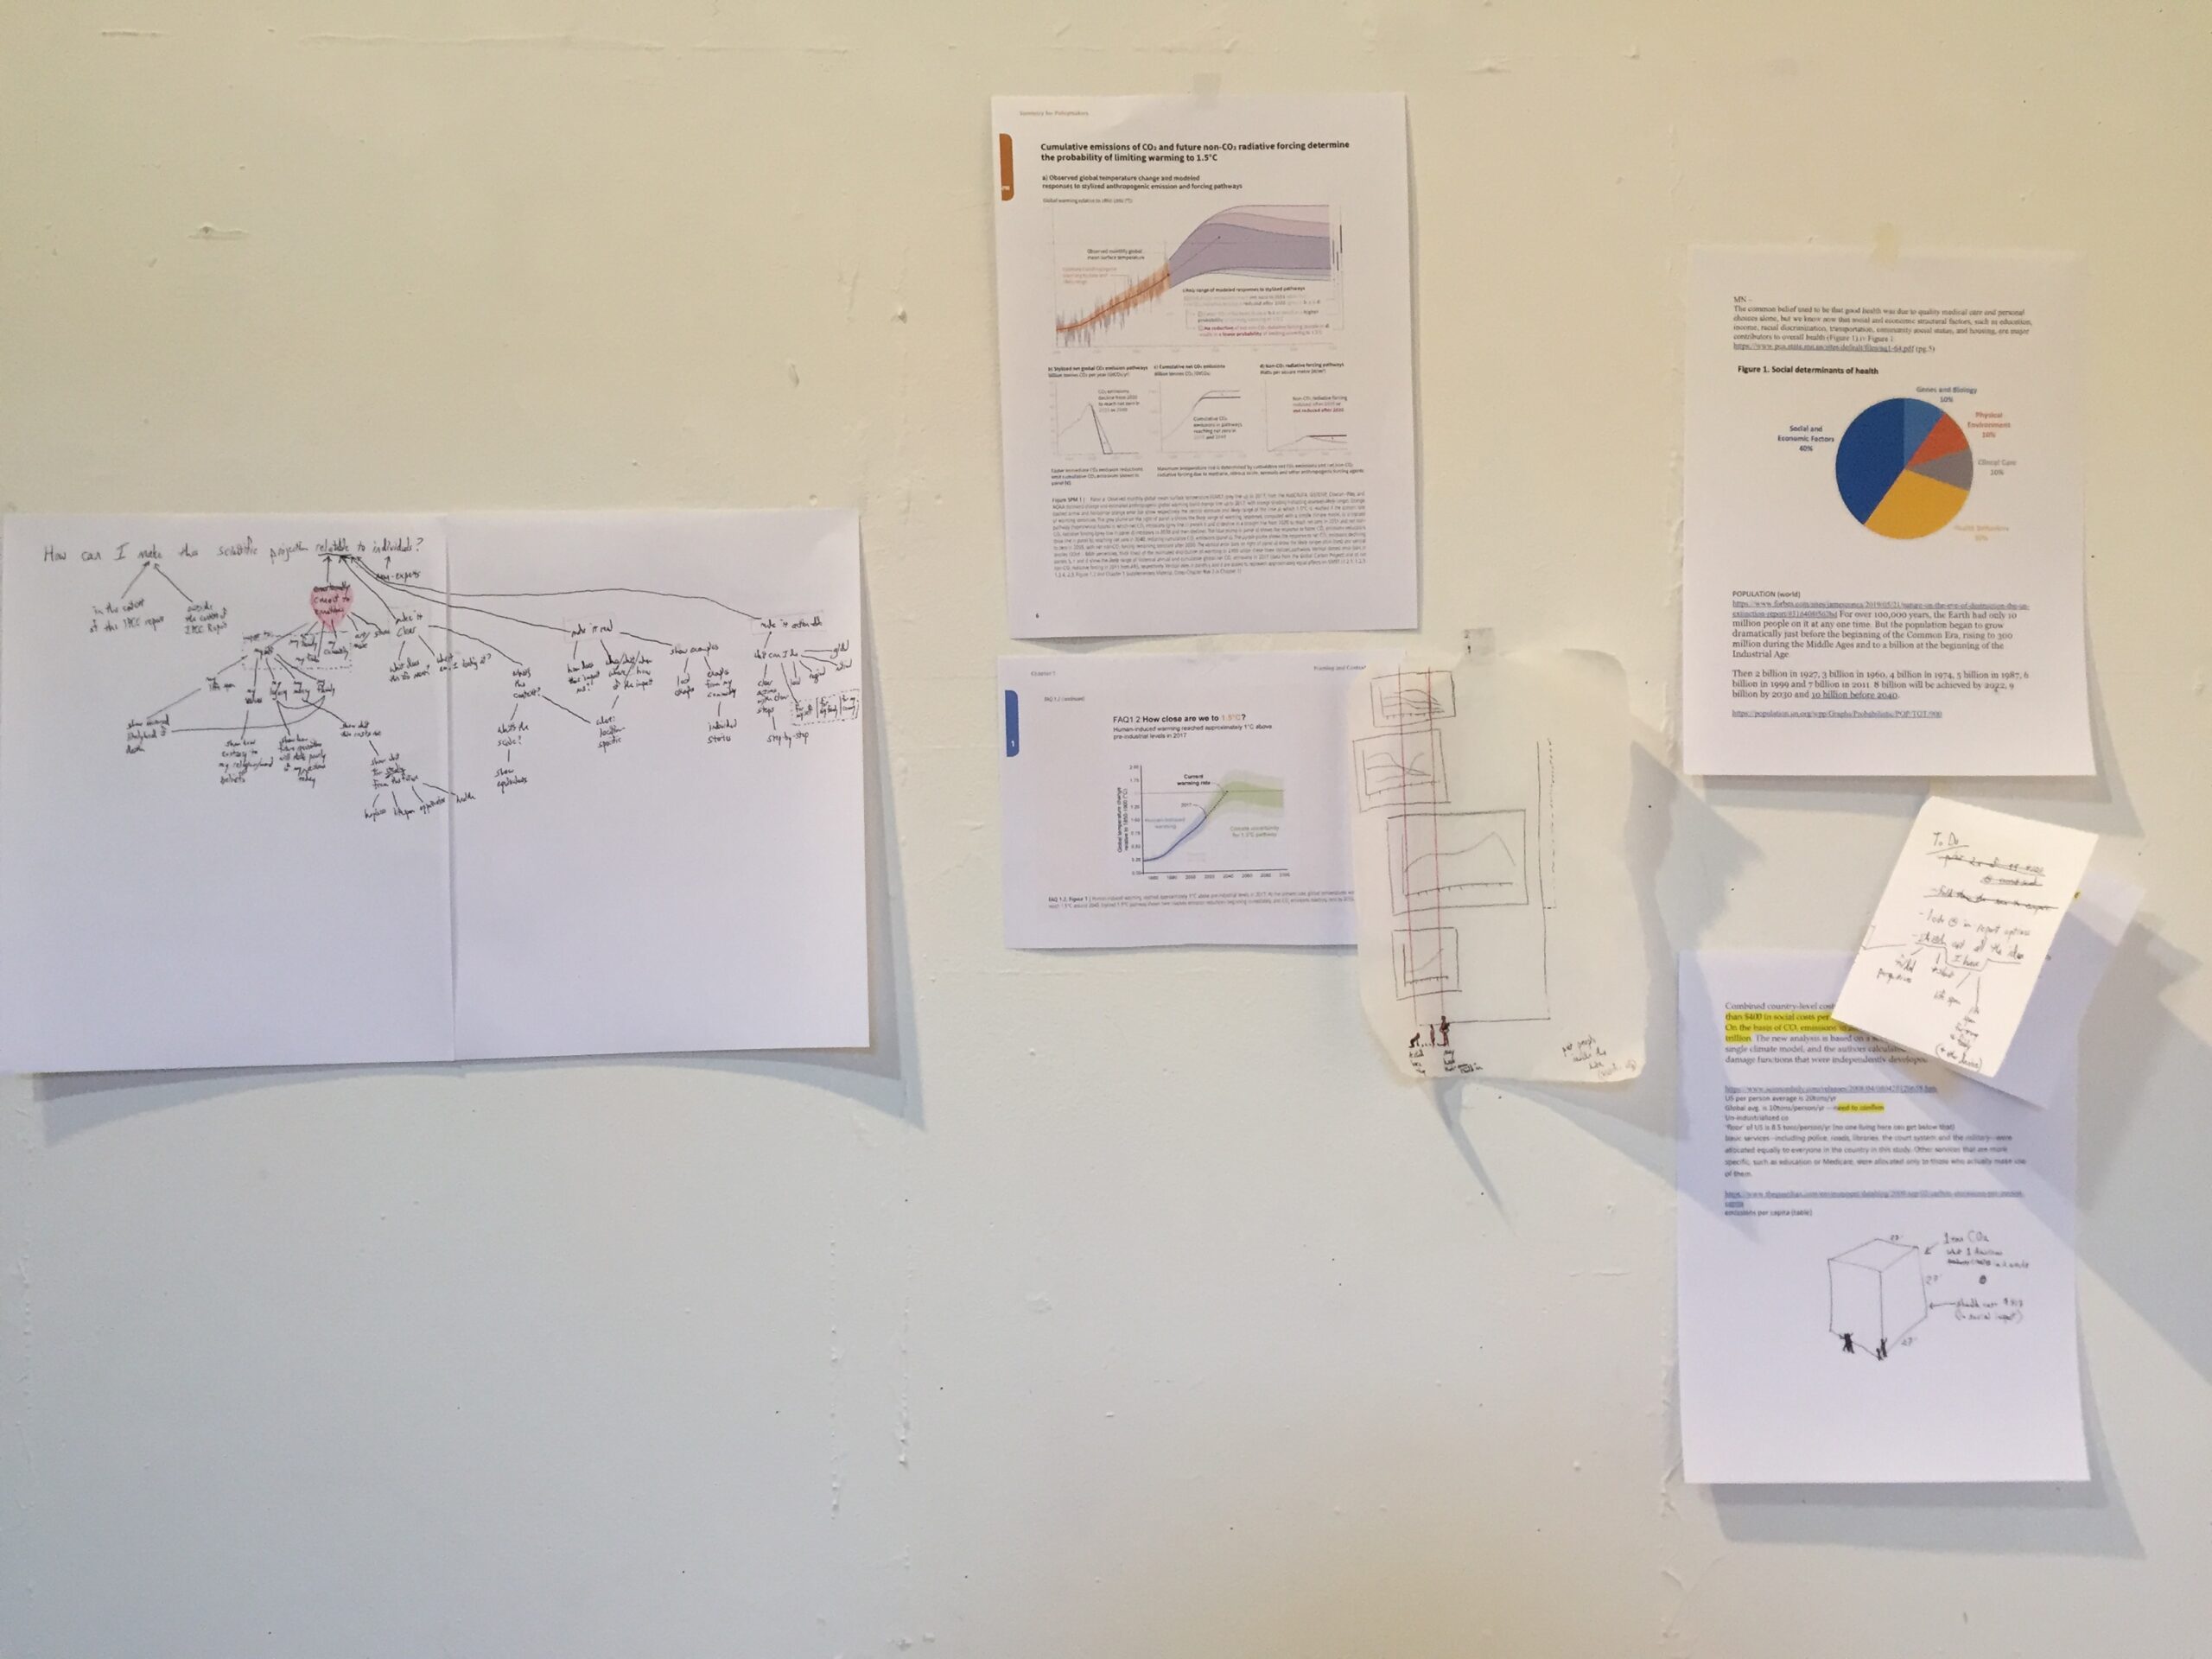
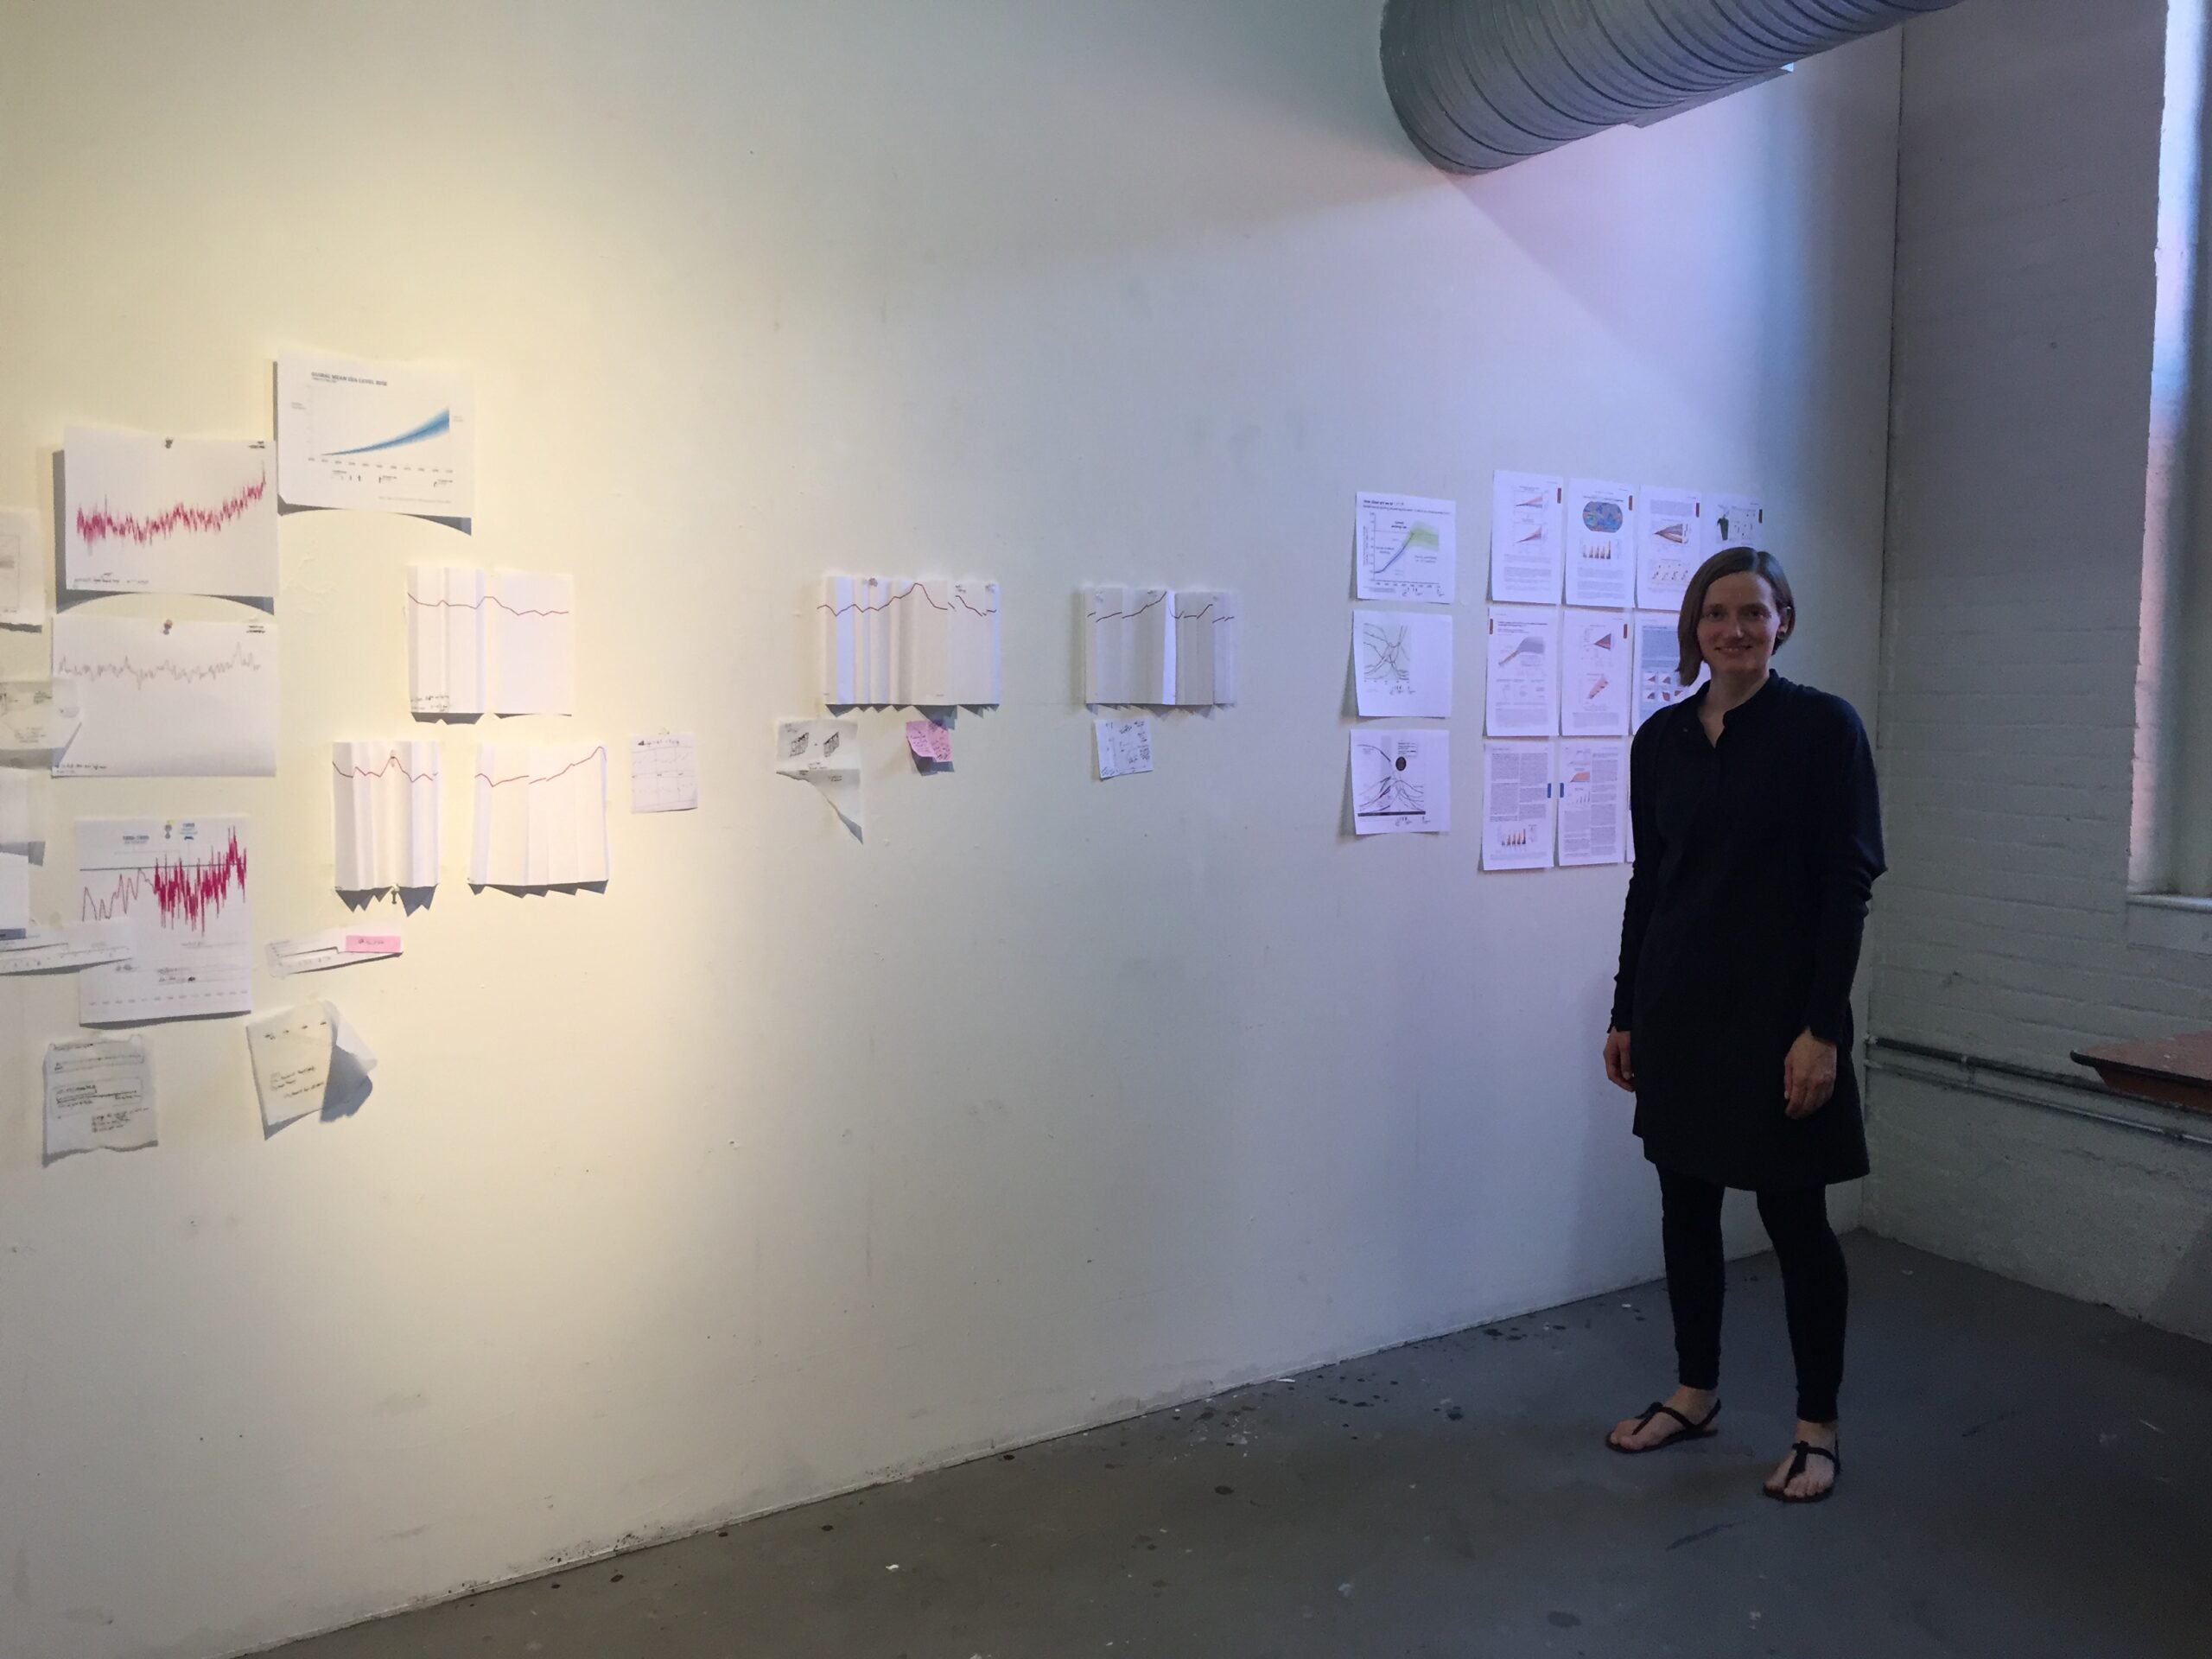
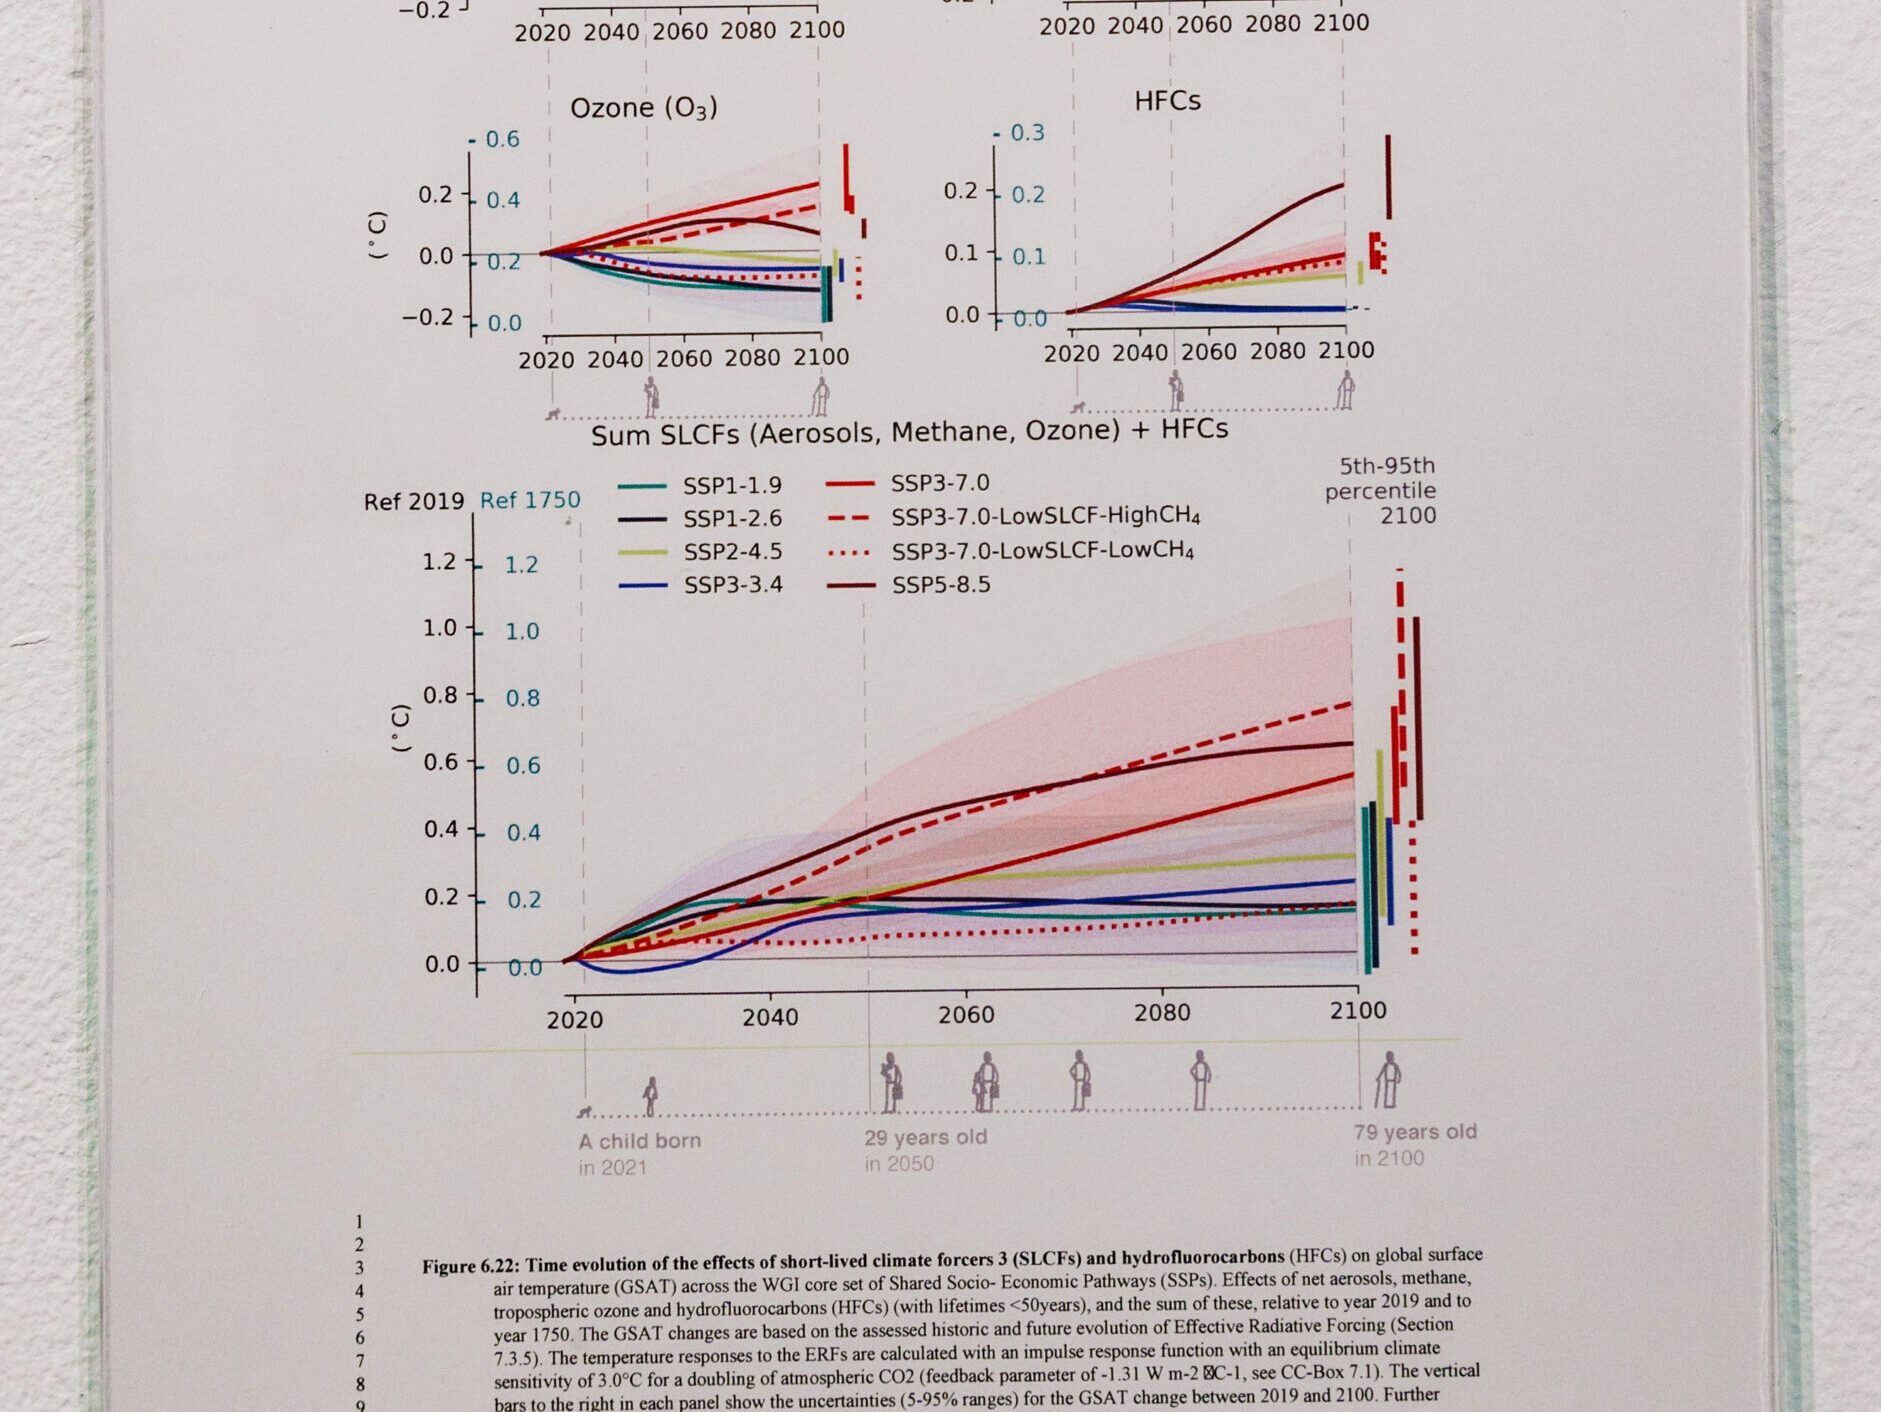
In the summer of 2019, Background Stories creative director, Arlene Birt, experimented with visuals that aligned visuals of human lifespans with climate data during an artist residency at the Massachusetts Museum of Contemporary Art (MASS MOCA). During this residency, she placed human lifespans atop the data visualizations within the UN IPCC's Special Report on 1.5°C. These visuals showing generations of 'a child born in' specific years help non-experts relate seemingly abstract data to their own lives. 

"When I mapped the generations of women in my own family, I came to tears realizing how my daughter and I will experience a very different world — much different than my grandmother and great-grandmother," Birt said.  

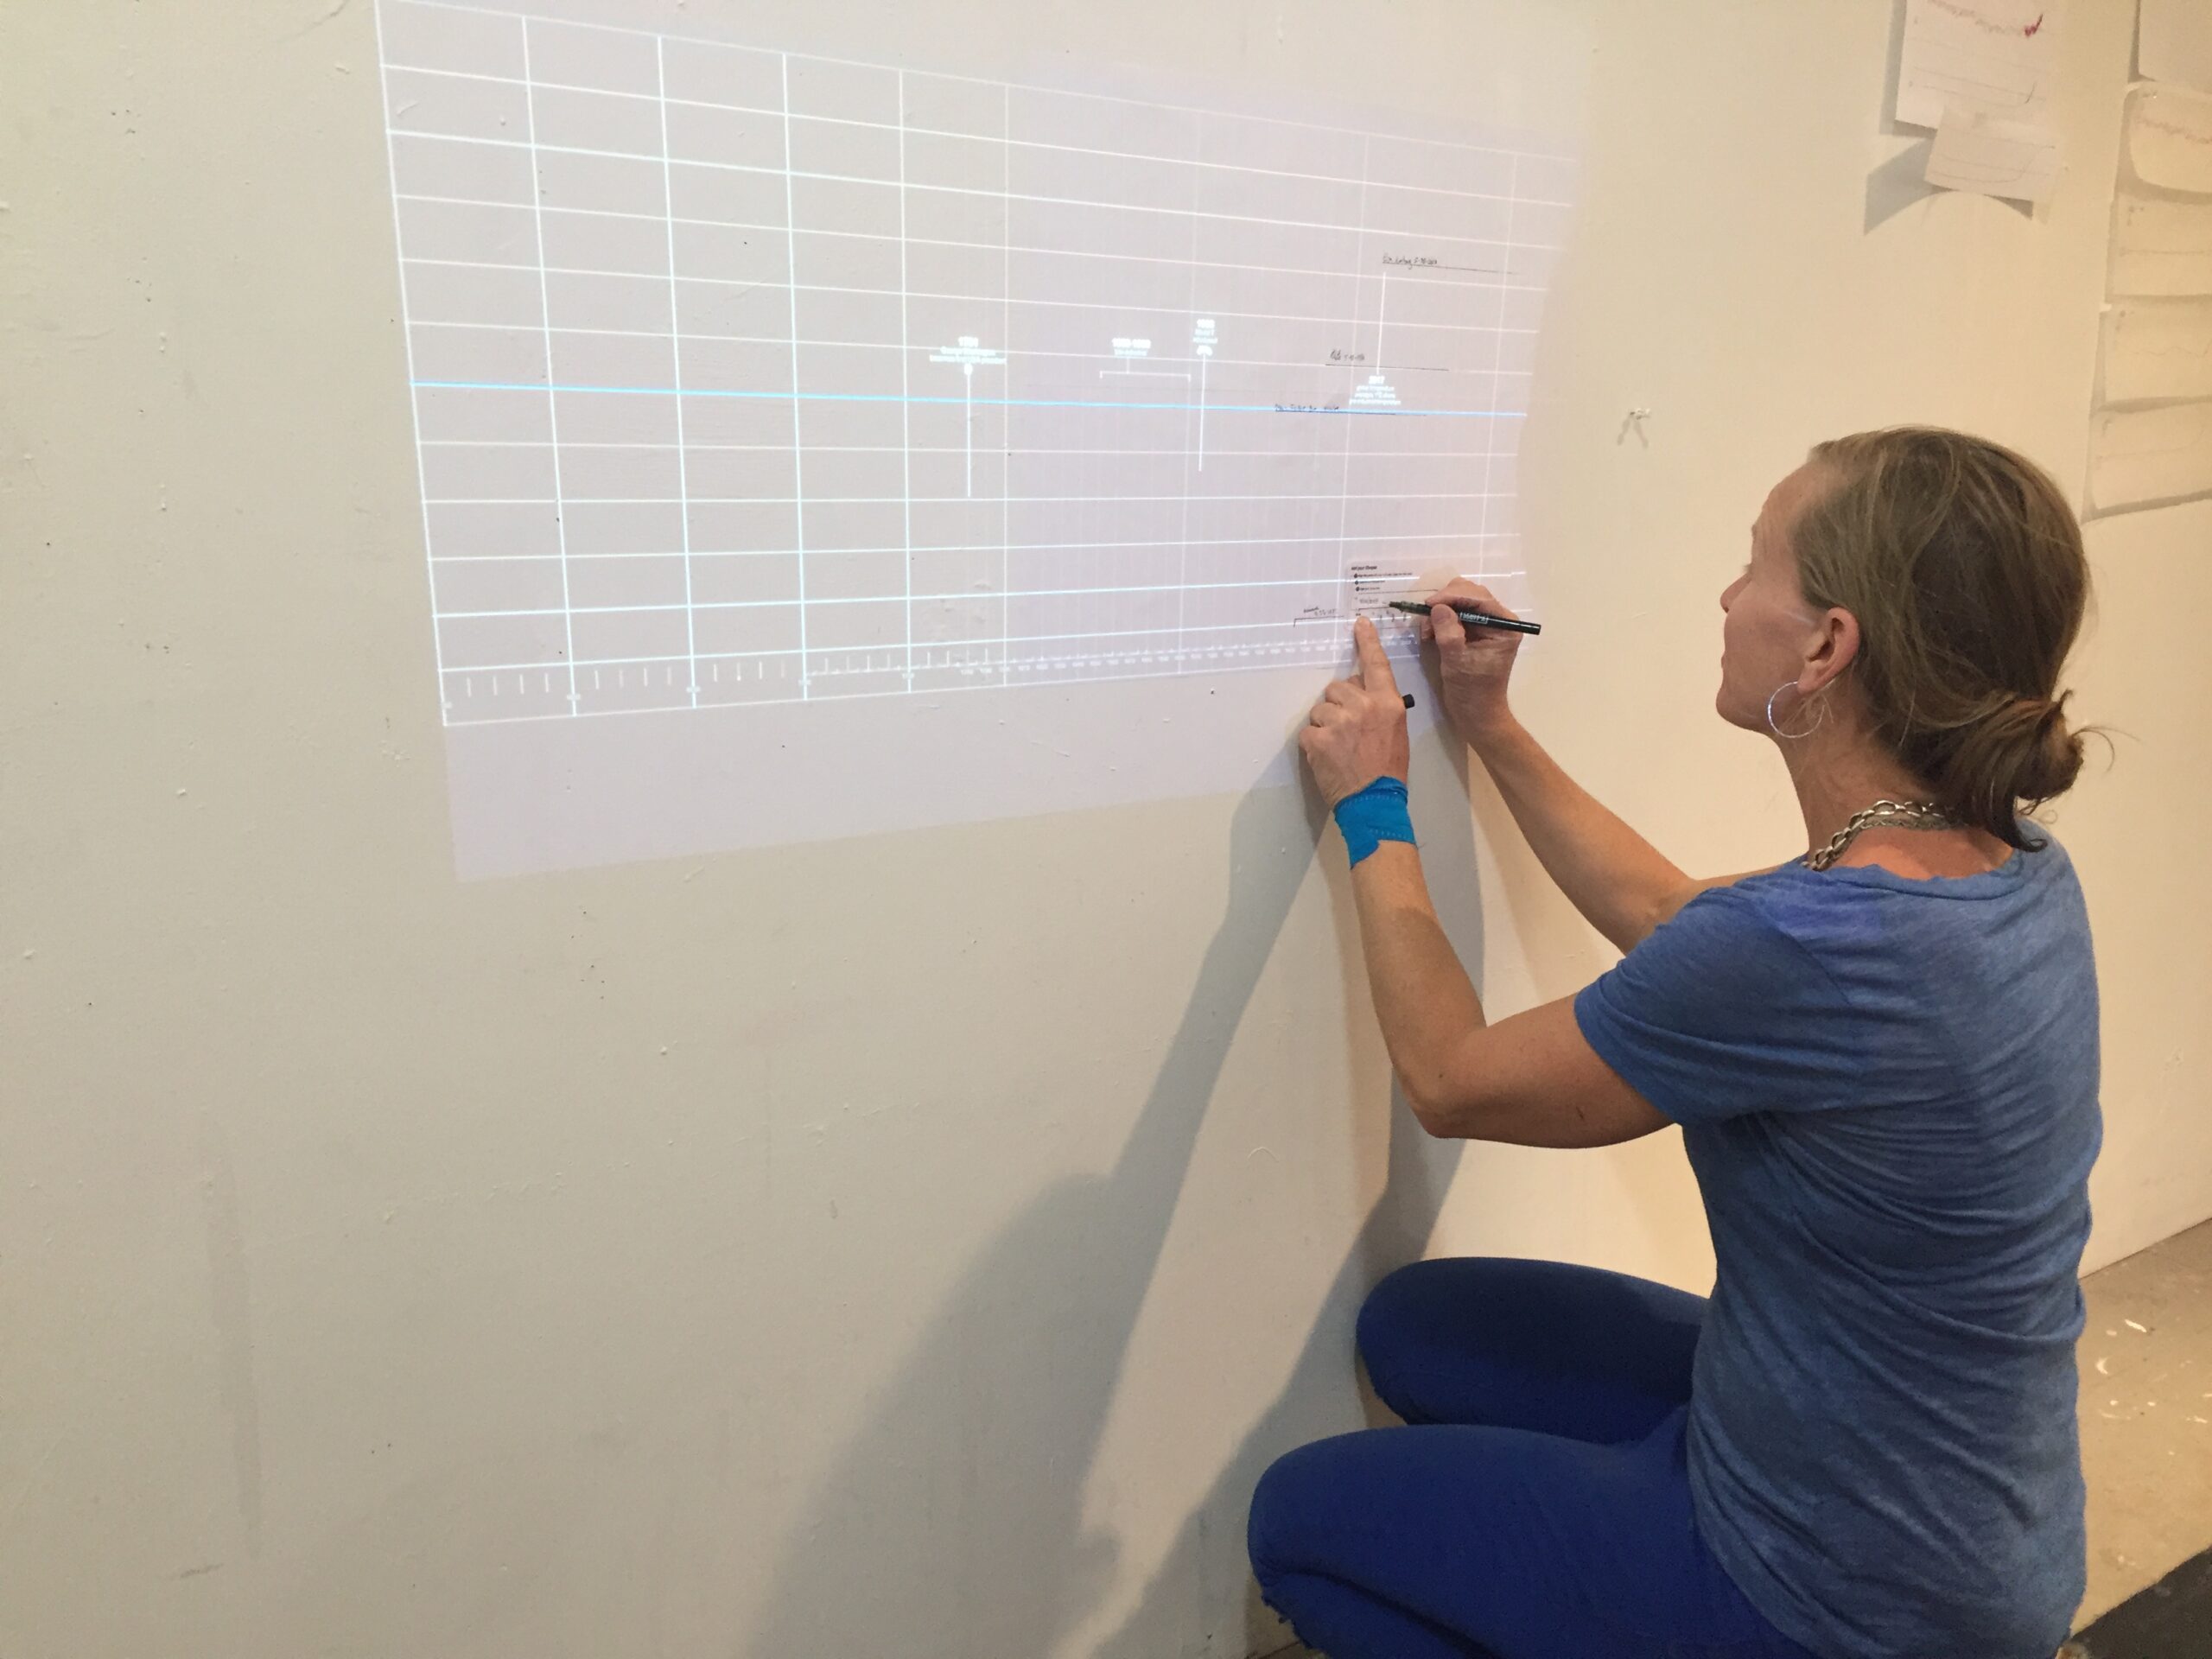
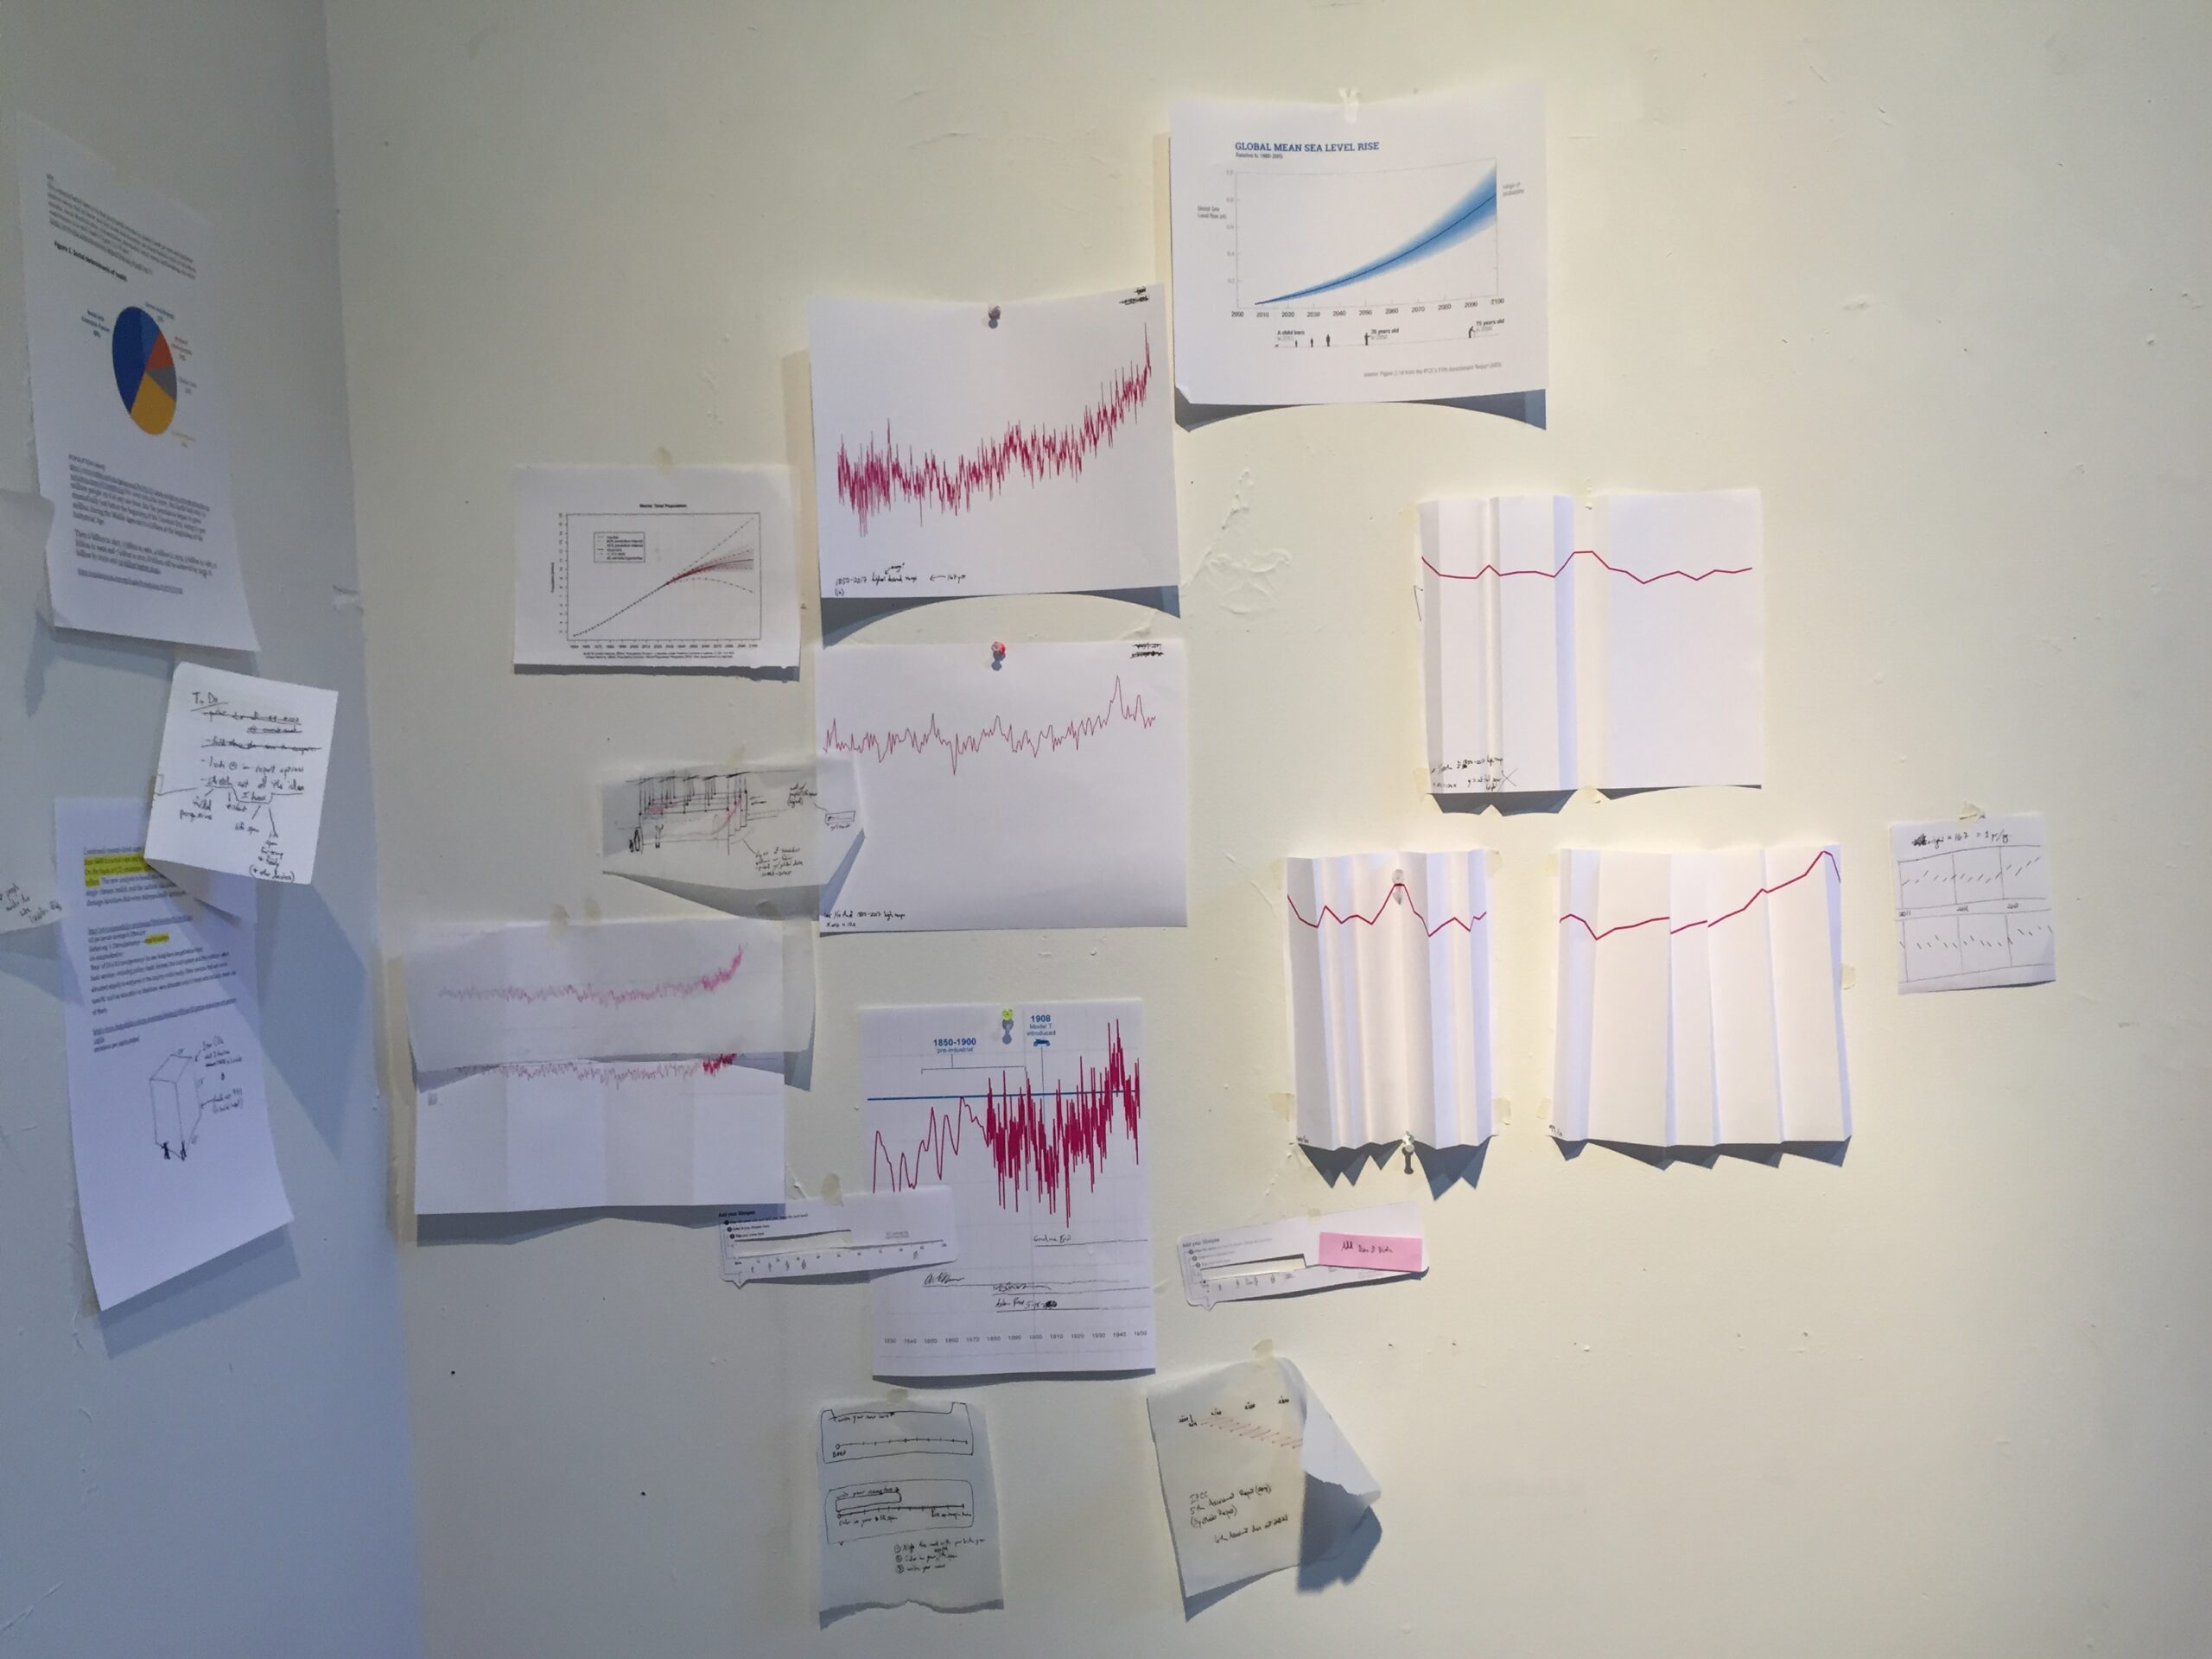
Additional experiments during the residency included using digital projection to map generations of Birt's own family tree (and other participants) through data like temperature change, CO2 emissions levels, sea level rise, and population growth.

Birt's family tree overlaid on a graph of world average temperature.

2019 (Fall)

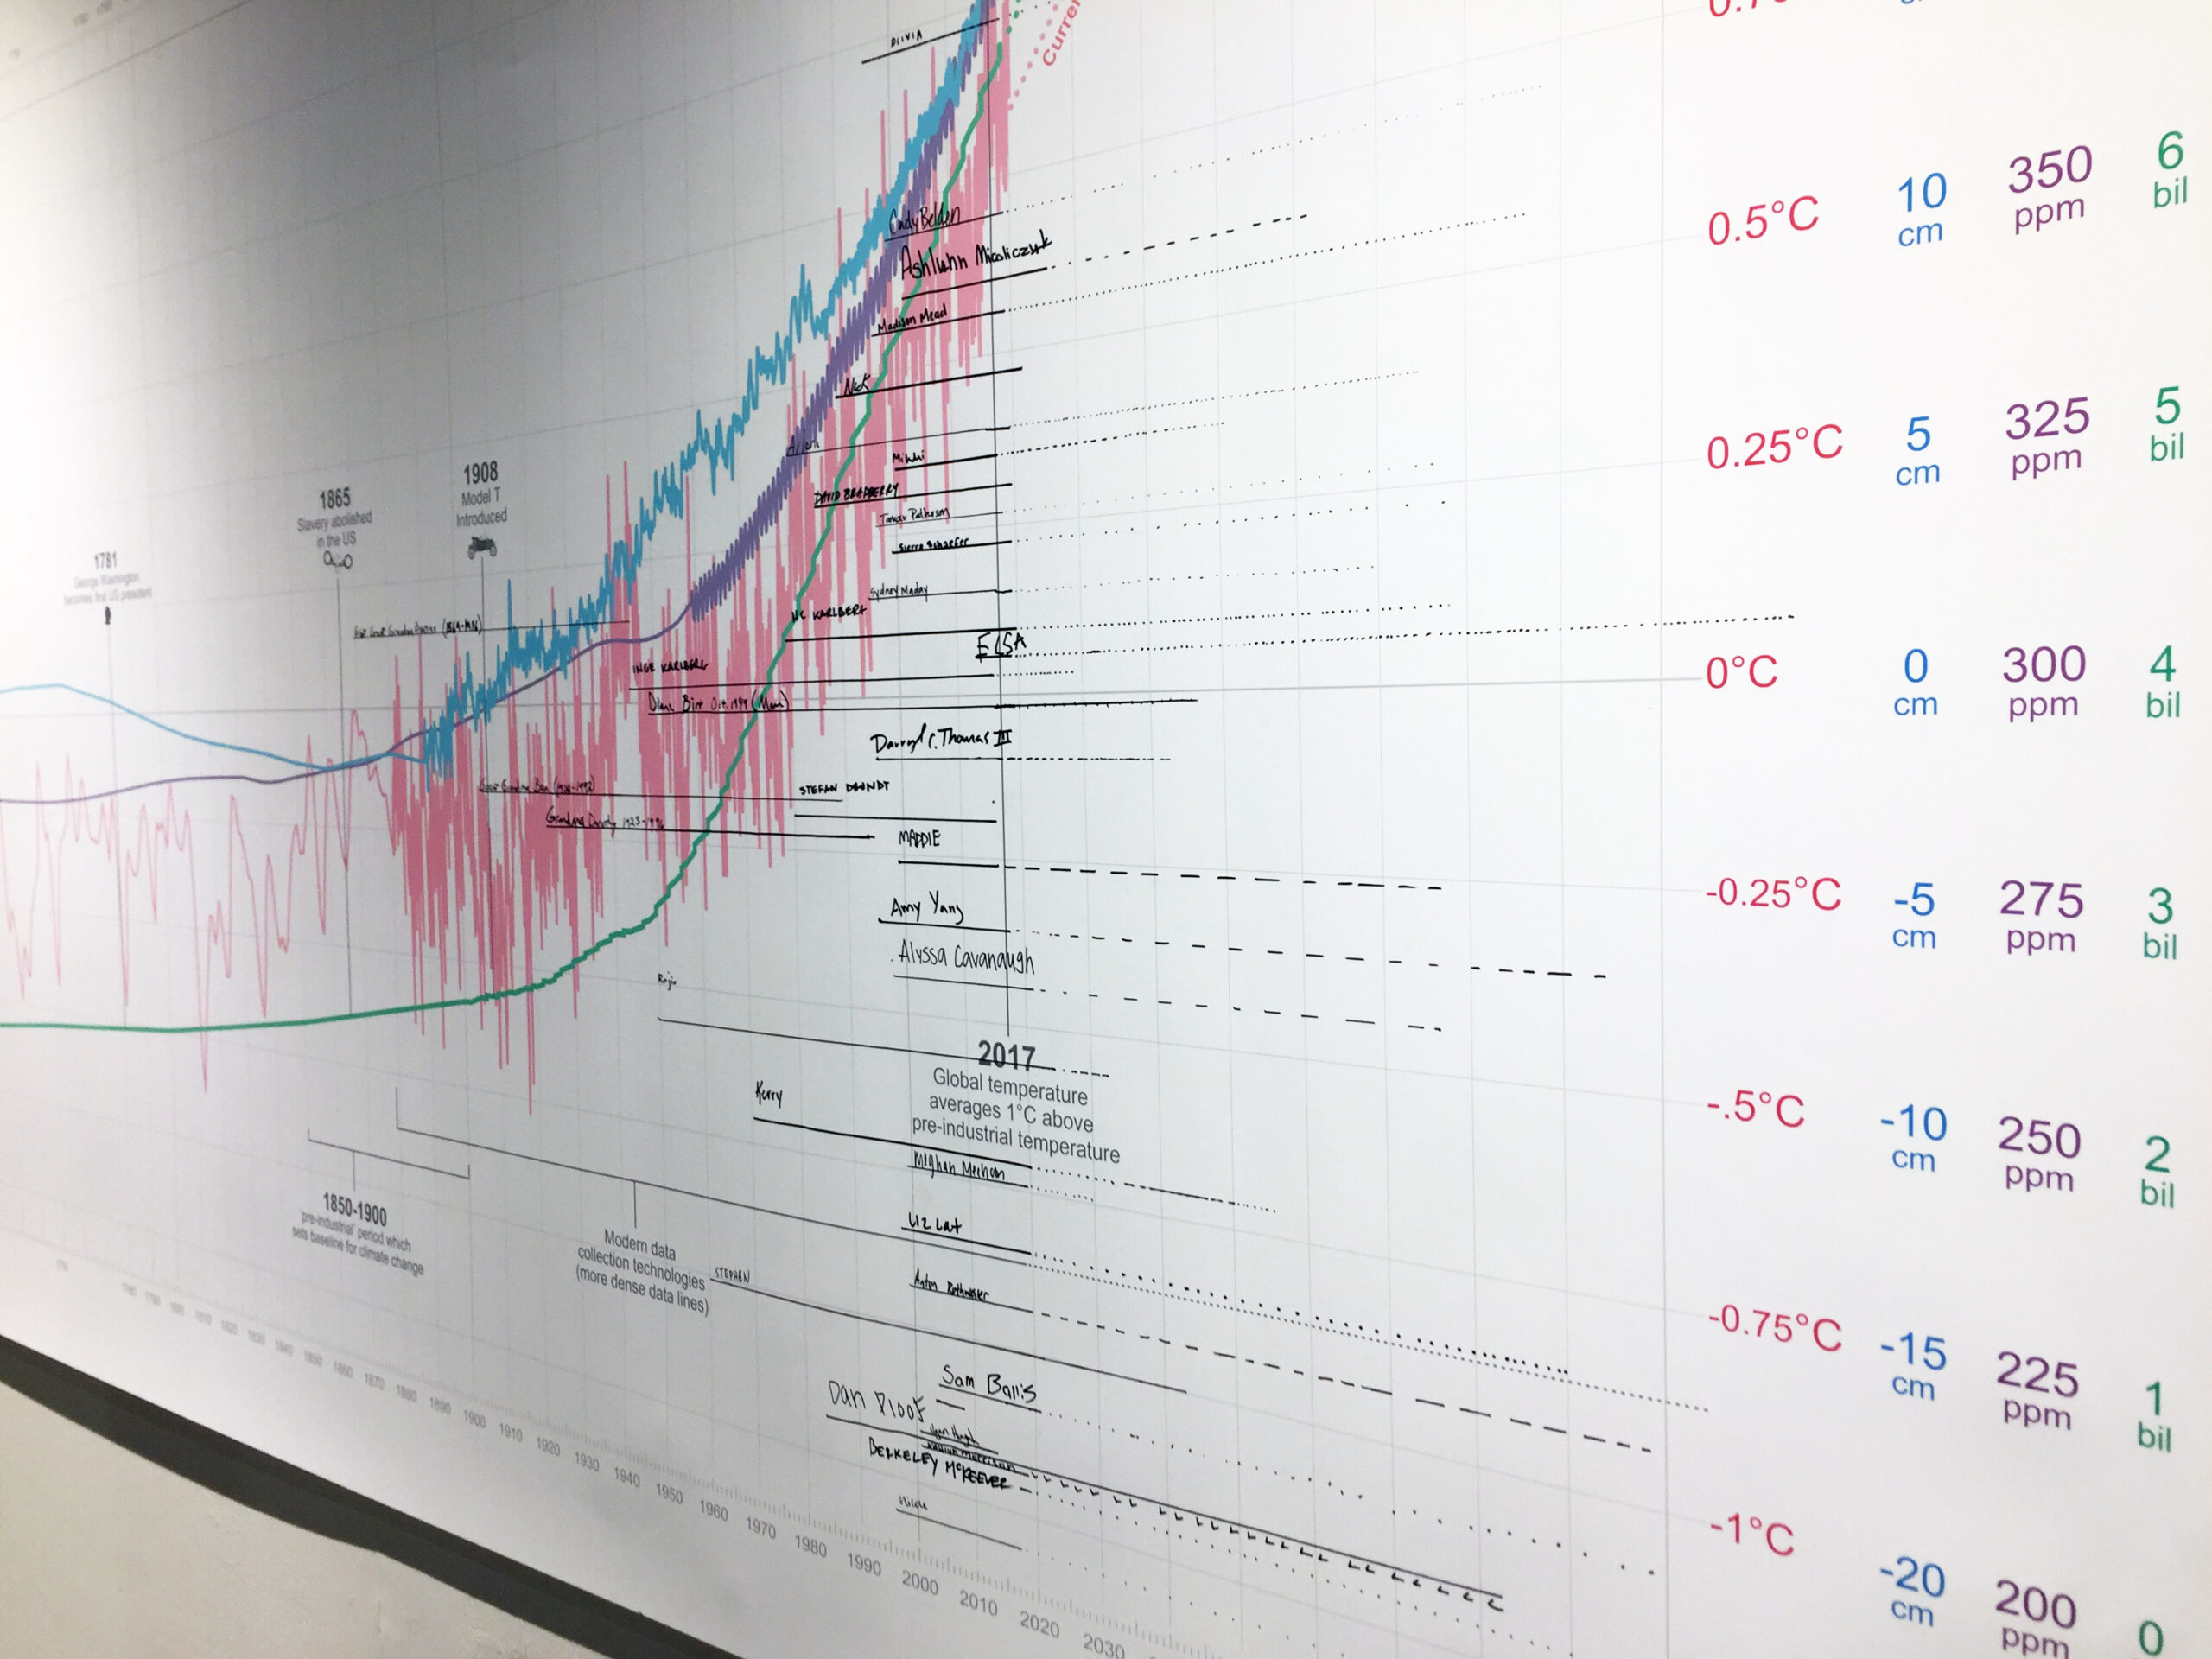
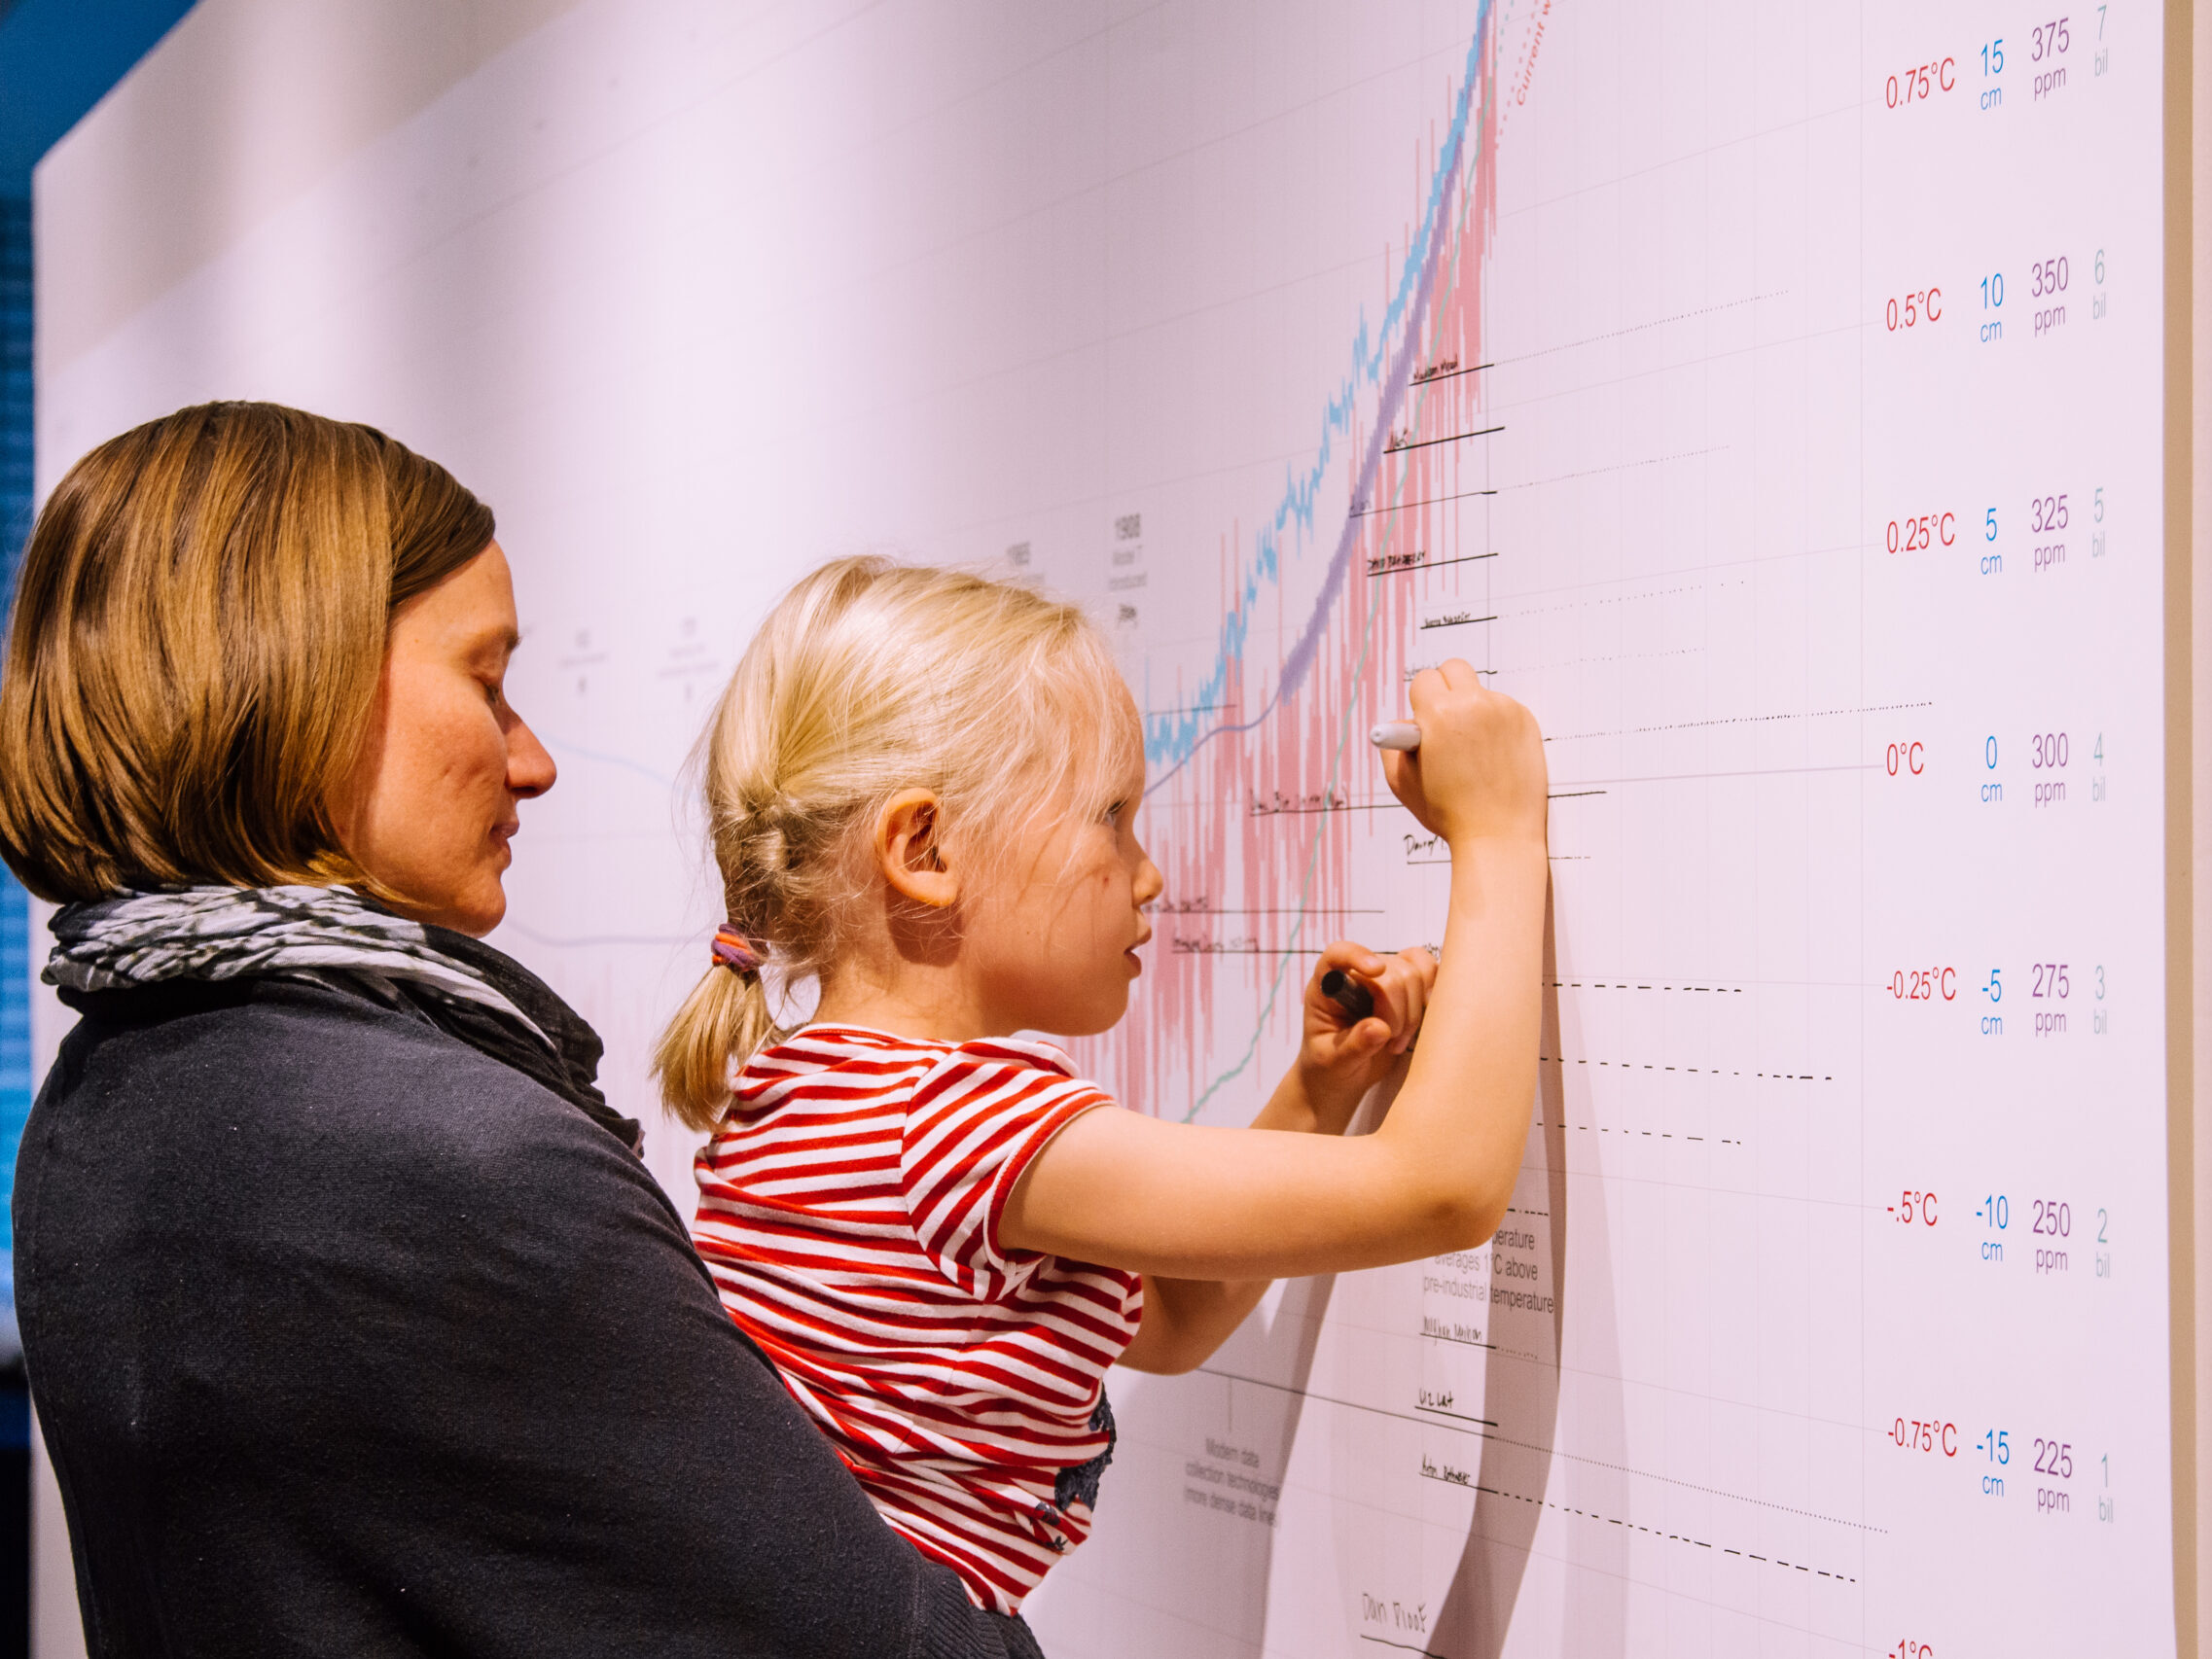
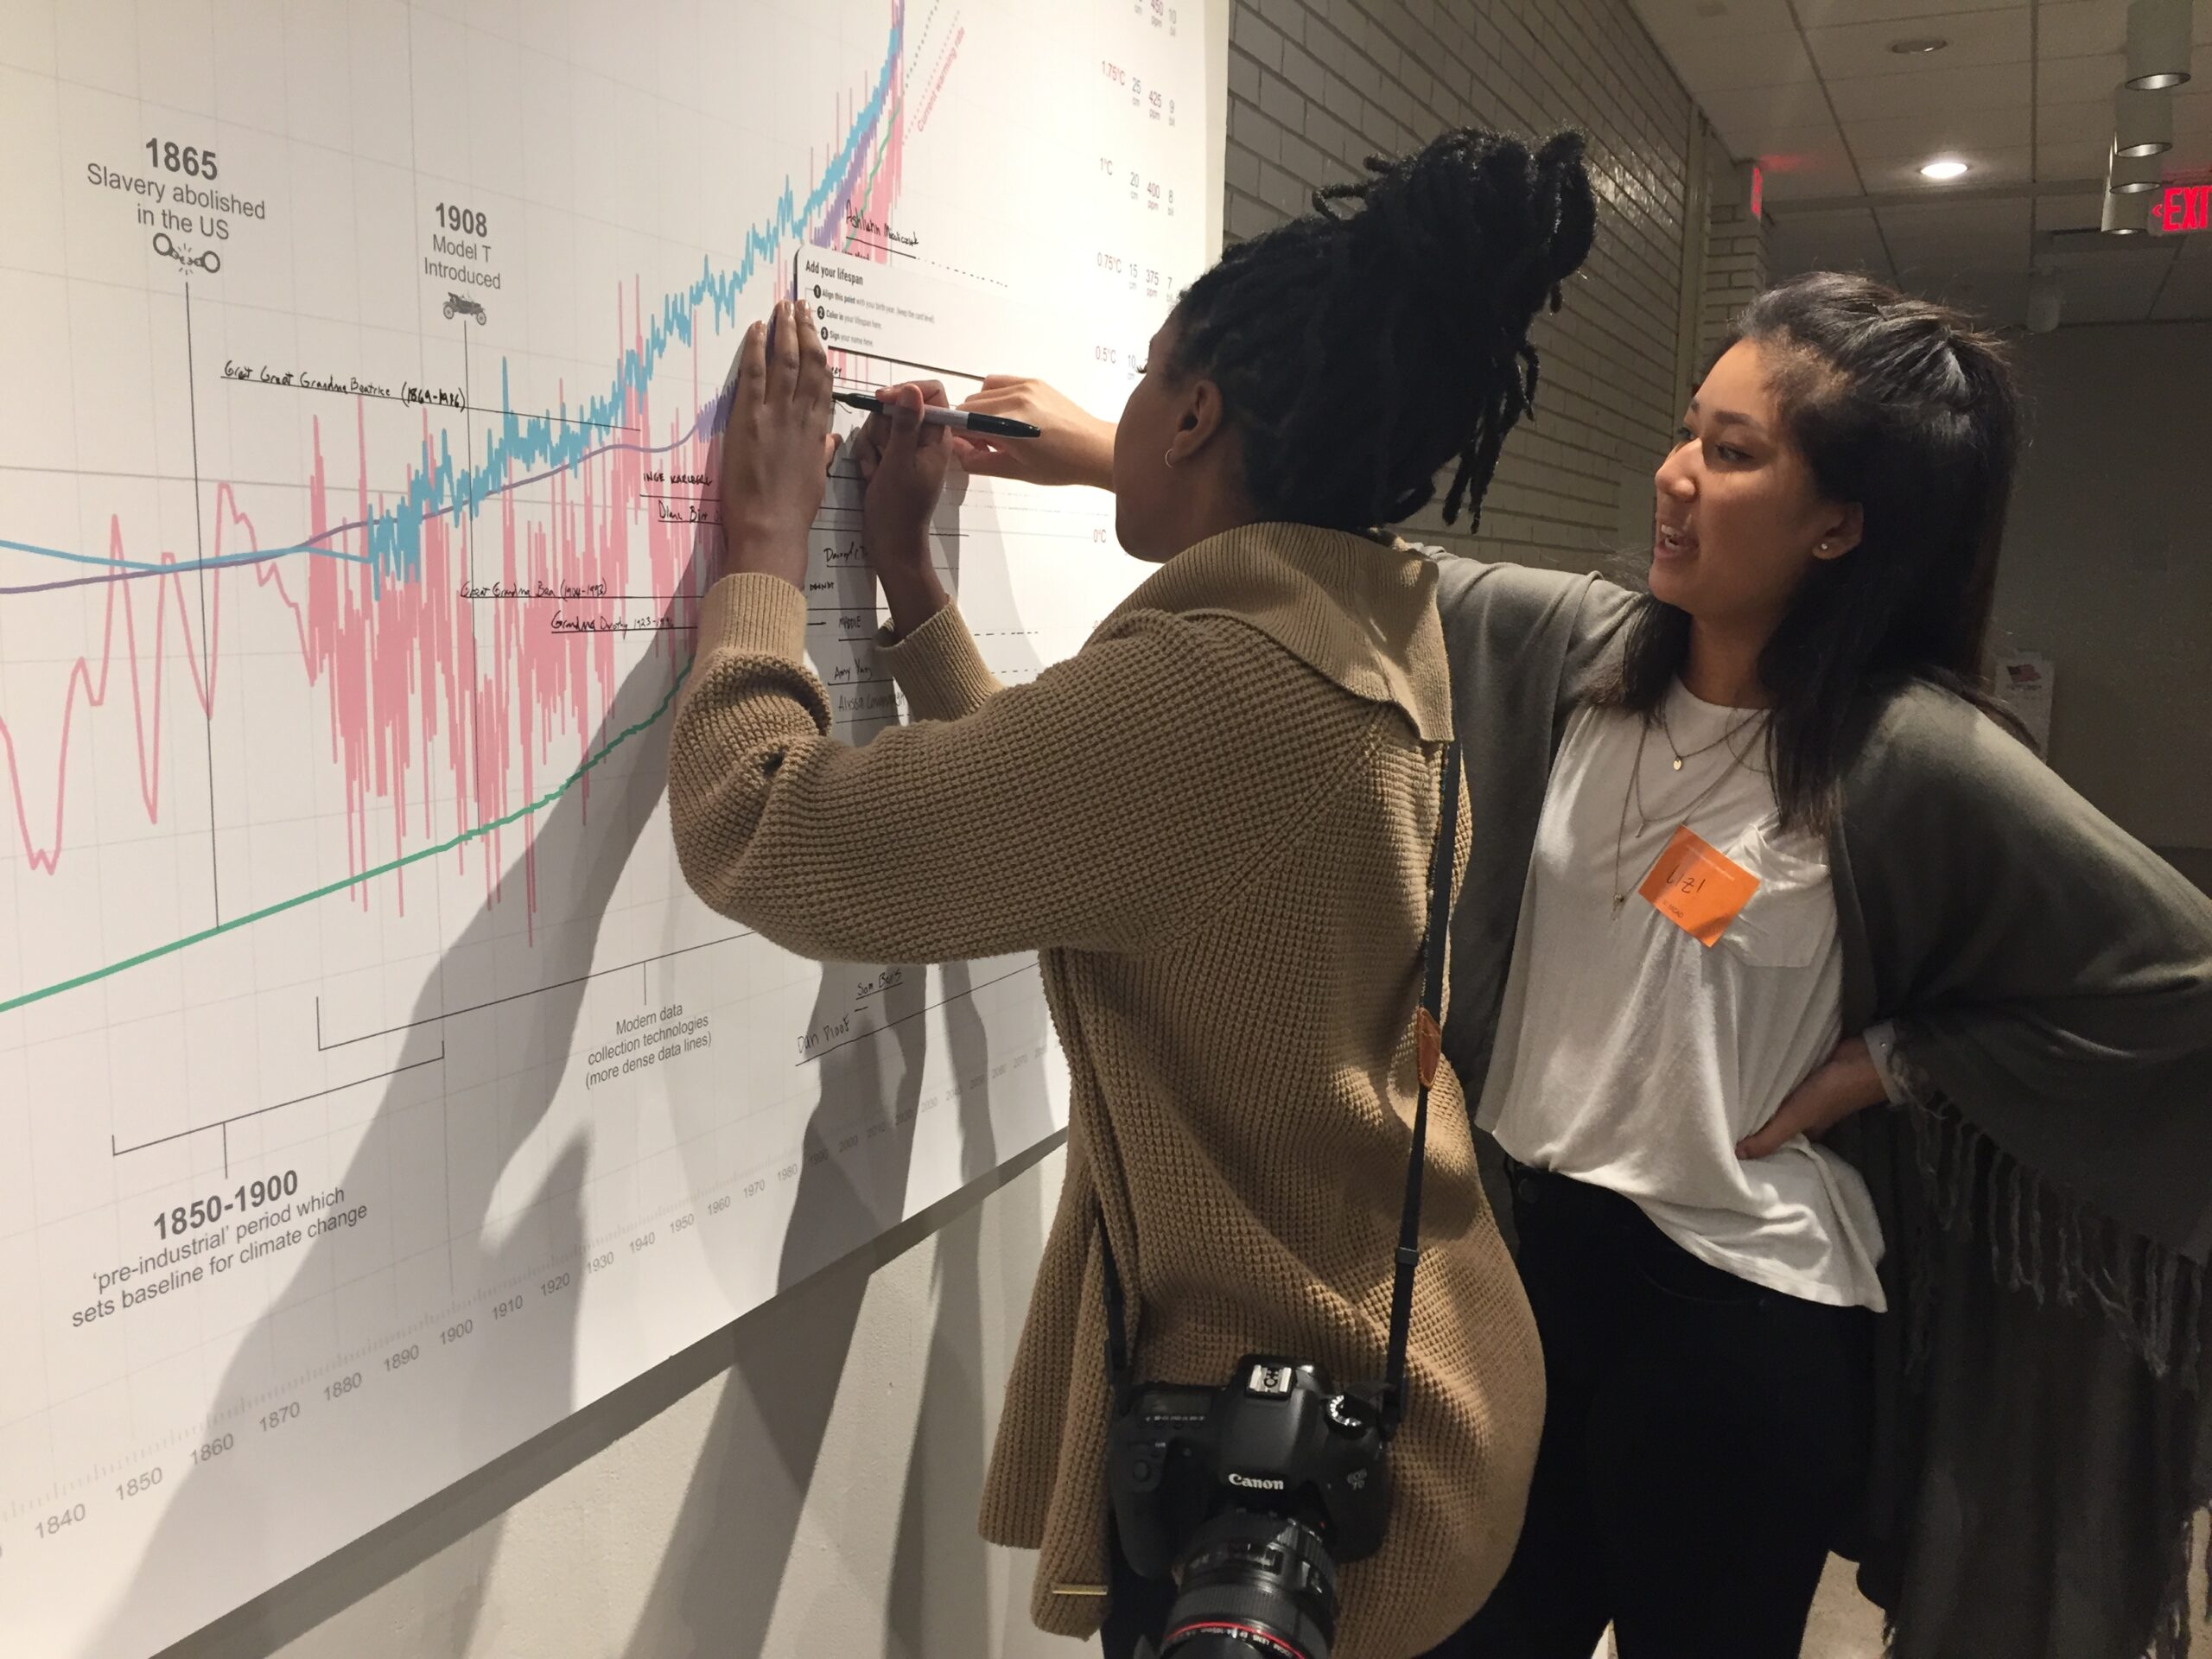
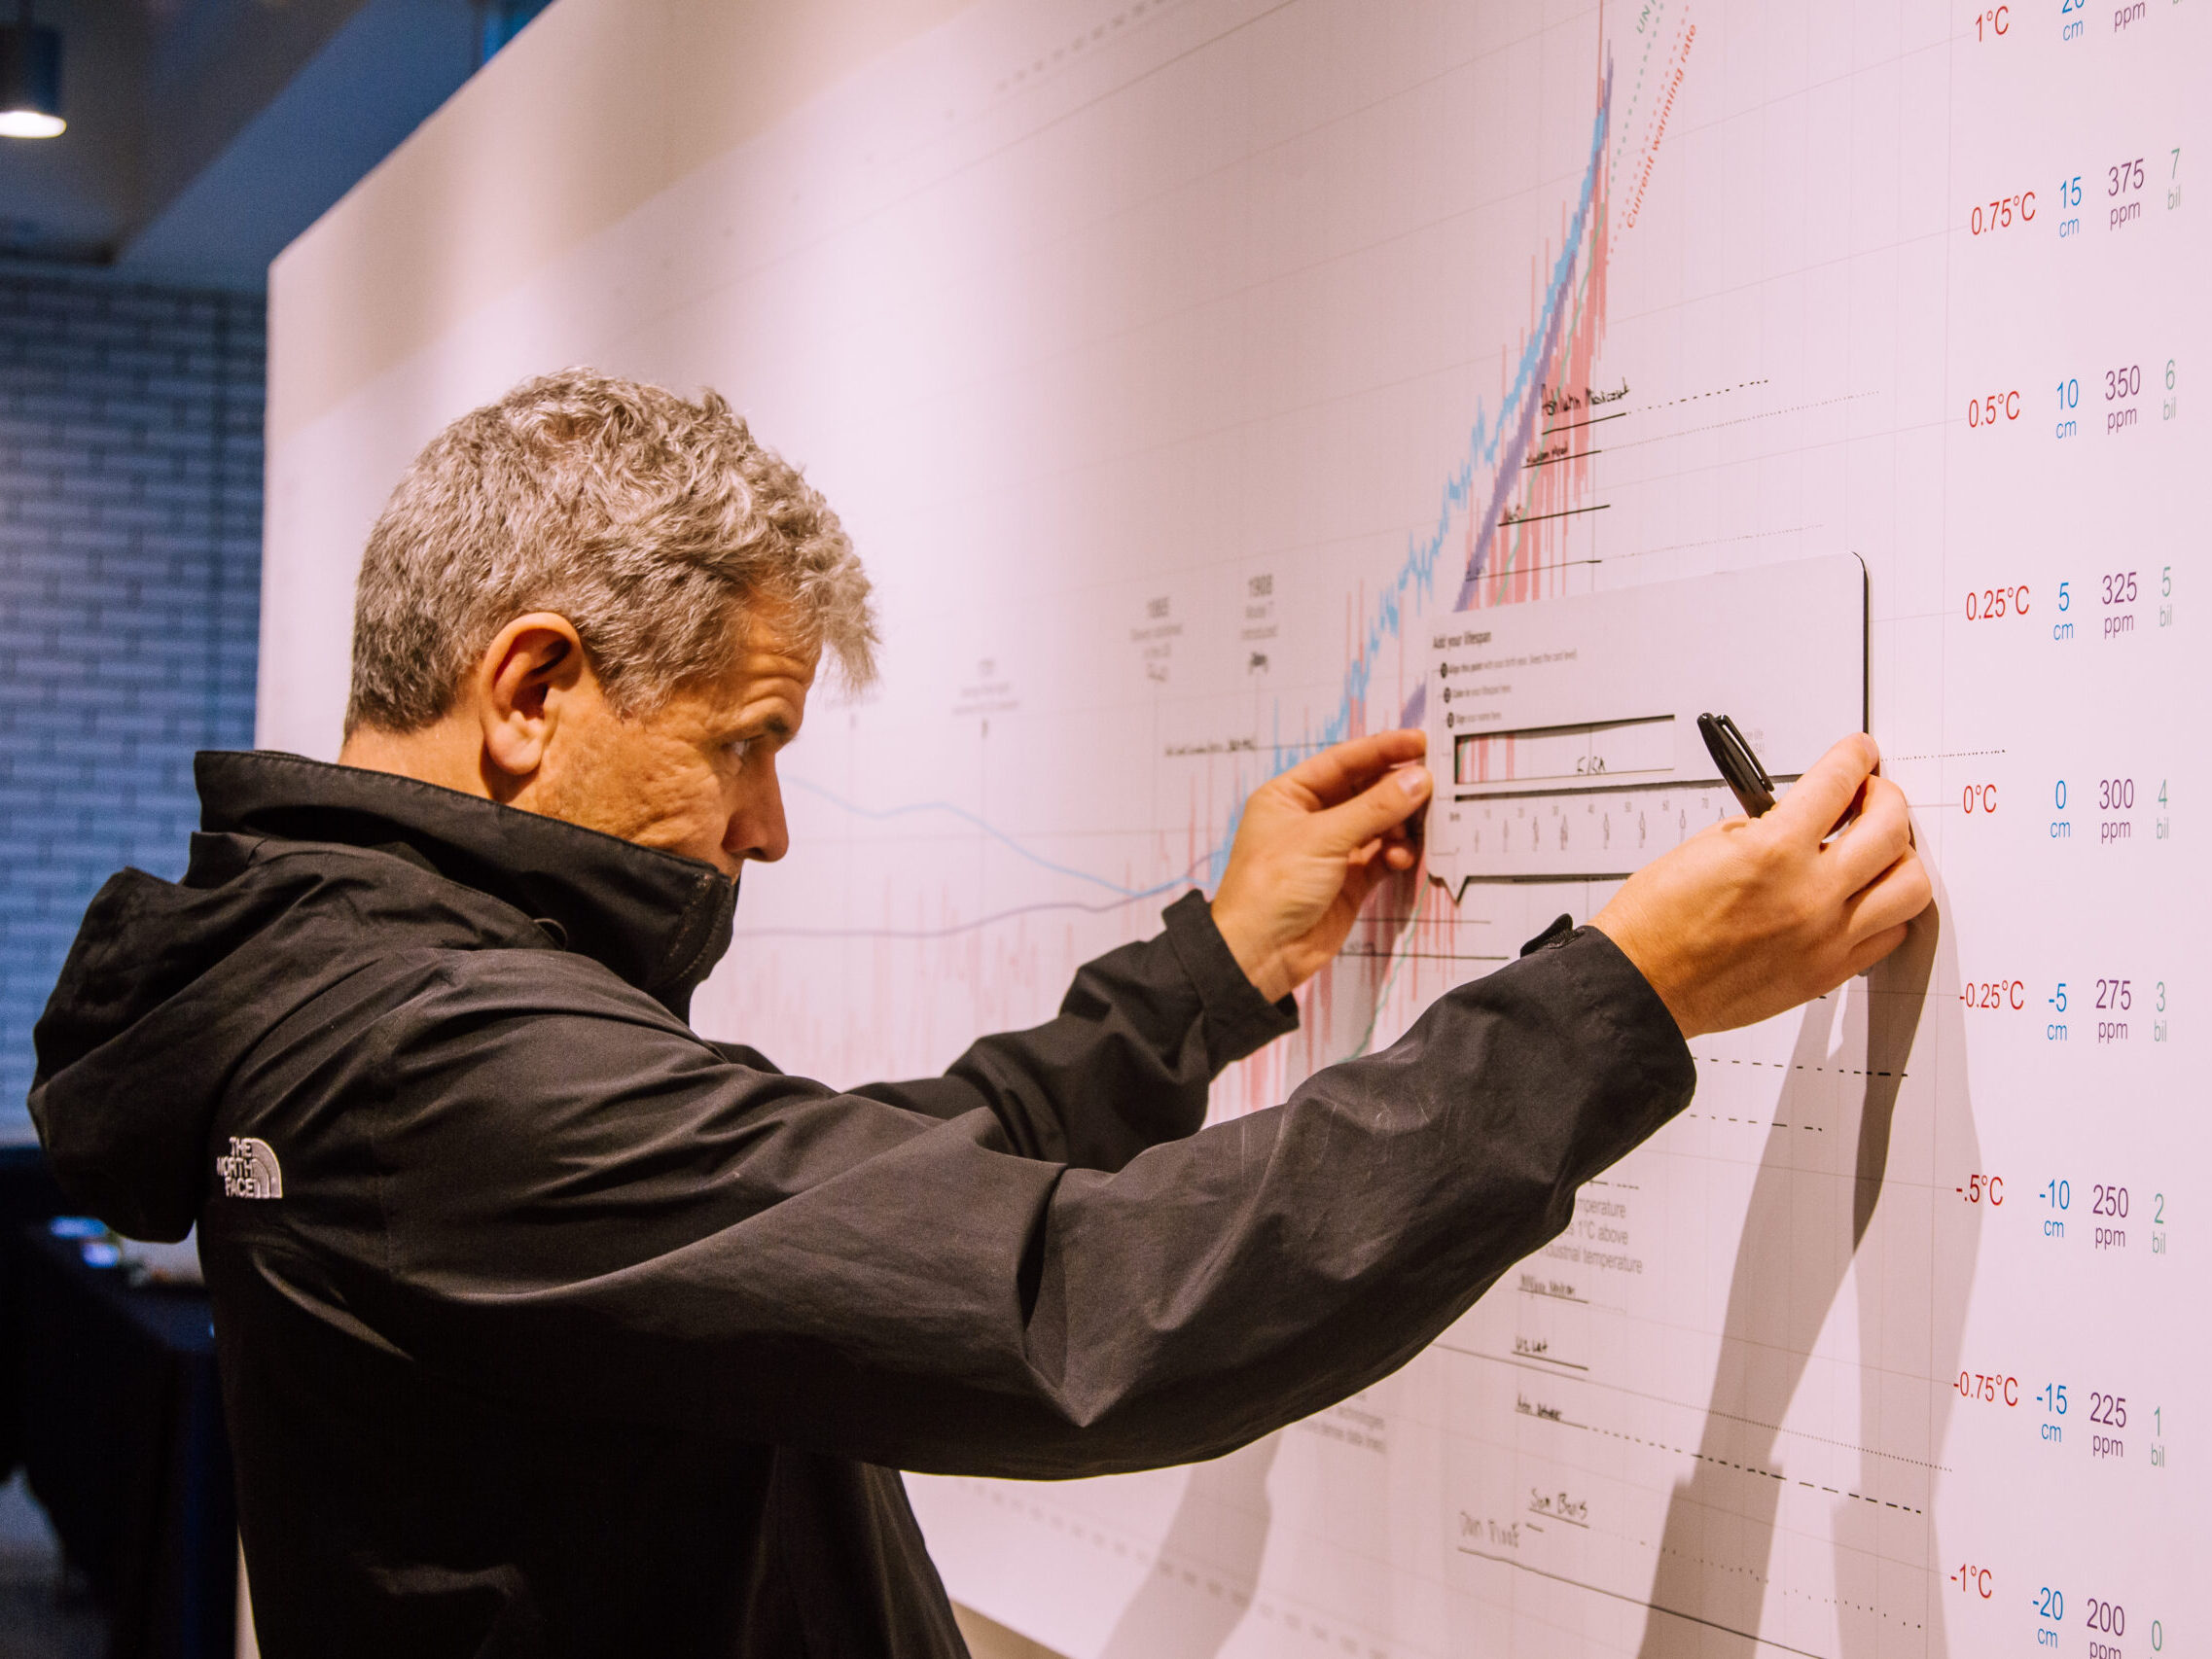
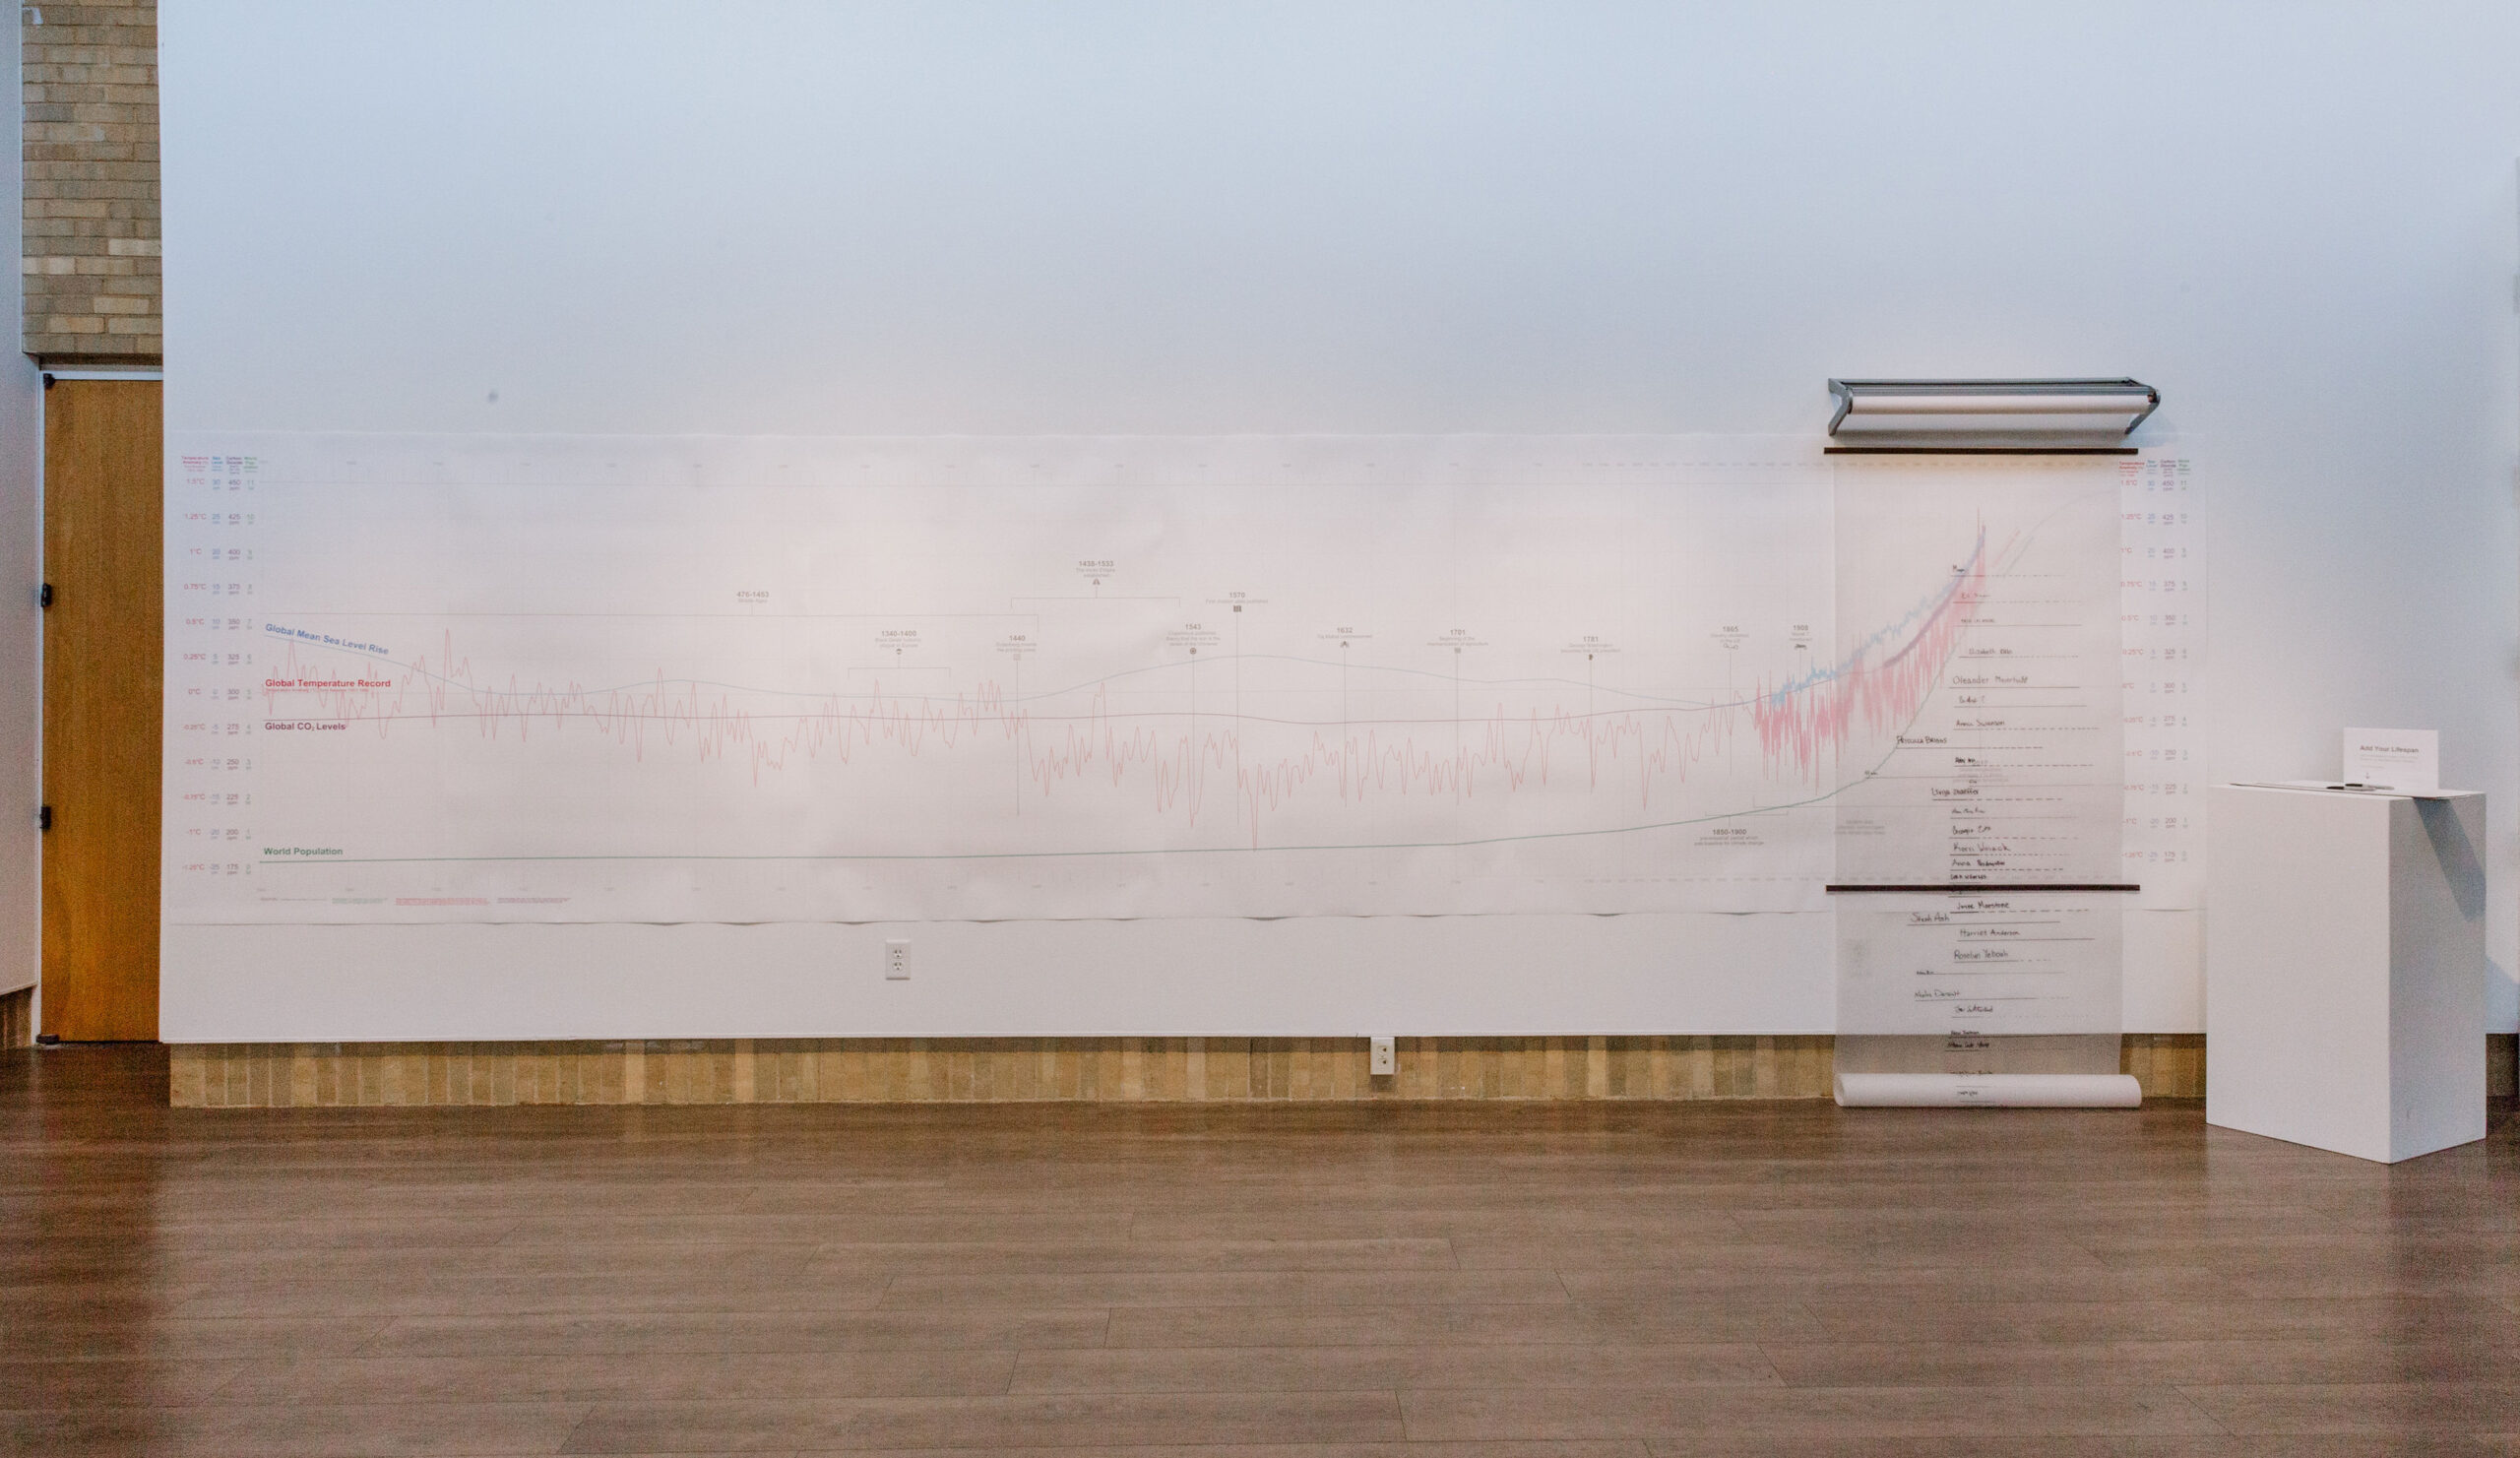
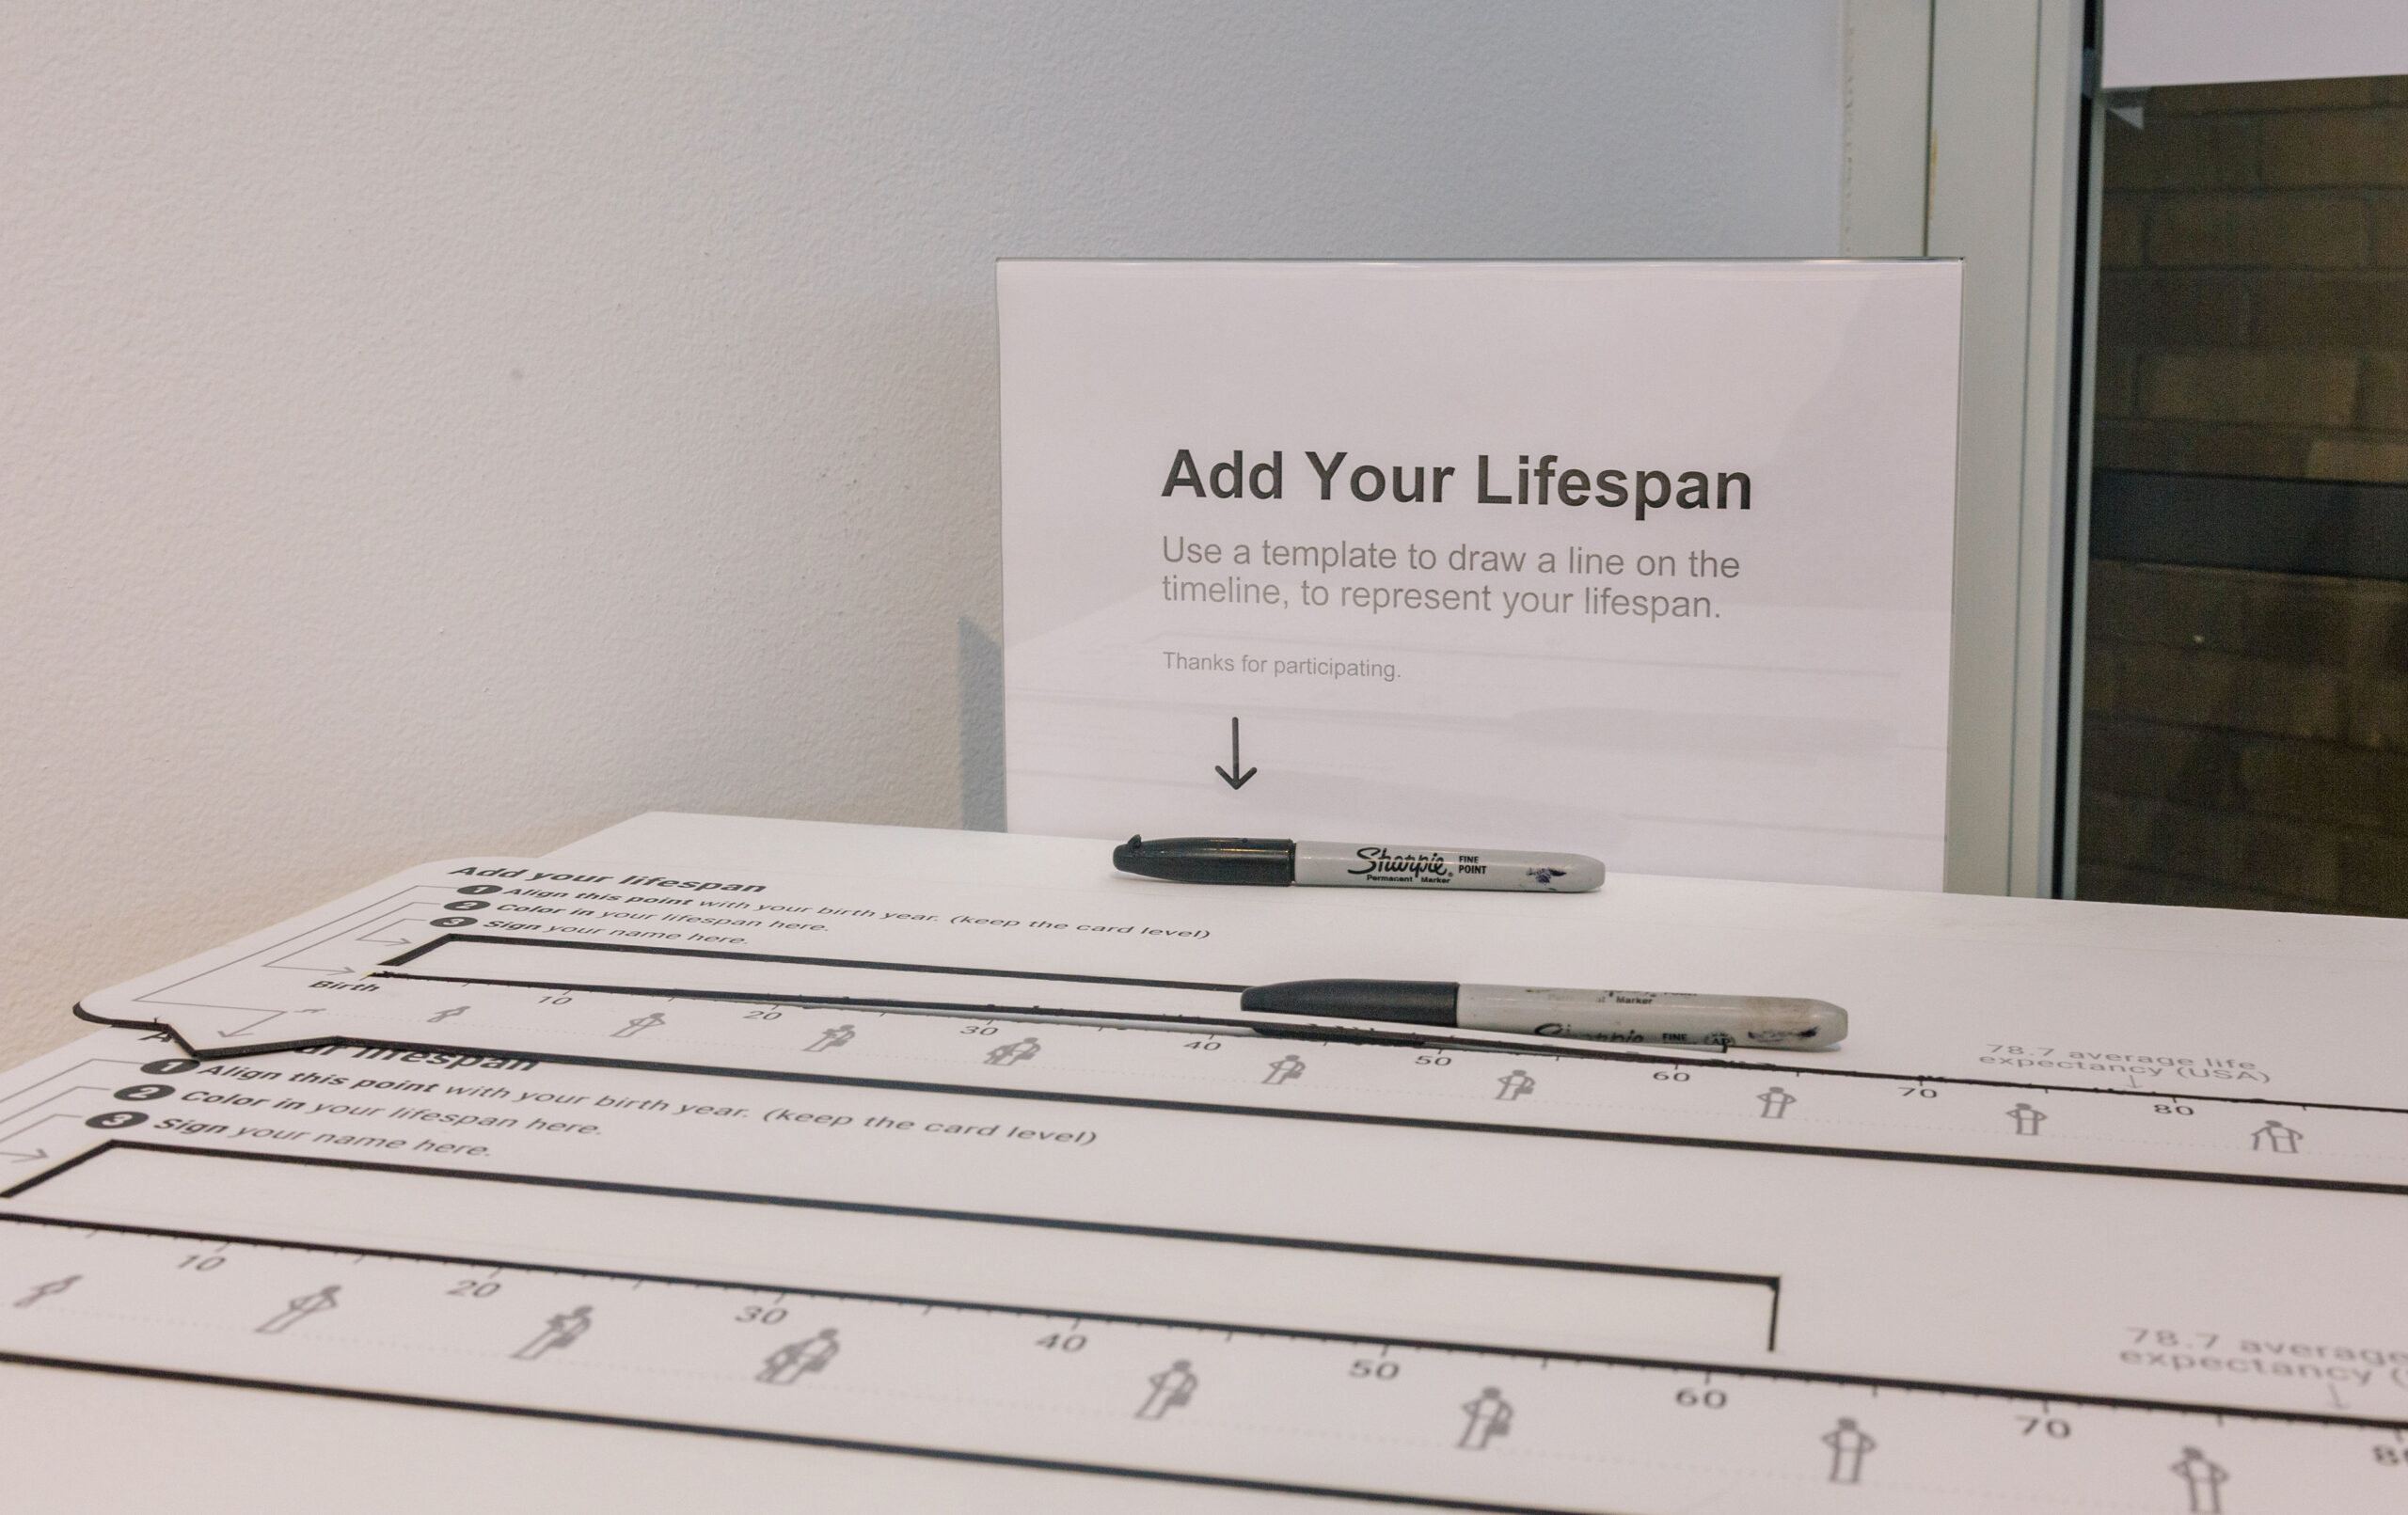
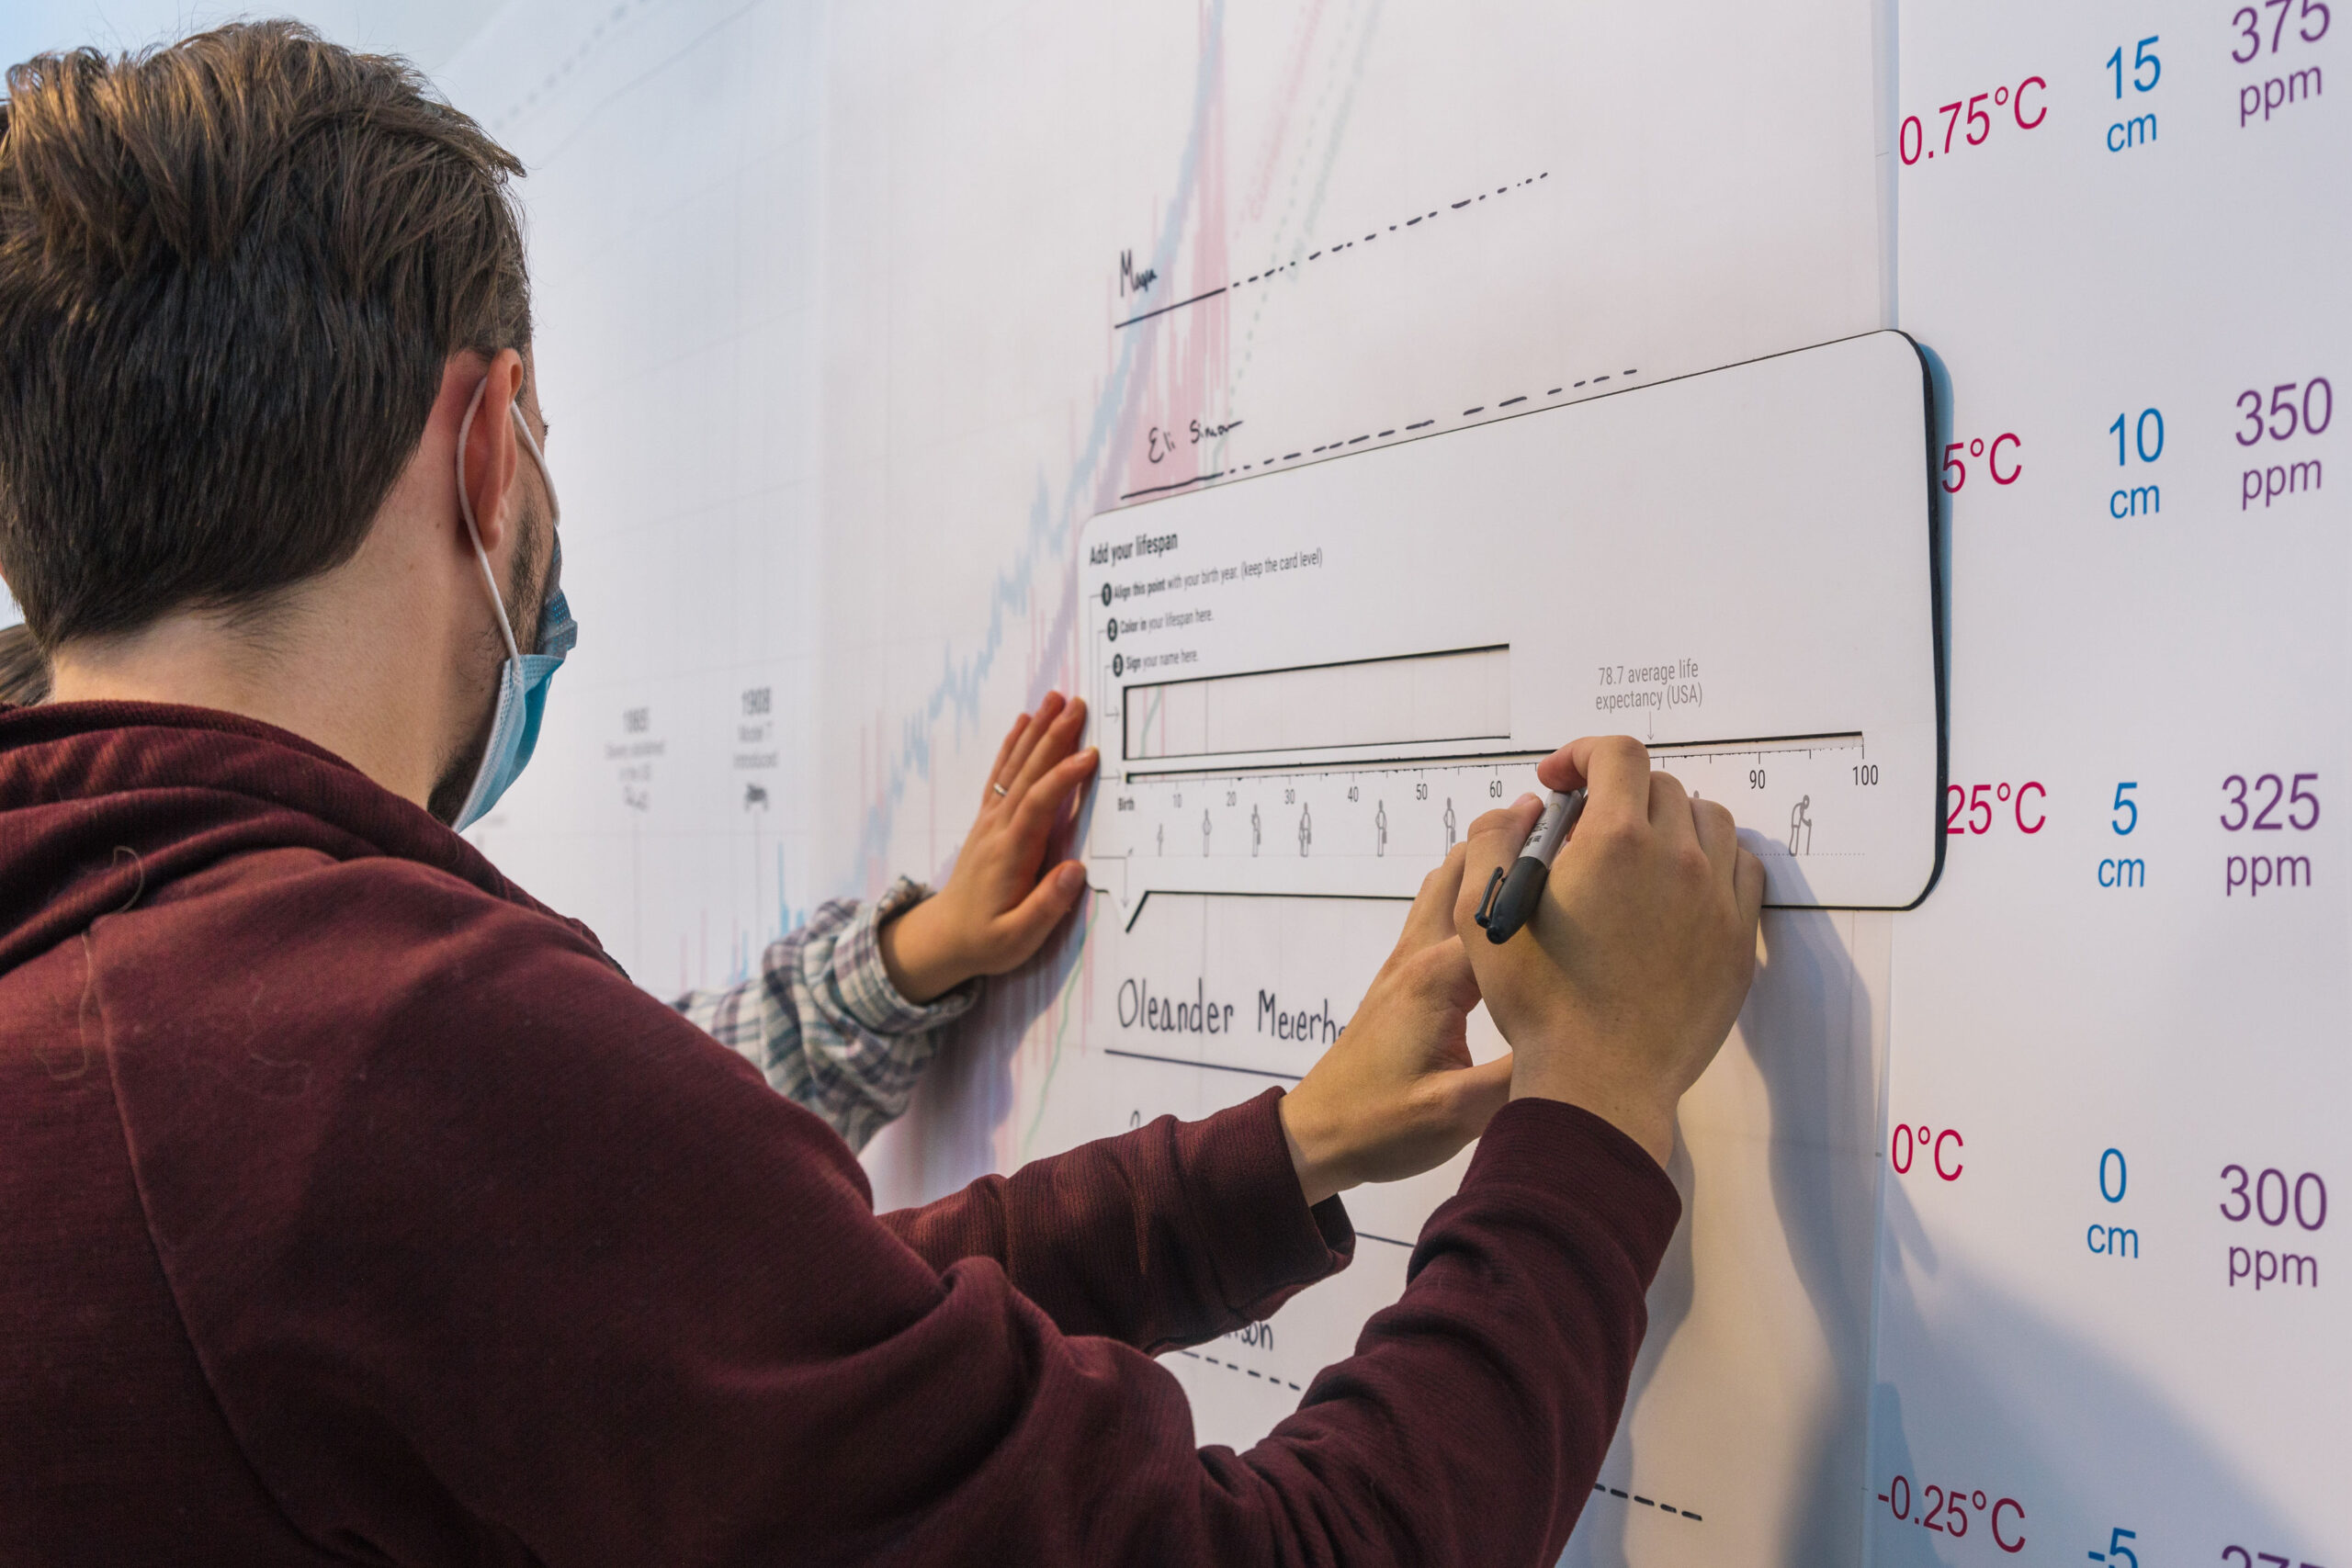
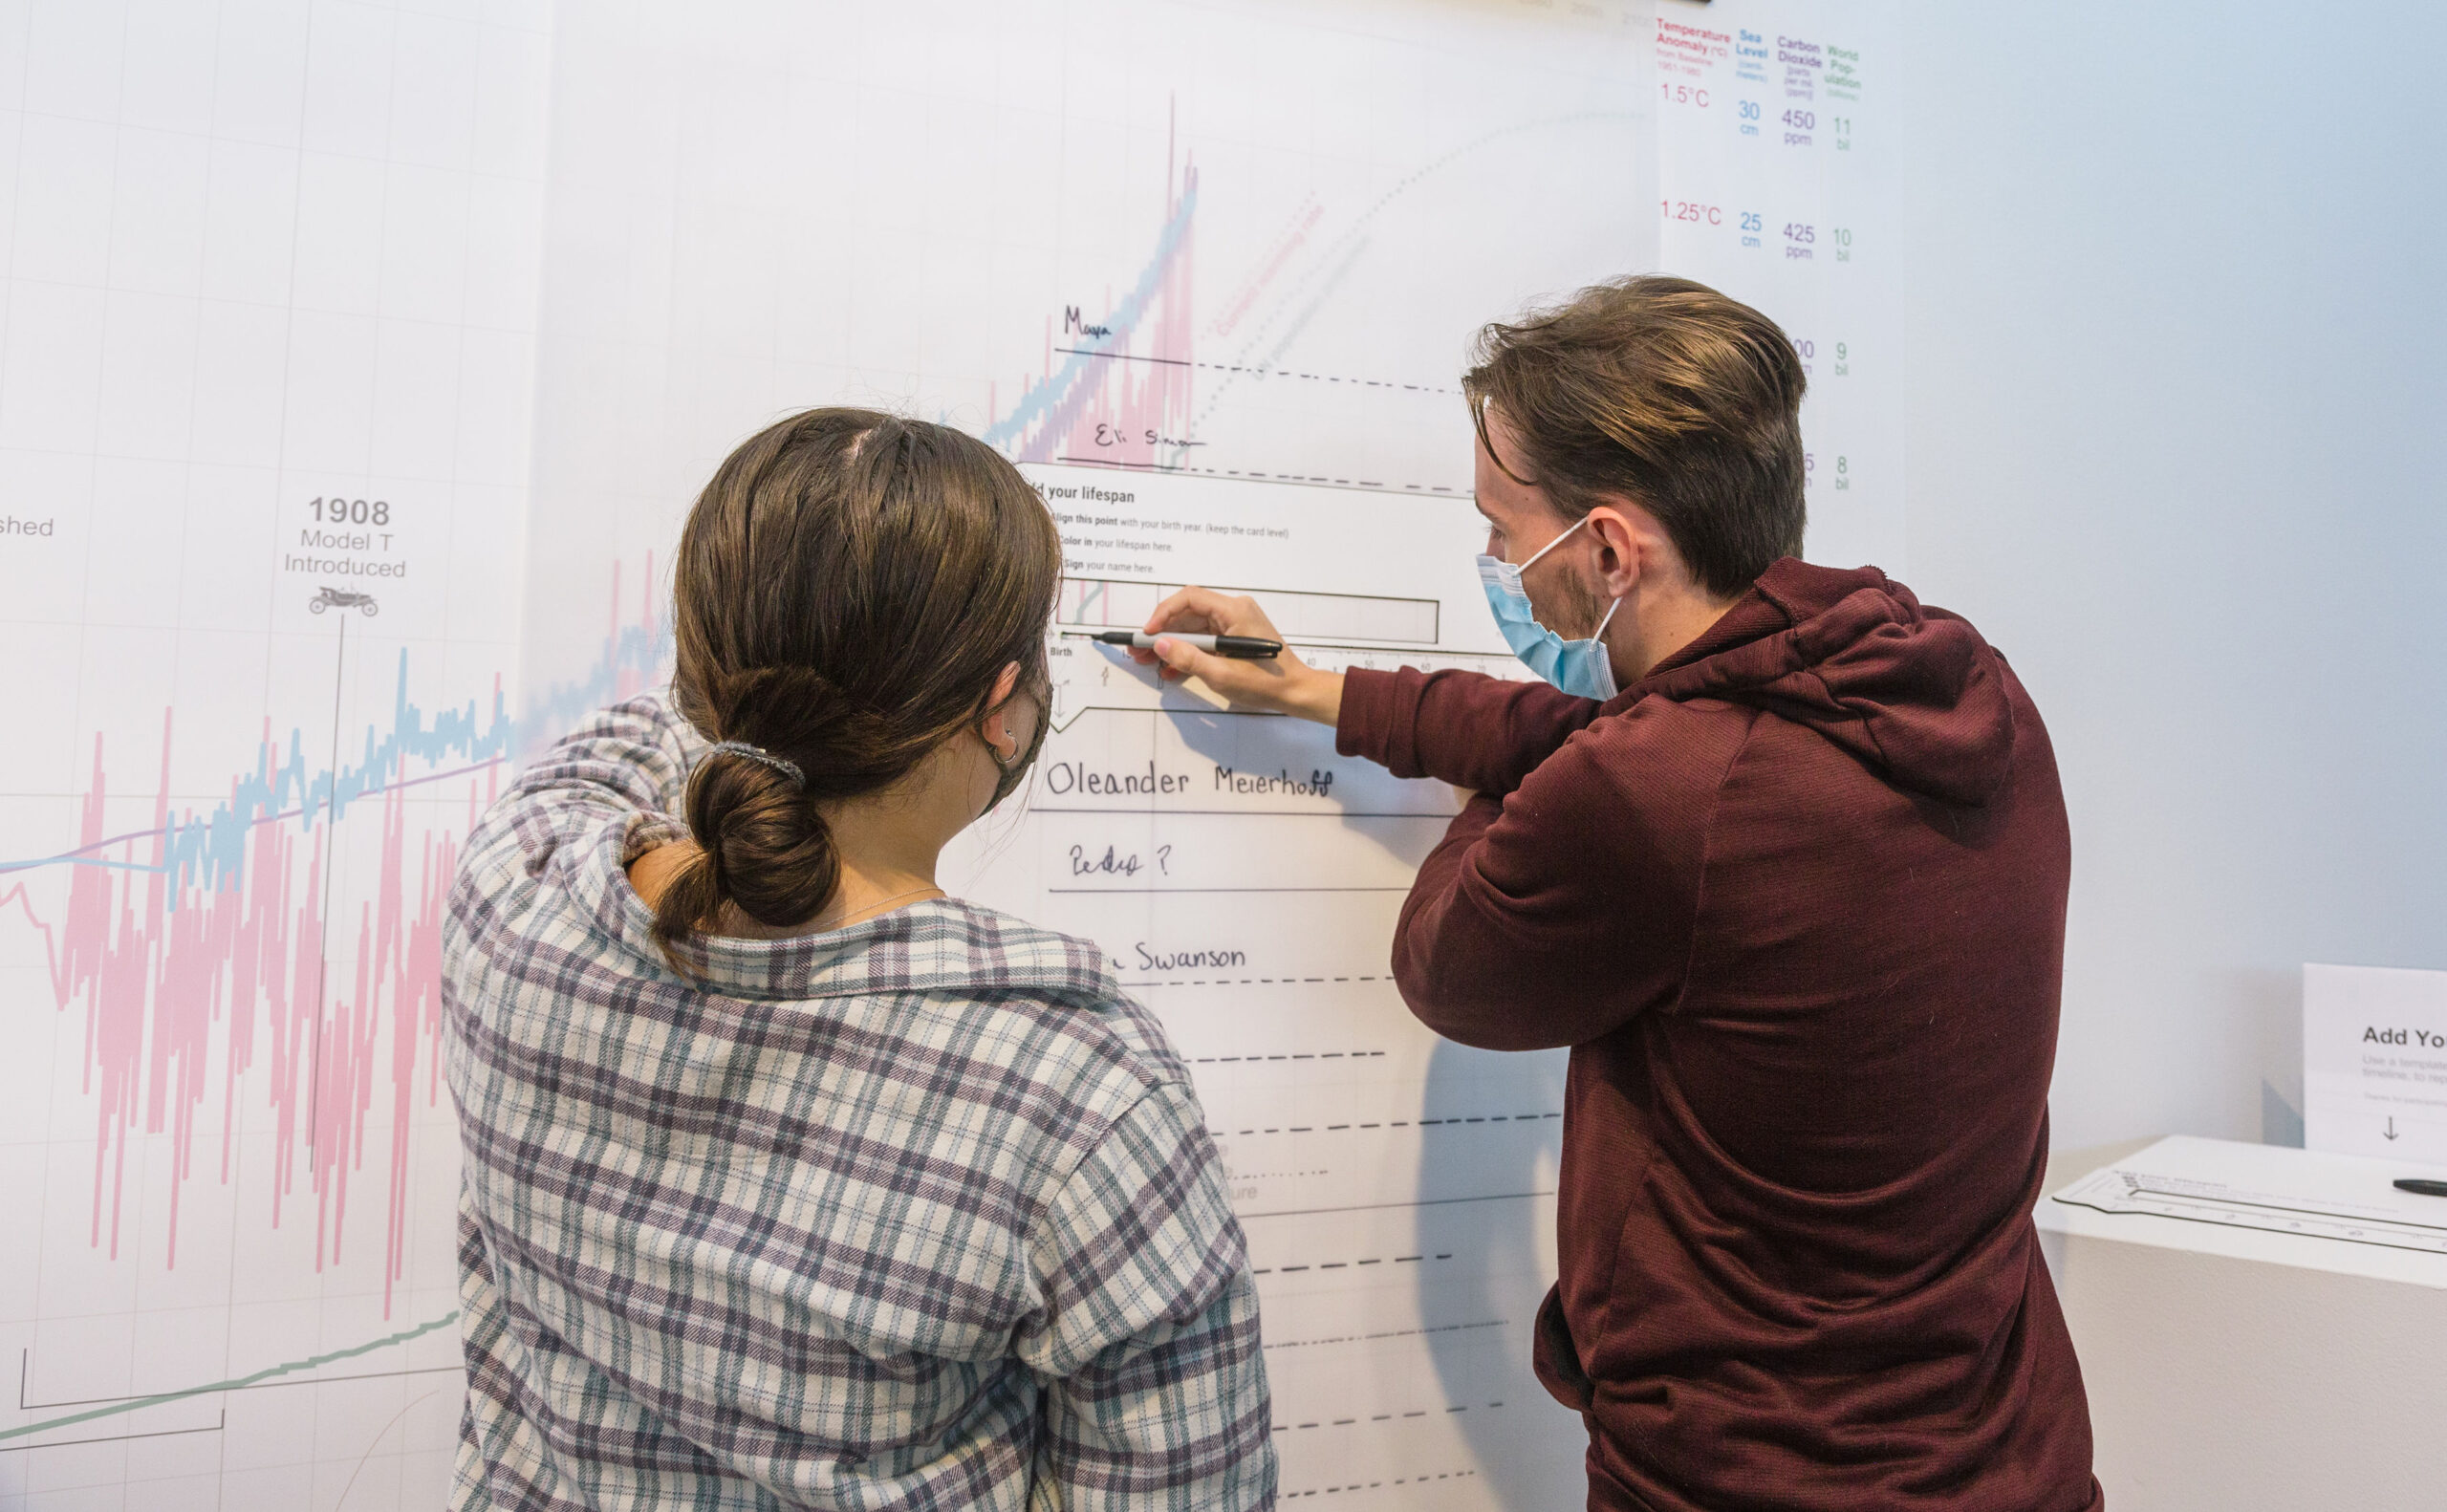
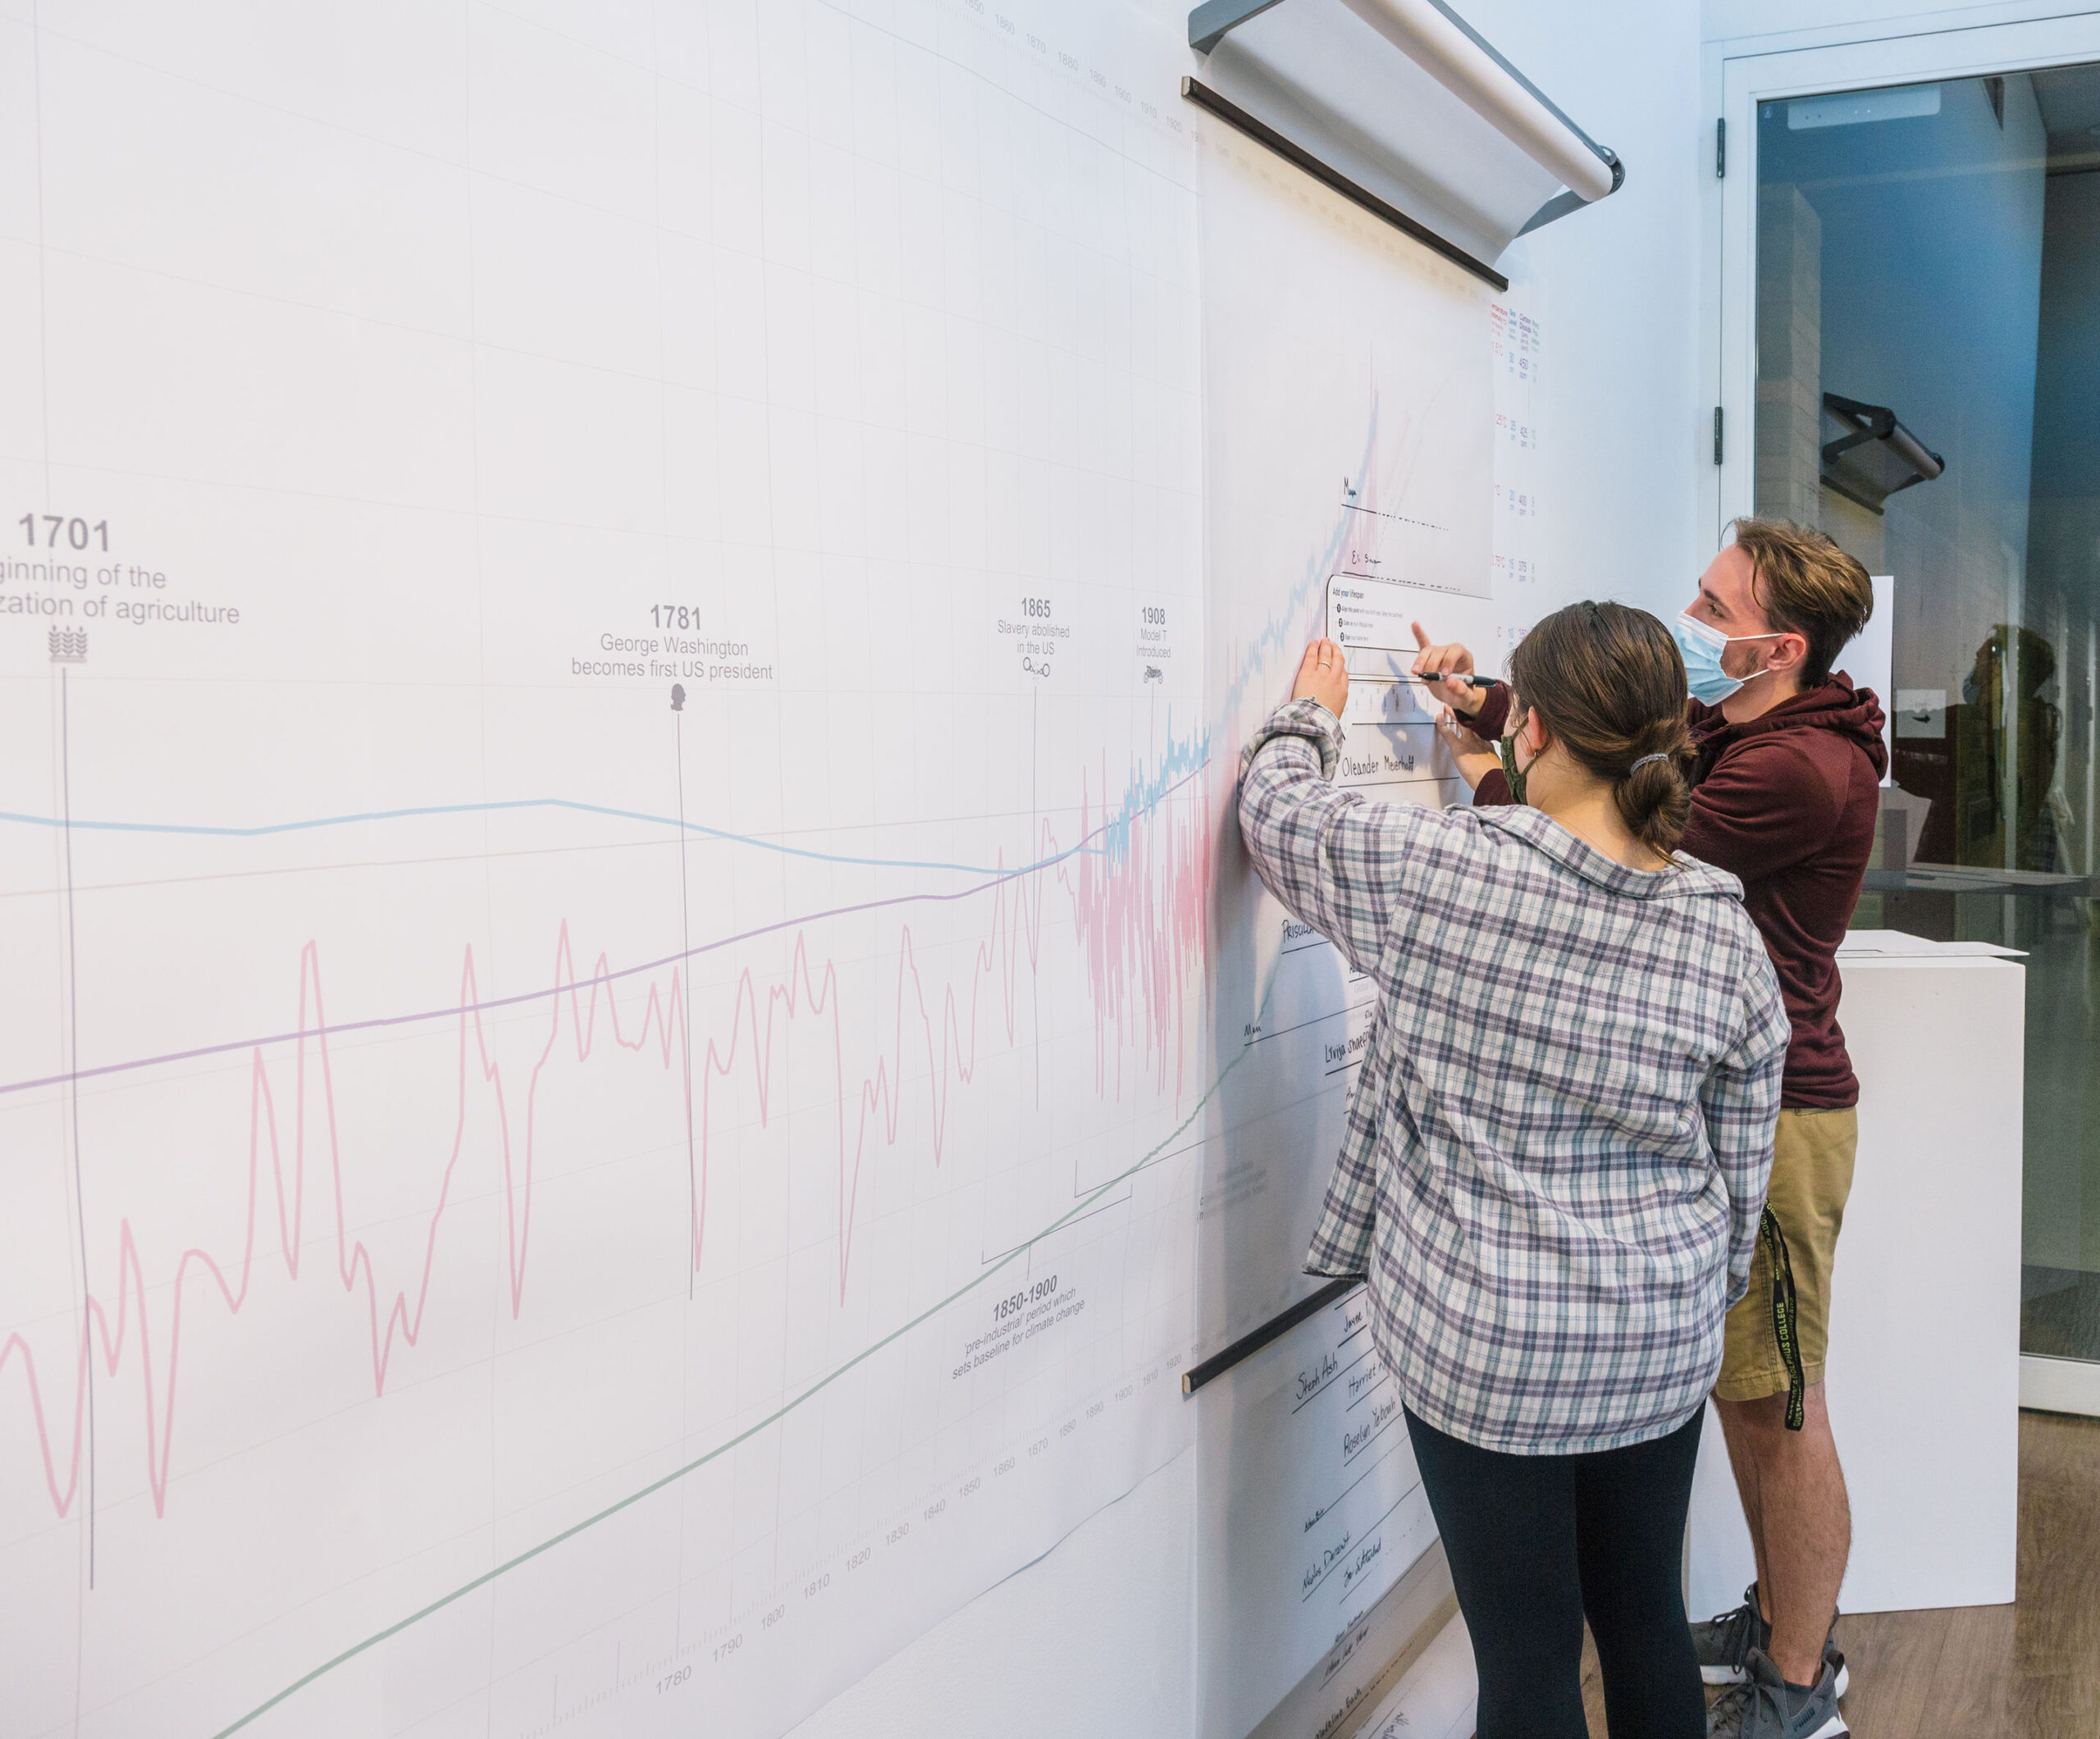
In the fall of 2019, Arlene installed a life-sized, participatory installation featuring human lifespans (and generational legacies) at an Arts Entrepreneurship exhibit at the Minneapolis College of Art and Design. Titled ‘Your Lifespan’, visitors draw their own lifespans atop a 16-foot-long (~5m) banner containing graphs of global changes. The graphs include past observations and future projections of temperature, sea level, CO2 levels, and population from the year 1000 to 2040. The timeline is annotated with major global events.

2021

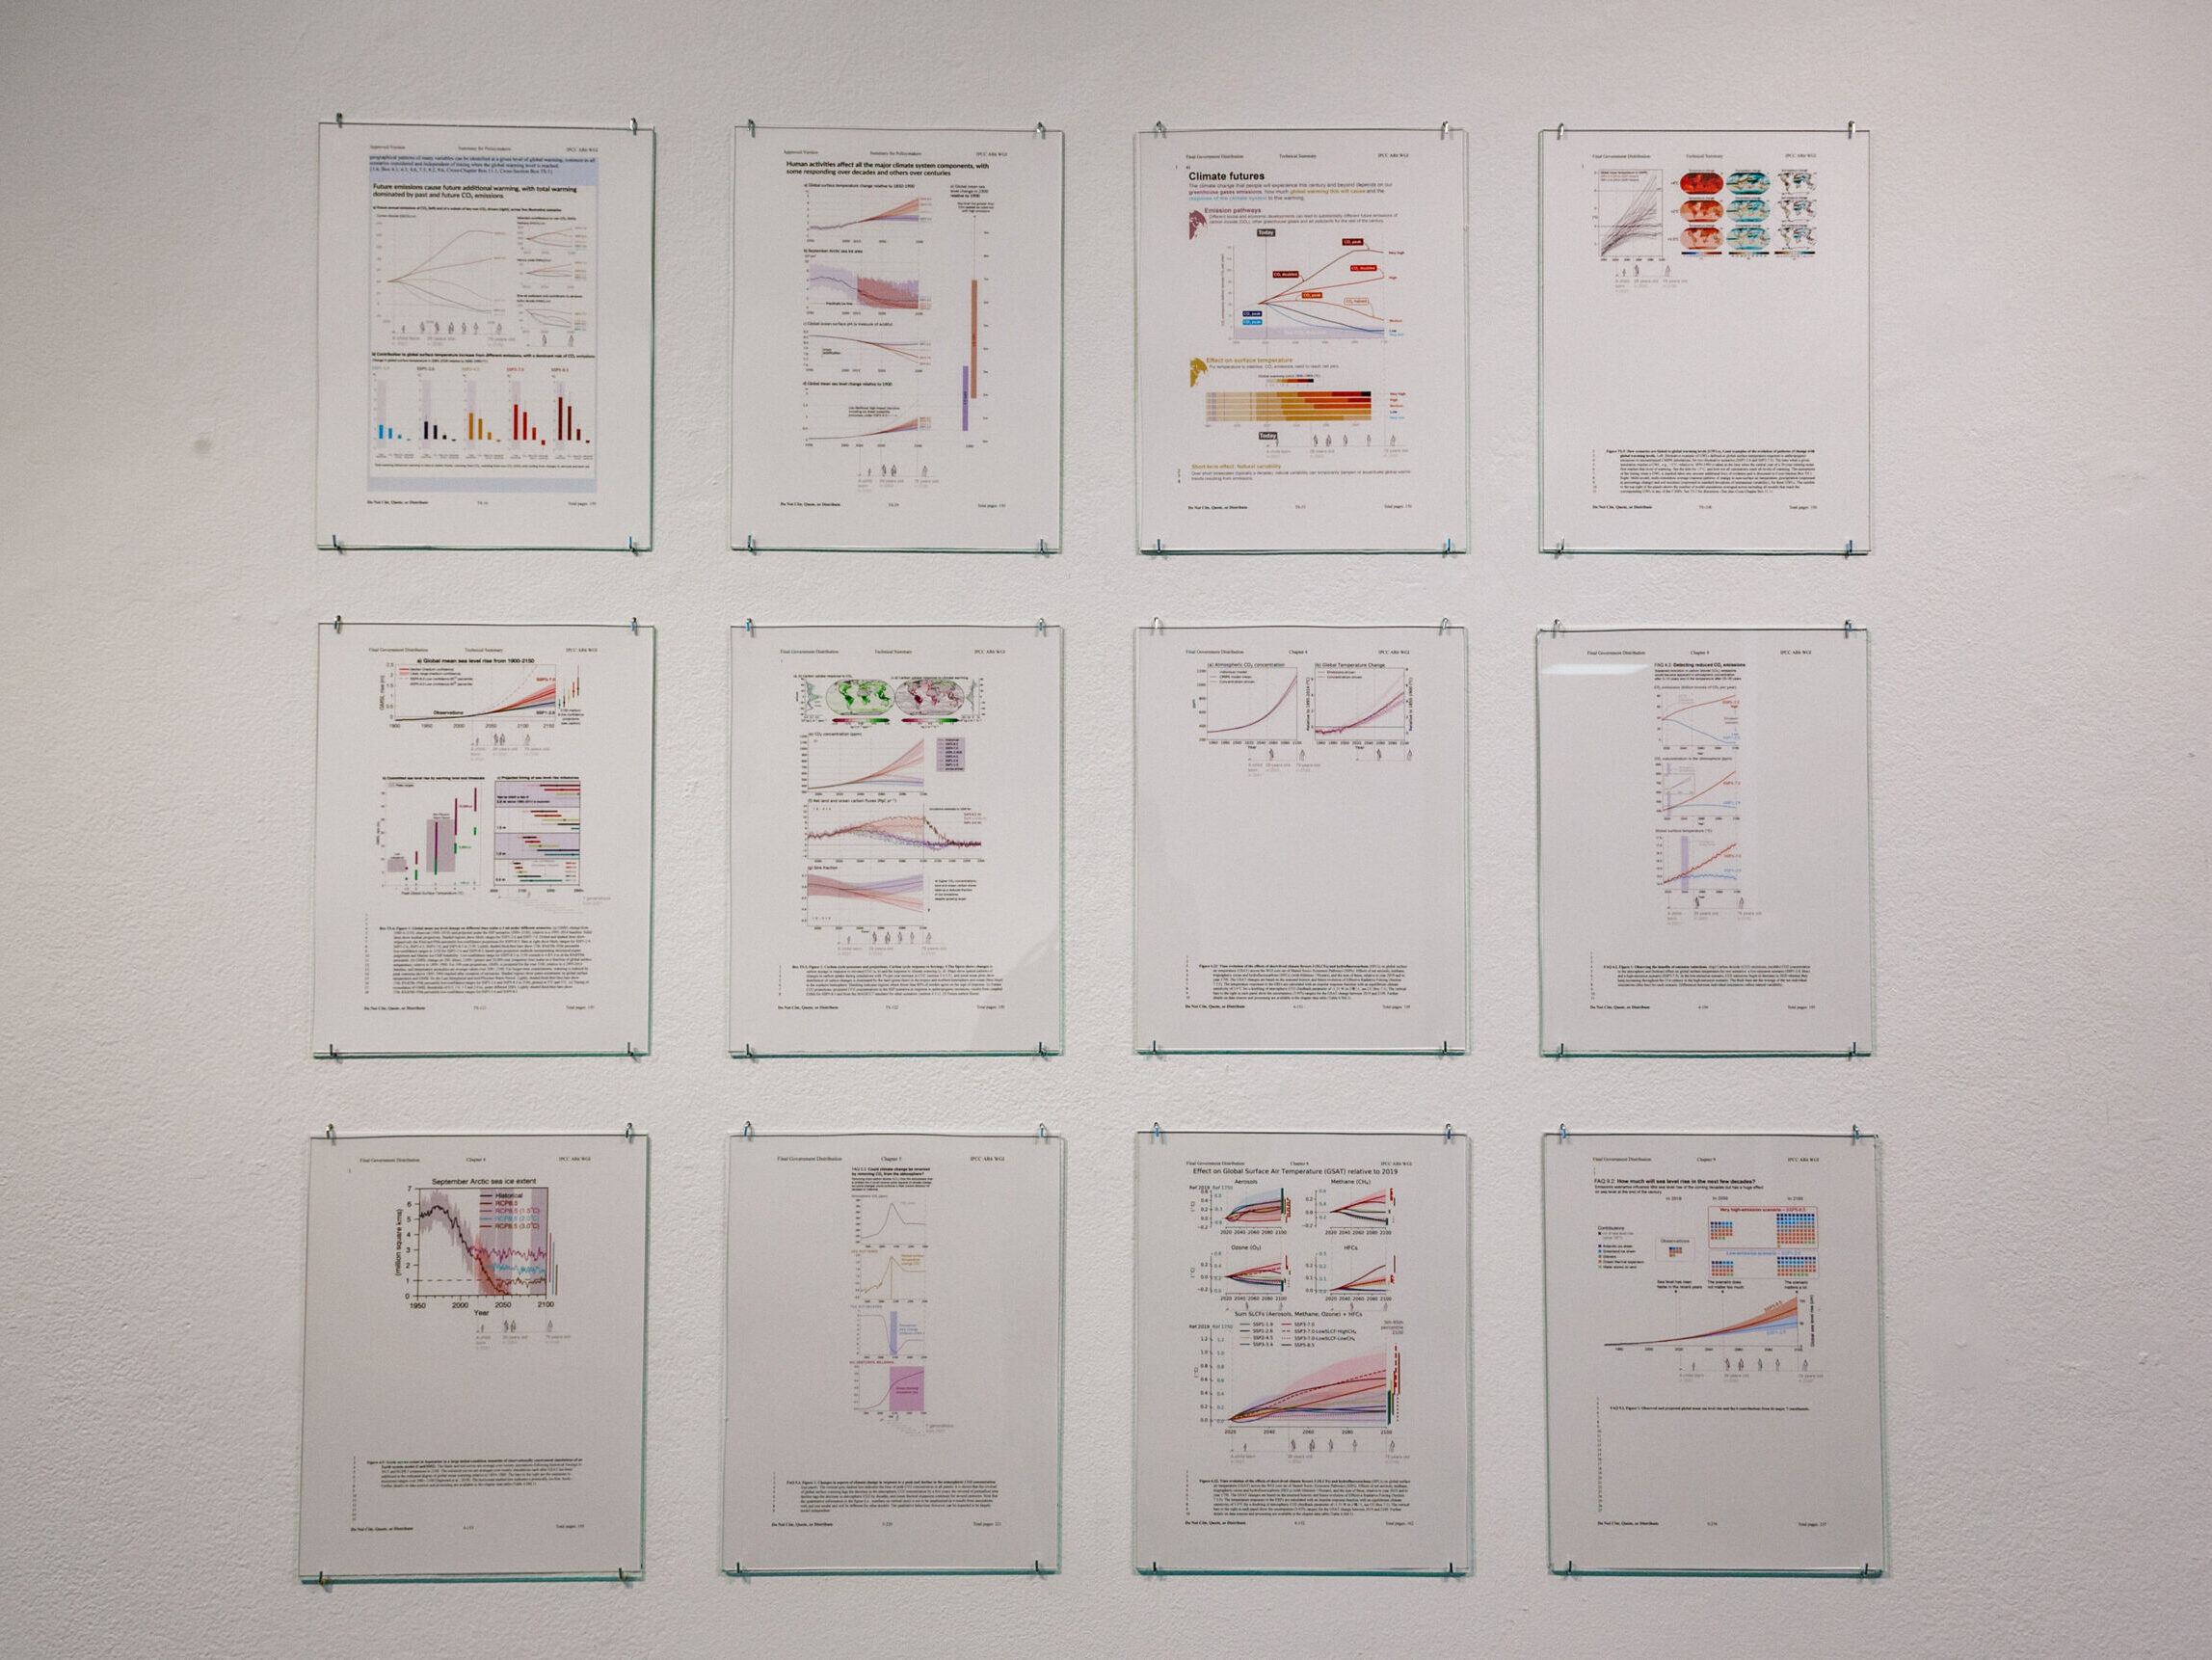
Variations on all of these previous generation-related experiments were installed at a solo exhibit at Gustavus Adolphus' Schaefer art gallery in Minnesota in 2021 –in conjunction with Nobel Conference 57 -Big Data REvolution.

The installation featured:

Climate Lifespans:

A large-scale participation-focused installation where visitors draw their own lifespans within projected graphs of global changes (temperature, sea level, CO2 levels, and population) between the years 1000 to 2040.

'A Child Born In...' IPCC Reports — Annotated:

Graphs of the Working Group I contribution to the Sixth Assessment Report of the UN Intergovernmental Panel on Climate Change (IPCC) have been annotated with human life spans — to help viewers see themselves within the data.

As well as 2 other data-related creative projects:

Exponential makes visual 15 days of exponential growth - related to COVID-19, and Draw the Line, which sources data from a Life Cycle Assessment to show environmental consequences of pencil production.

2023

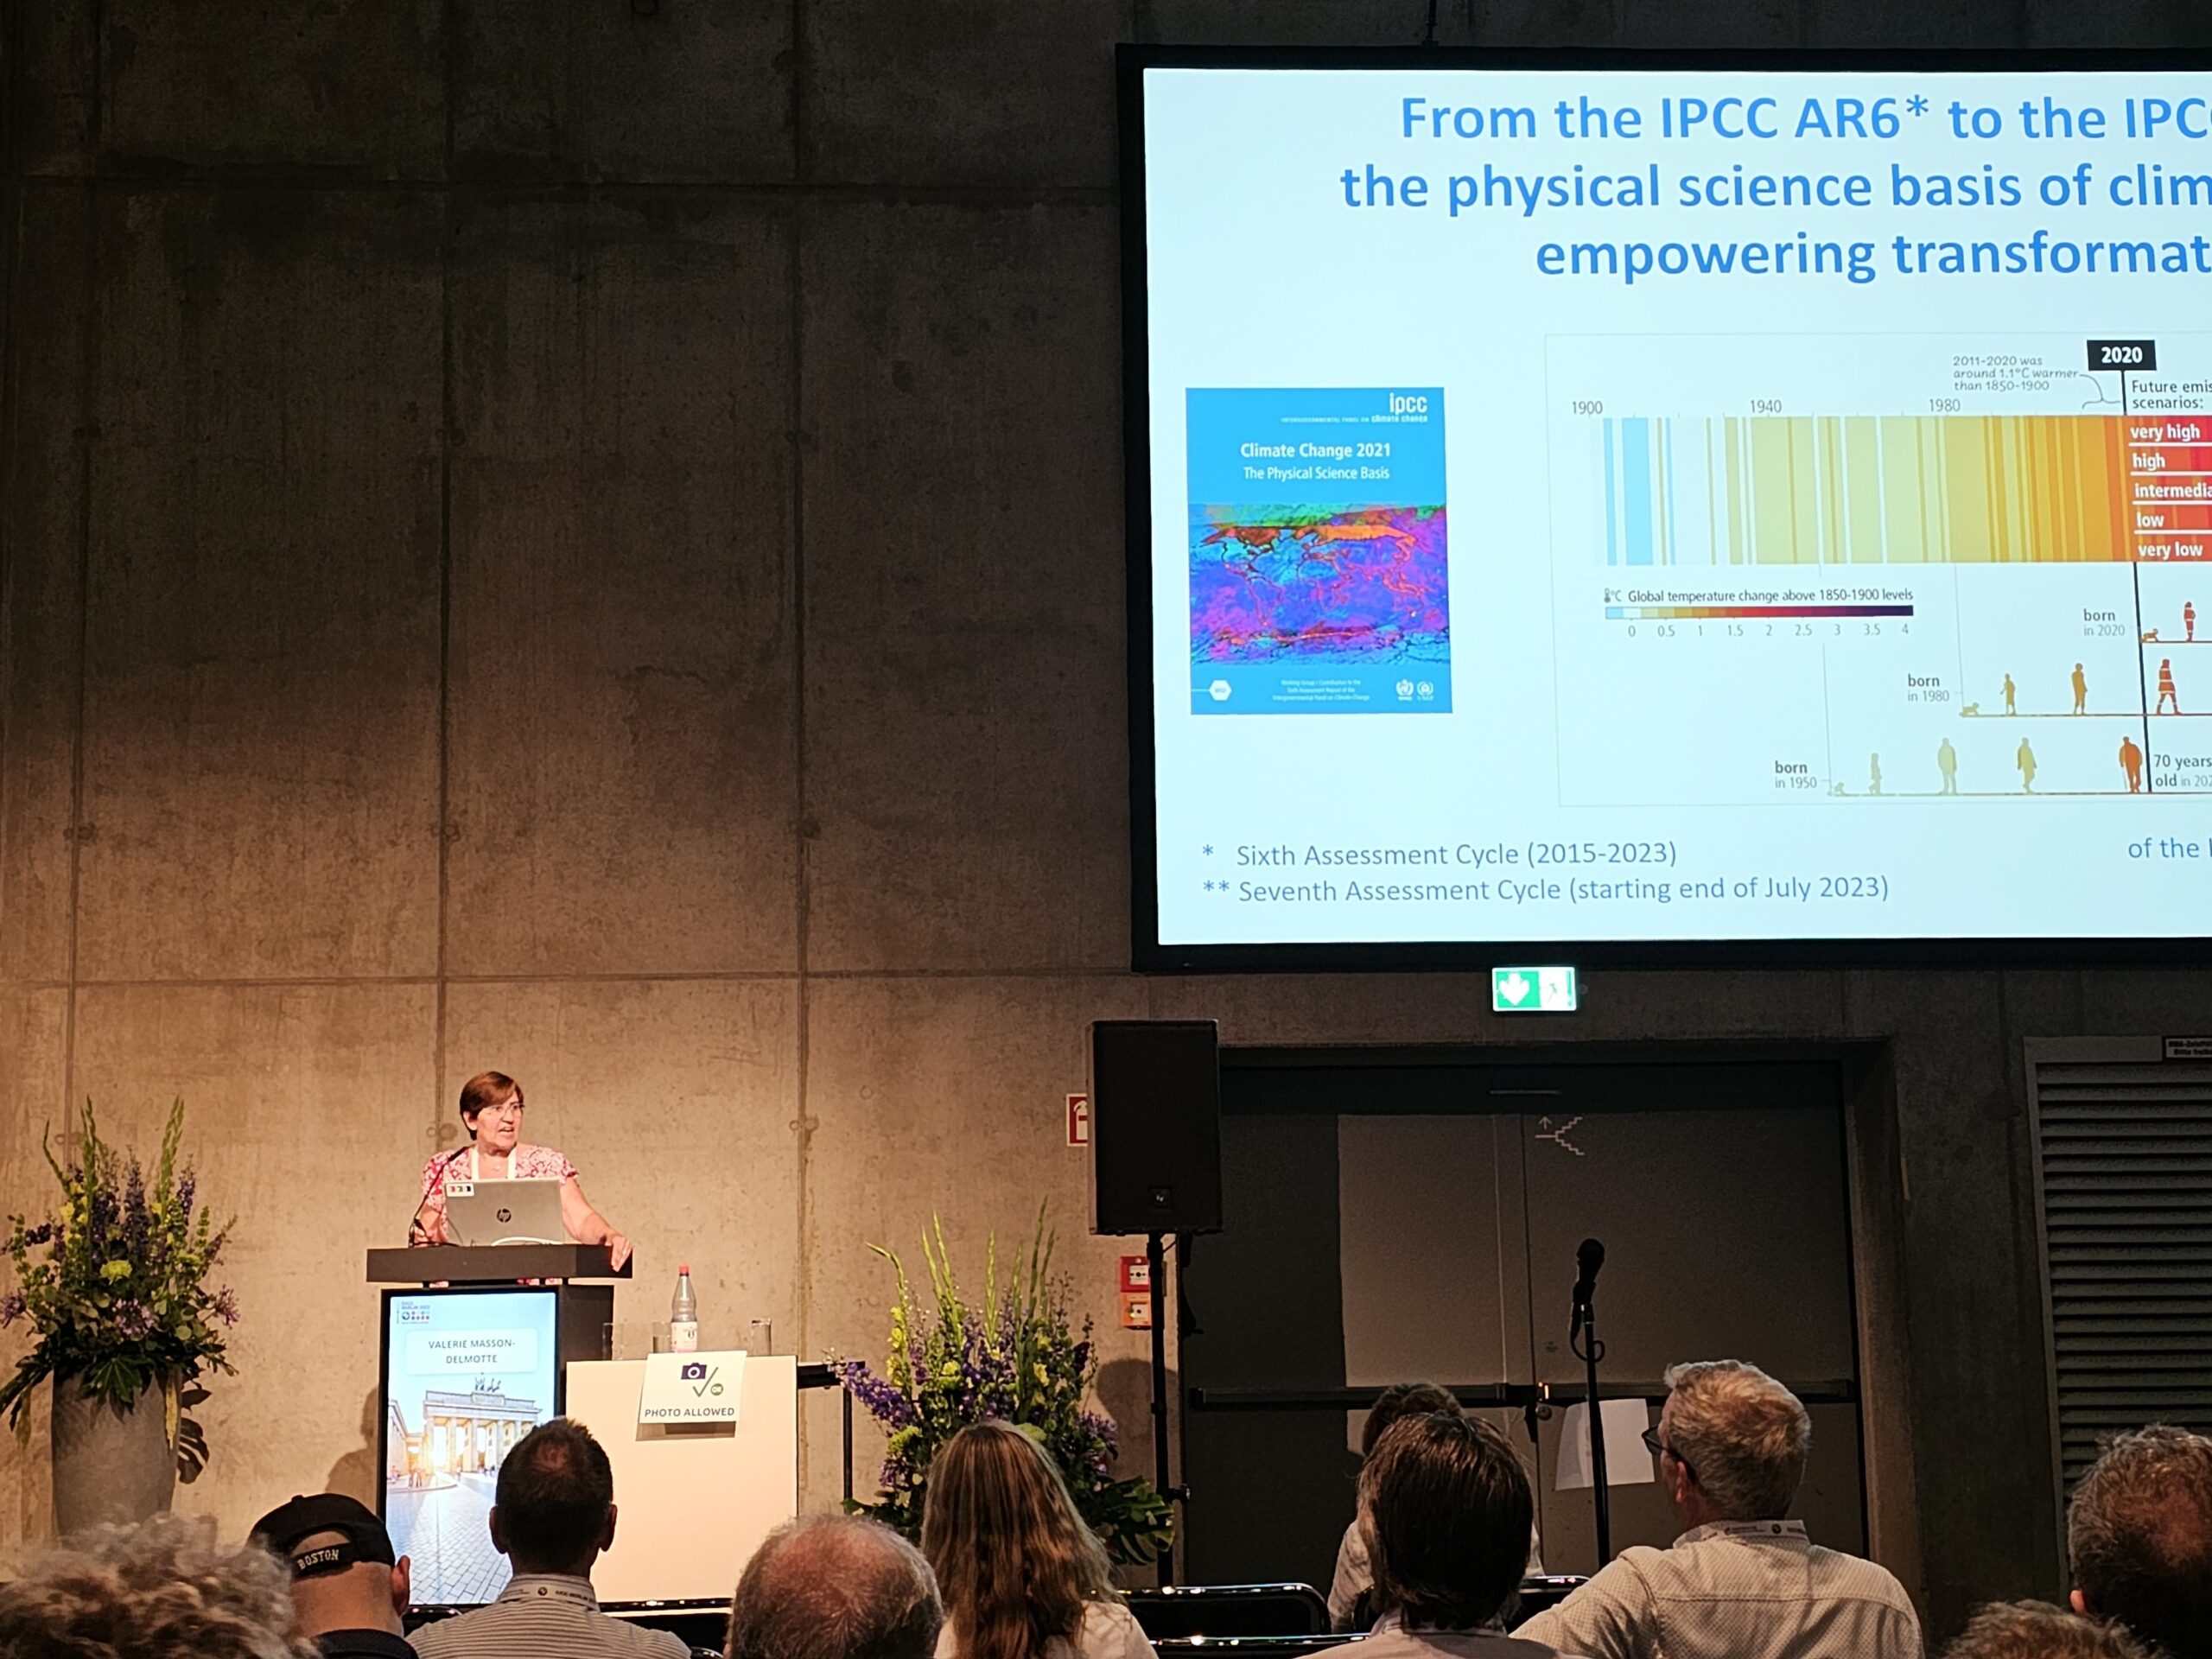
As Graphics Officer for the 2023 Synthesis Report, Arlene led the development of figures in the report - in collaboration with 60+ climate scientists from around the world, and with input and approval by 195 governments. 

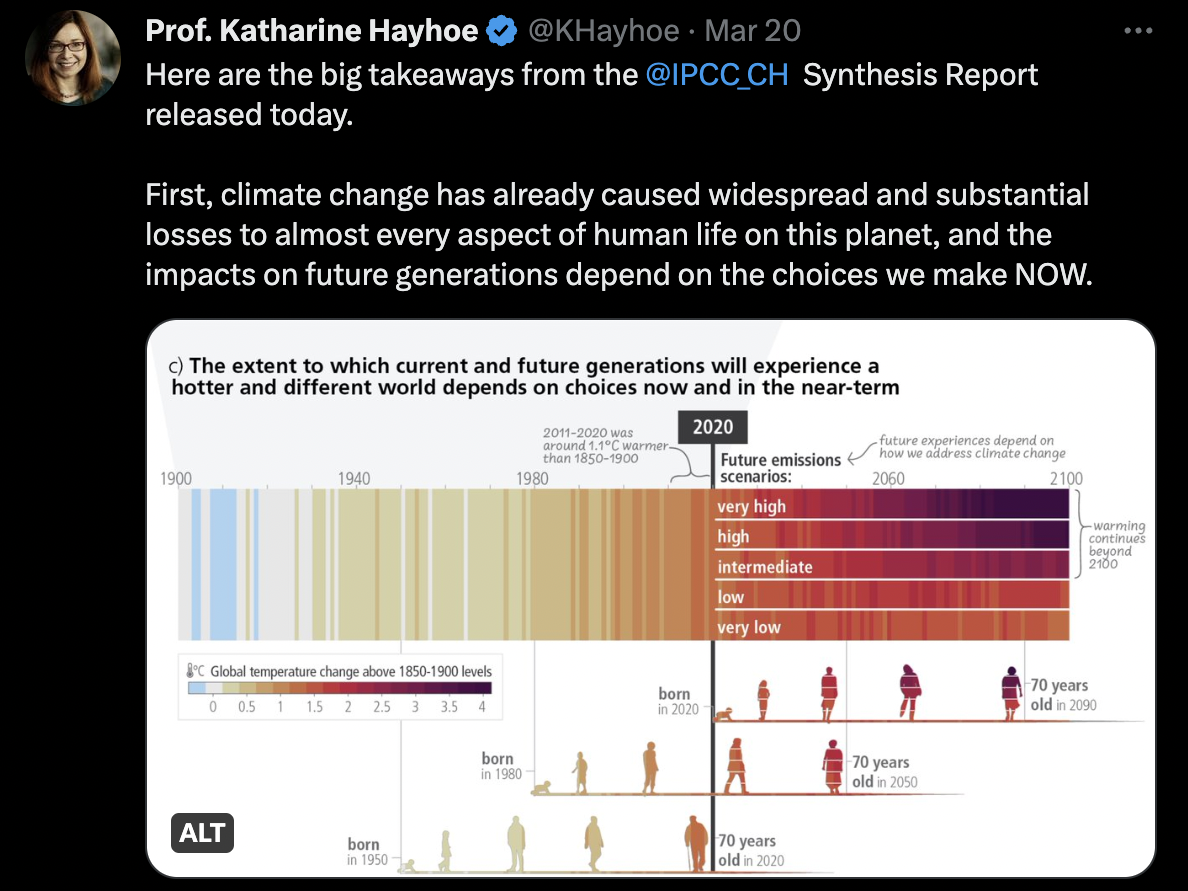
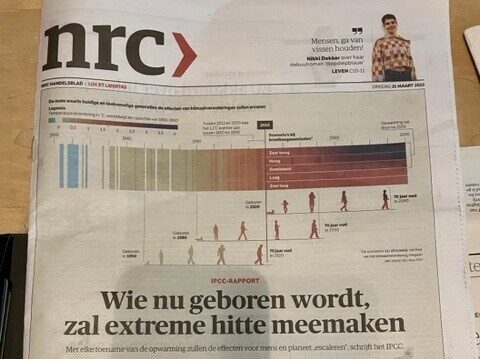
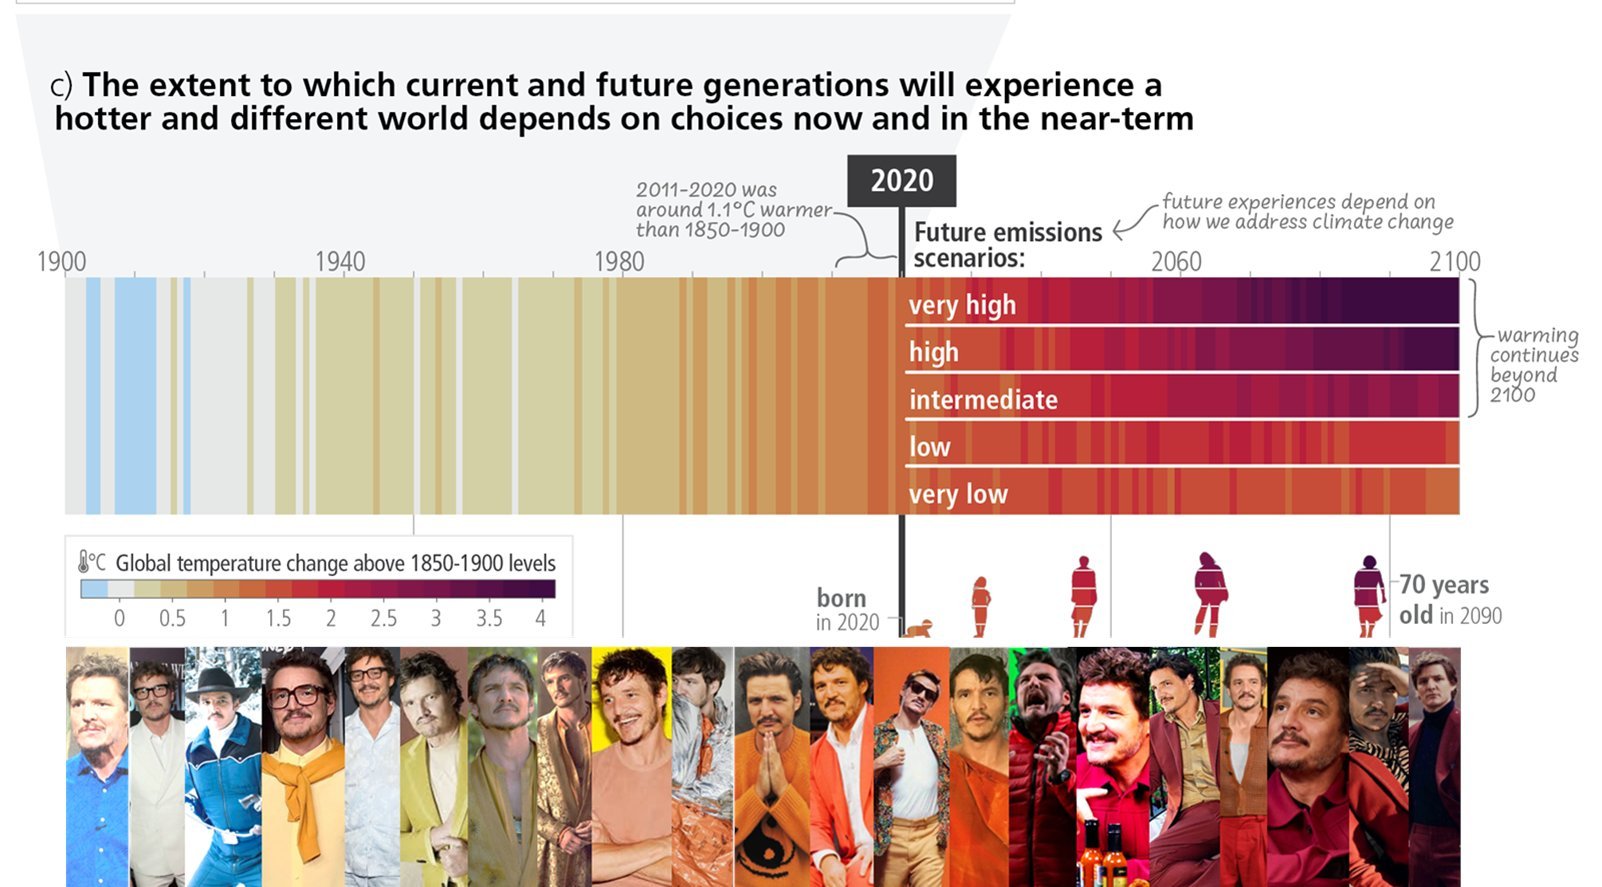
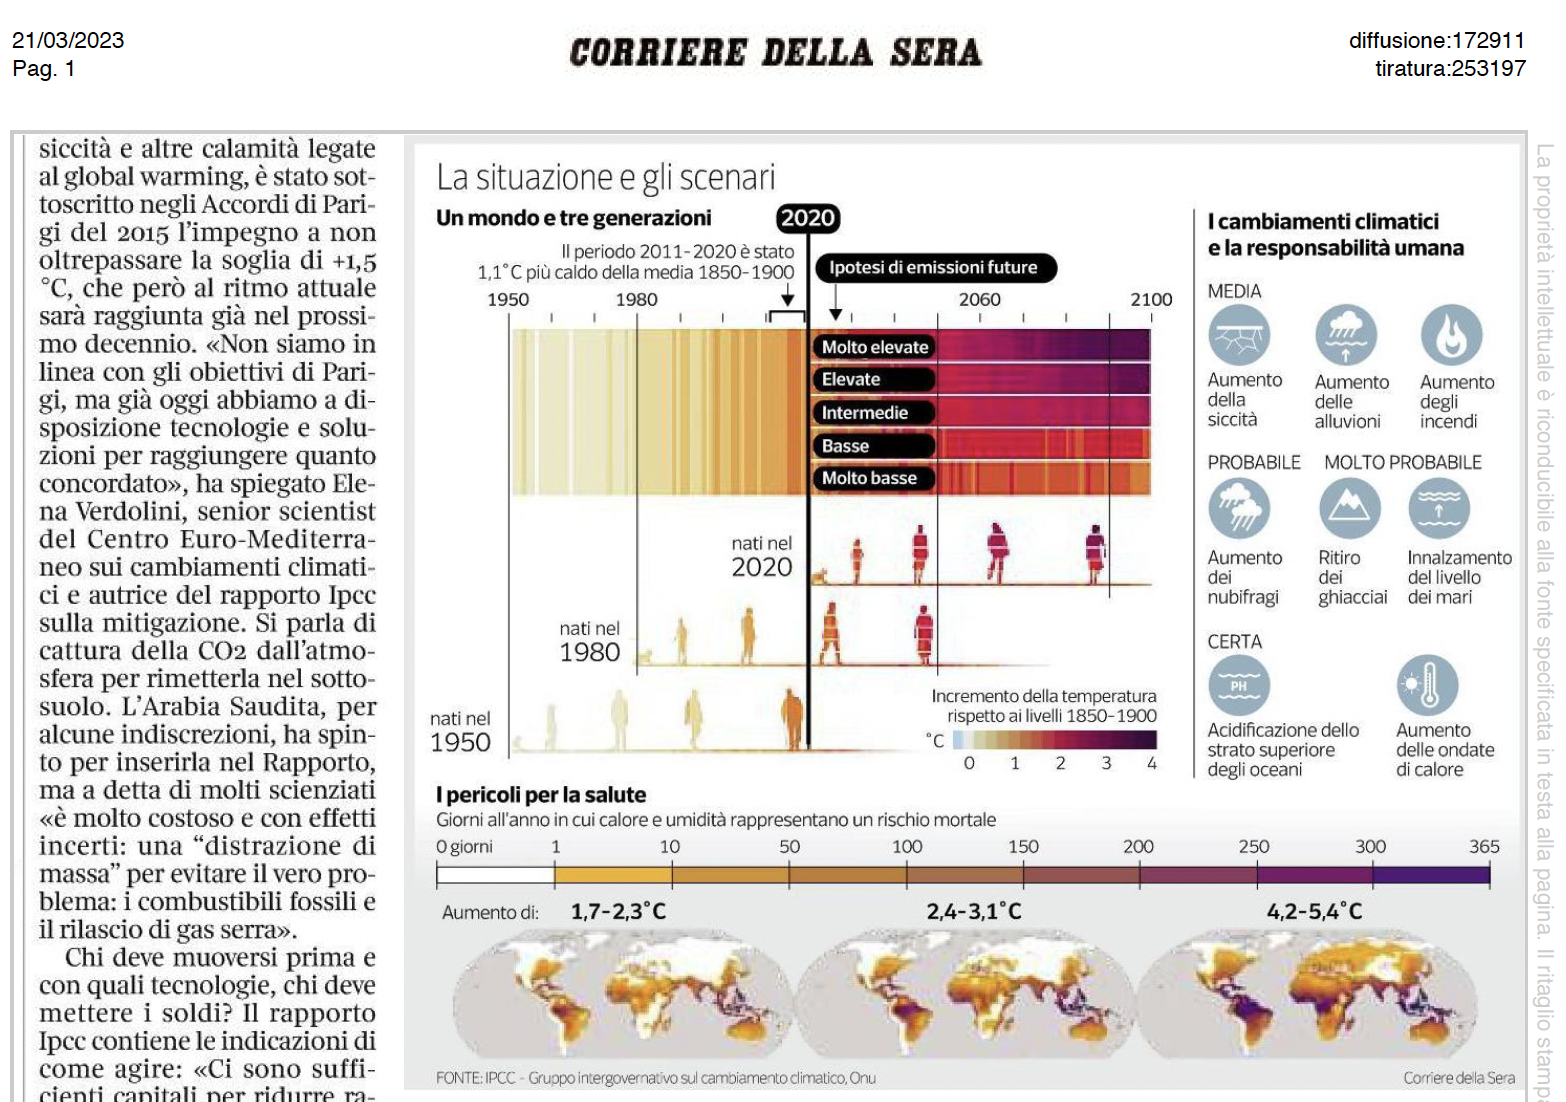
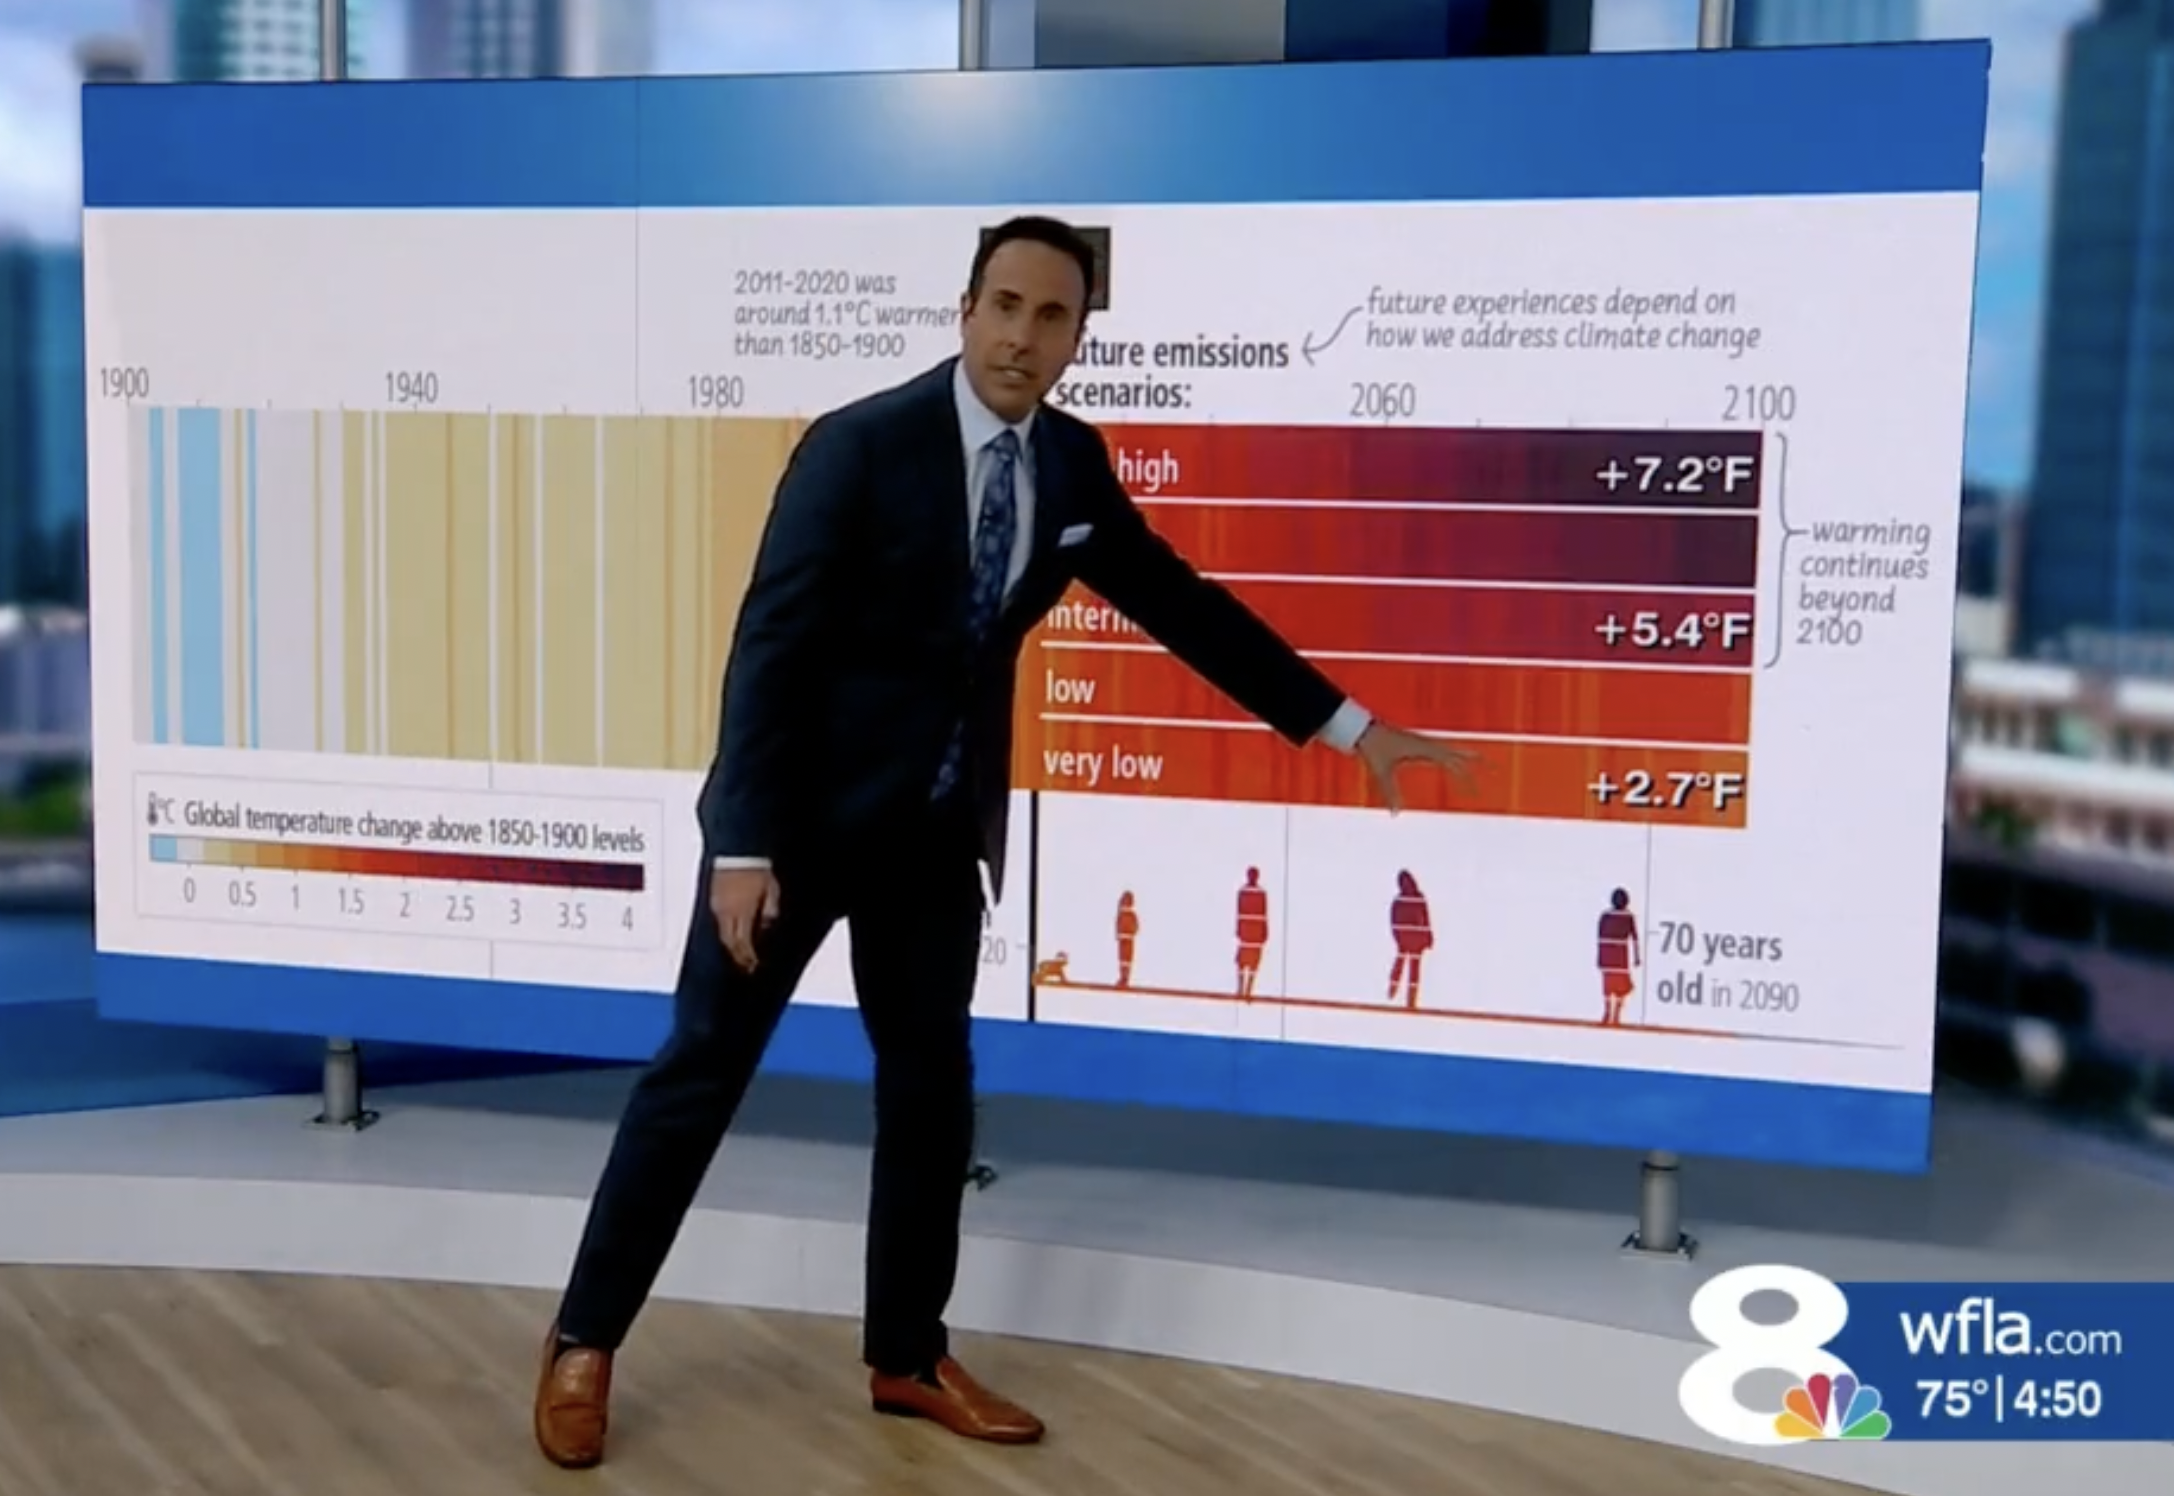
Arlene proposed and designed illustrations of human generations and combined them with climate stripes as part of the first figure of this IPCC report. The resulting graphic (Figure SPM1, panel c) was embraced by global news media, and picked up by numerous media around the world. "The one UN report climate graphic you need to see" by Axios media, and "the climate figure everyone is talking about" by Climatica. The figure powerfully communicates the idea that climate change will affect generations in an emotional way – particularly for those with children in their lives. It also inspired commentary, memes, and spin-off graphics.

Click above to play the video

“It's critical that we put climate data into a human context: to help us see ourselves within the information," said Birt.

While the visual reminder of human generations could have been overlaid atop many figures in the report, Birt found the combination of current and future generations atop basic temperatures would be most relevant and placed the element near the beginning of the report.

This figure was brought to life with the already well-known climate stripes by climate scientist Ed Hawkins. "The climate stripes make this even more emotionally powerful," said Birt. SPM1, panel c was developed in collaboration with scientists from IPCC Synthesis Report, and Ed Hawkins, to incorporate climate stripes. NASA climate scientist Alex Ruane helped to coordinate the science team across the 3 panels of figure SPM1. Alex Radtke inspired colors to extend the warming stripes into future projections. 

MORE DETAILS ON THE LARGE-SCALE COLLABORATIVE PROCESS BEHIND IPCC FIGURES ARE OUTLINED IN THIS ARTICLE.

2024

NASA, in collaboration with Arlene Birt and Ed Hawkins, develops a tool that enables visitors to generate their own climate legacies: using both human lifespan and climate stripes. With this interactive digital tool, visitors can input multiple people's names and birth years, and select silhouettes to represent each person at various ages. The tool generates graphics that include the lifespans based on this information and visitors can also select between 2 visual formats: one that aligns with the IPCC figure, and another that focuses on the individual lifespans, condensing the timeline.

Map YOUR family's climate legacy

Recent Blog Posts

You’ve Finished Your Theory of Change – What’s Next?

Congratulations on finishing your Theory of Change! Capturing the heart of an organization in a single model is no small feat. Now that it’s finished,...
Read More
BgStories_2023Wrapped_IntroVideo_6edited-ezgif.com-video-to-gif-converter

Happy 2024!

We're excited for another year of creating visuals people ‘get’ at a glance. Looking back at 2023, we’re really proud of the work we’ve done...
Read More

Path to a Successful Visual Story

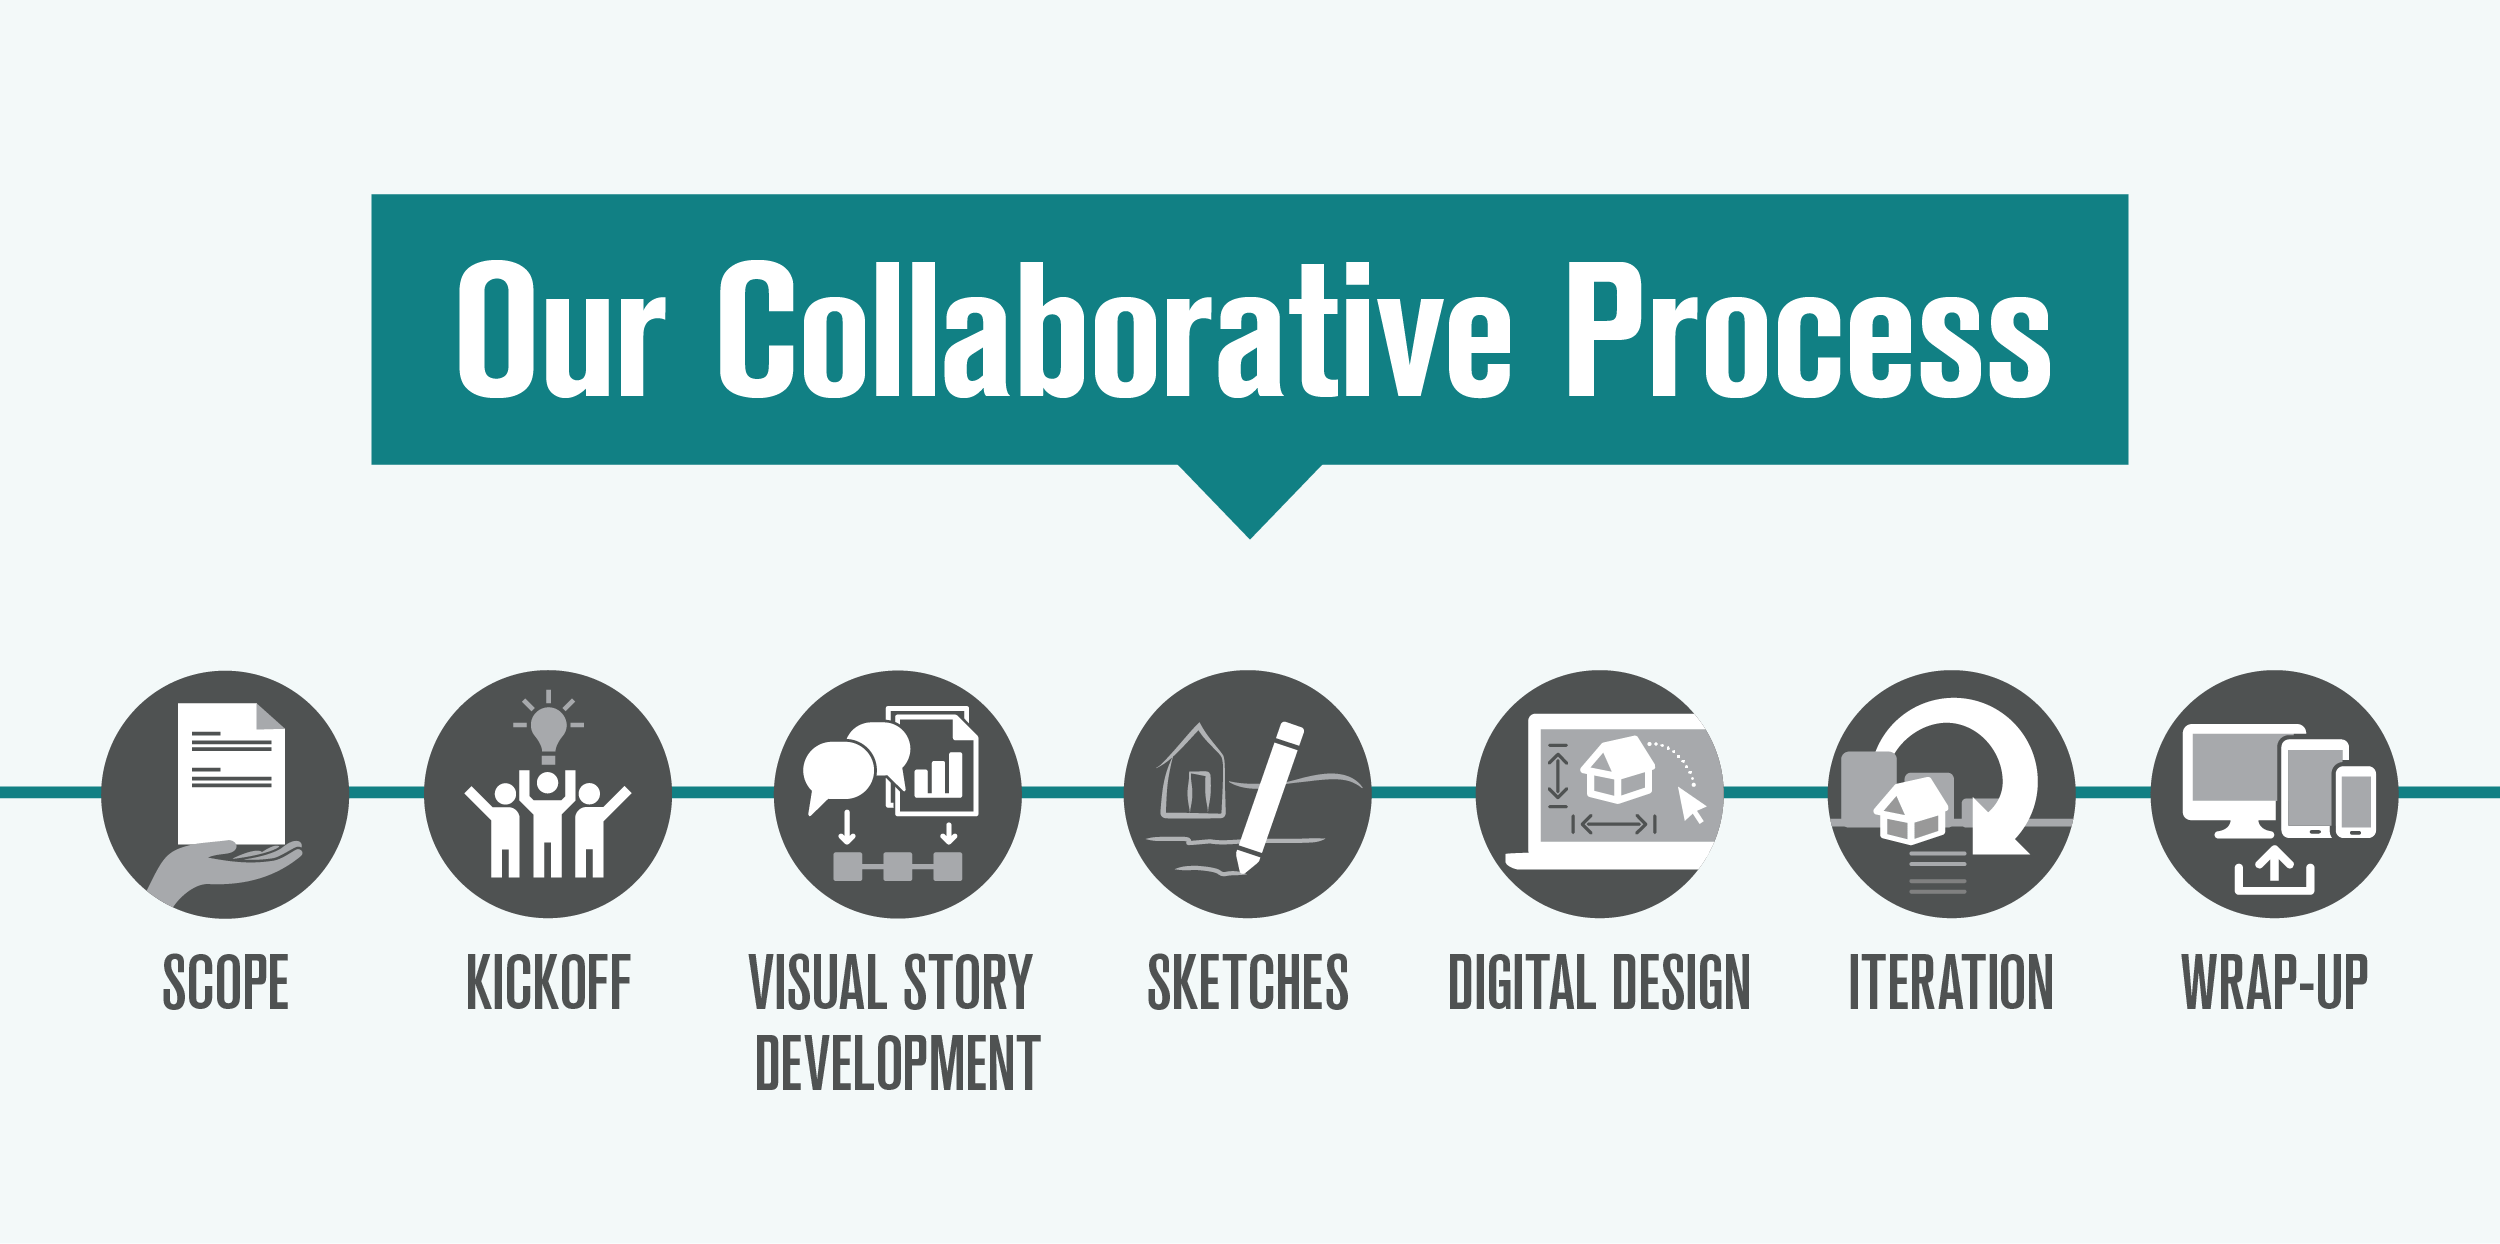
A step-by-step guide to our collaborative process Visual storytelling is a powerful tool to help people understand and engage deeply with complex information. Whether developing...
Read More
background image we created for the Minneapolis 2040 Comprehensive Plan

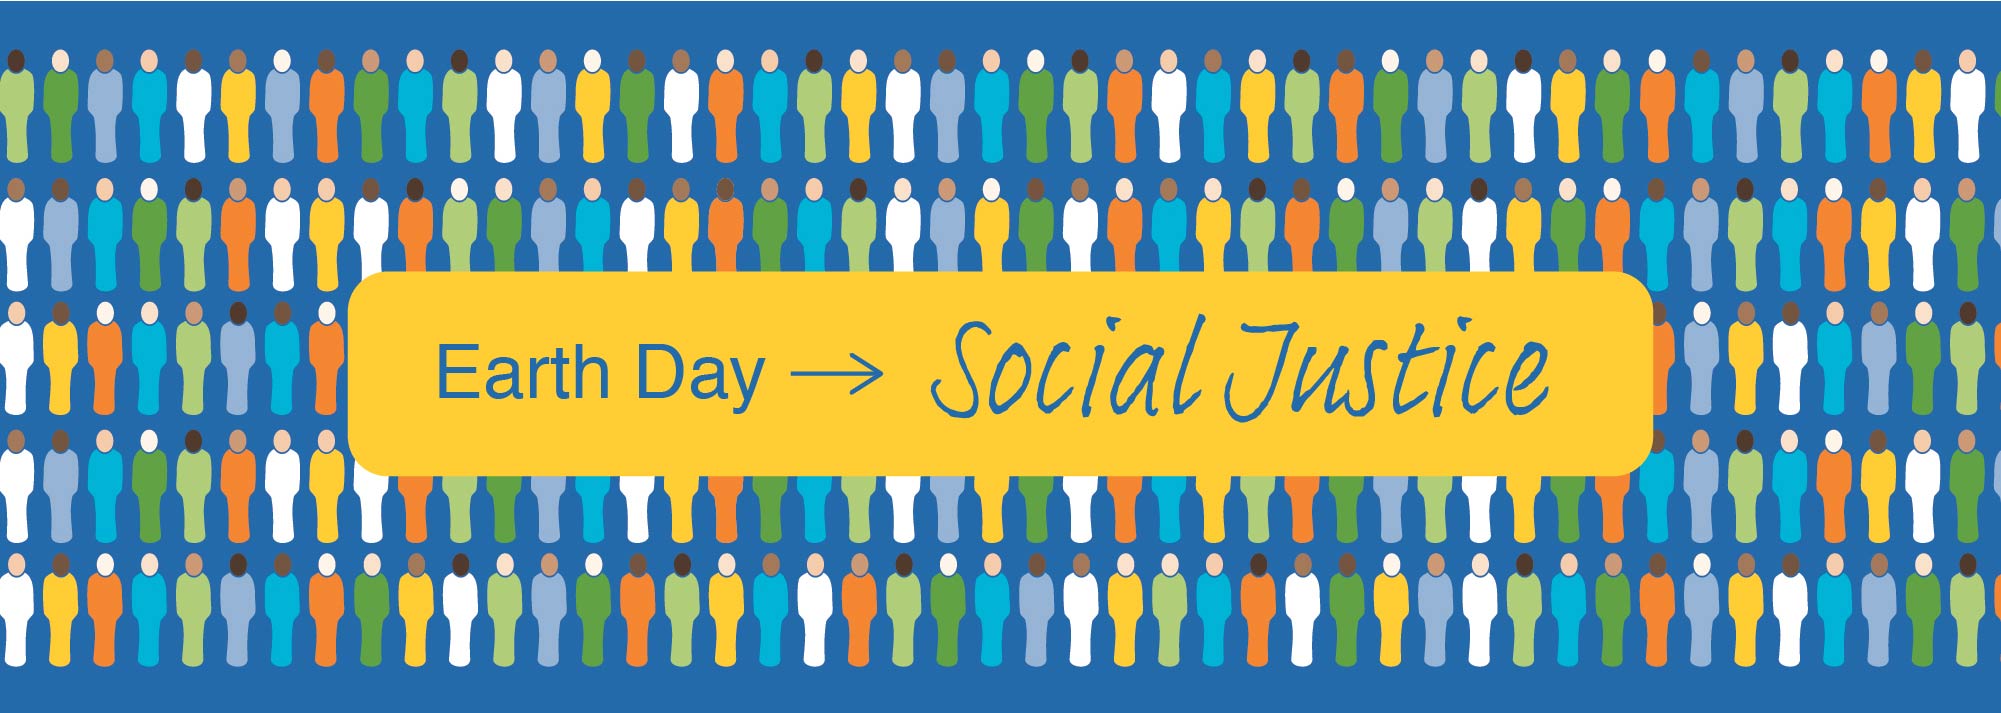
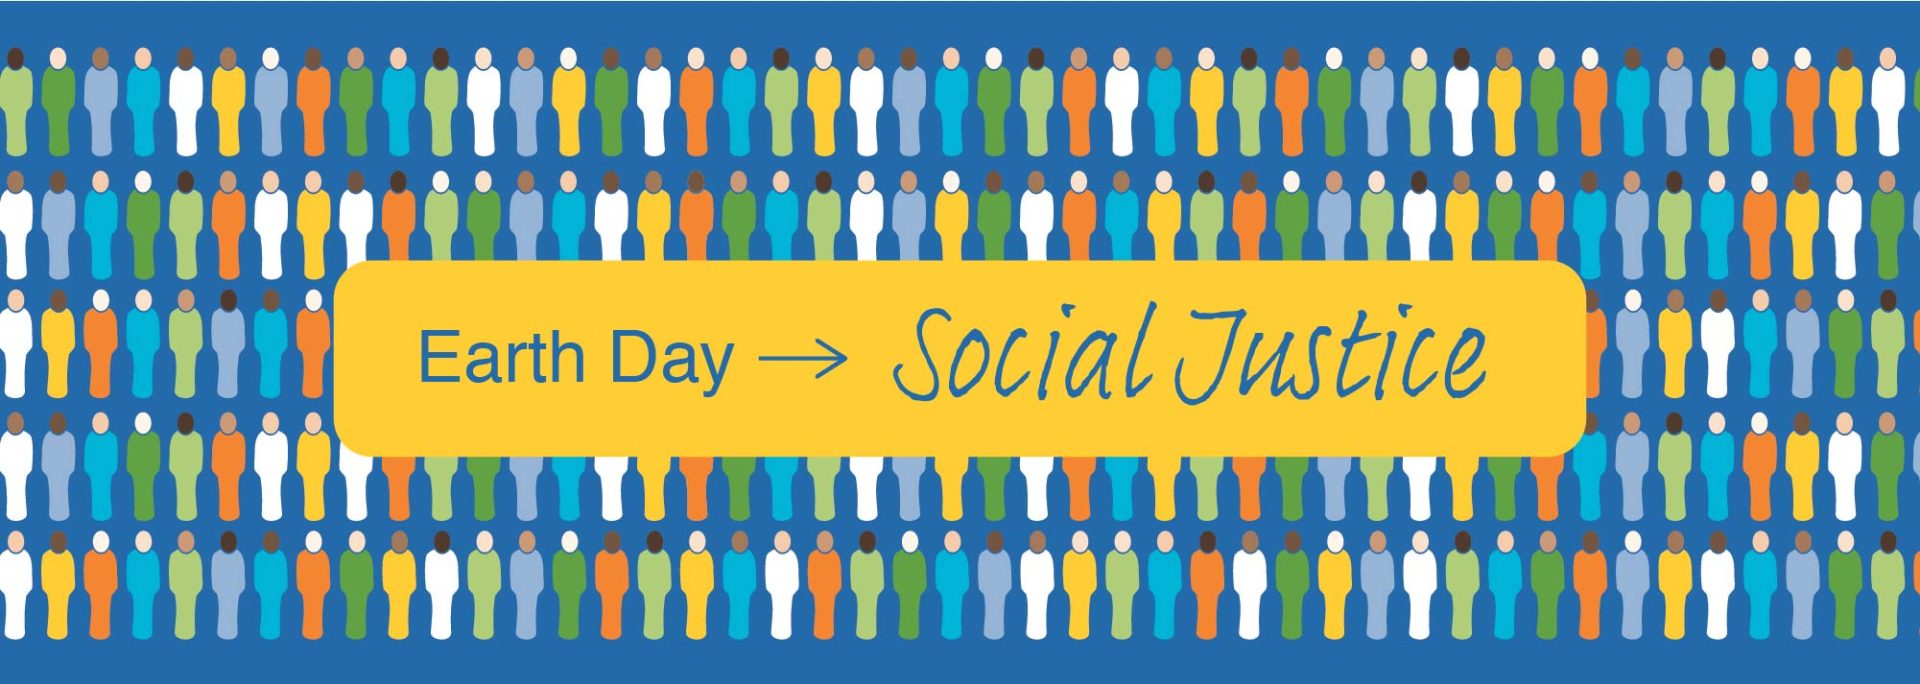
This Earth Day: Spotlighting Social Justice

Background Stories is known for our design work to visually communicate sustainability concepts.

When people think “sustainability,” environmental aspects often come to mind first.

Equity is a core part of sustainability and climate justice. So this Earth Day, we're spotlighting Social Justice. 

background image we created for the Minneapolis 2040 Comprehensive Plan

Our team is based in Minneapolis and surrounding areas. We're devastated by the loss of Black lives, and the systemic biases and inequities perpetuated against all BIPOC (Black, Indigenous, and People of Color) communities in Minnesota and around the world.

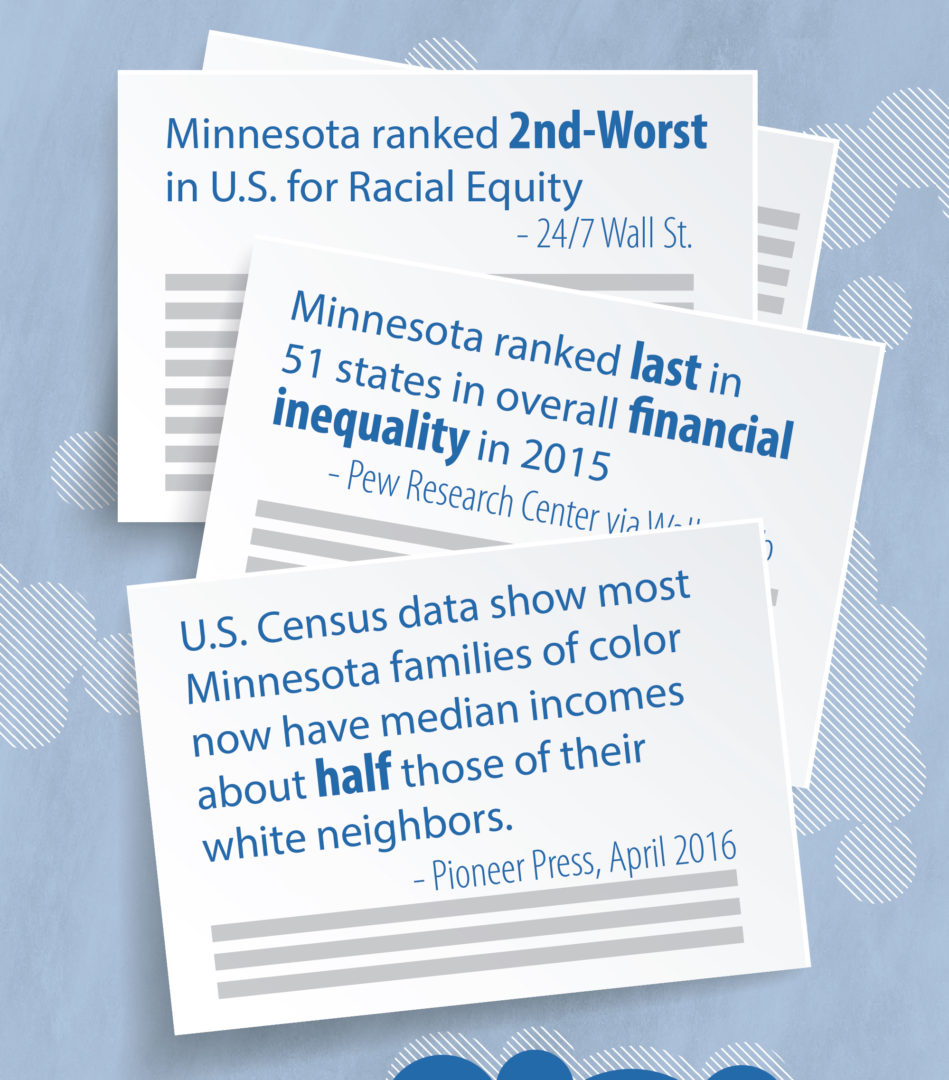
Unfortunately, inequity is nothing new for Minnesota. In work we did for the latest Minneapolis Comprehensive Plan, we highlighted some disturbing statistics on the region's status – in part due to a history of red-lining and racially restrictive housing policies.

image from design work we did for the Minneapolis 2040 Comprehensive Plan

In a profession that focuses on setting visual standards, we know we can help foster change. Here's how:

  • Represent diversity in the human figures we present in our visuals - particularly those representing positions of power. This includes race, gender, body types, and cultural characteristics.
  • Support and contribute to organizations that are furthering diversity, equity, and social justice initiatives.
  • Promote diversity in our own team.
  • Highlight the importance of empathy and community connections in the design process.
  • Apply behavior change strategies in our visual work – to increase impact.
  • Support each other as we continue to learn, advocate, and grow. 

We strive to add to this list, and we welcome your ideas!

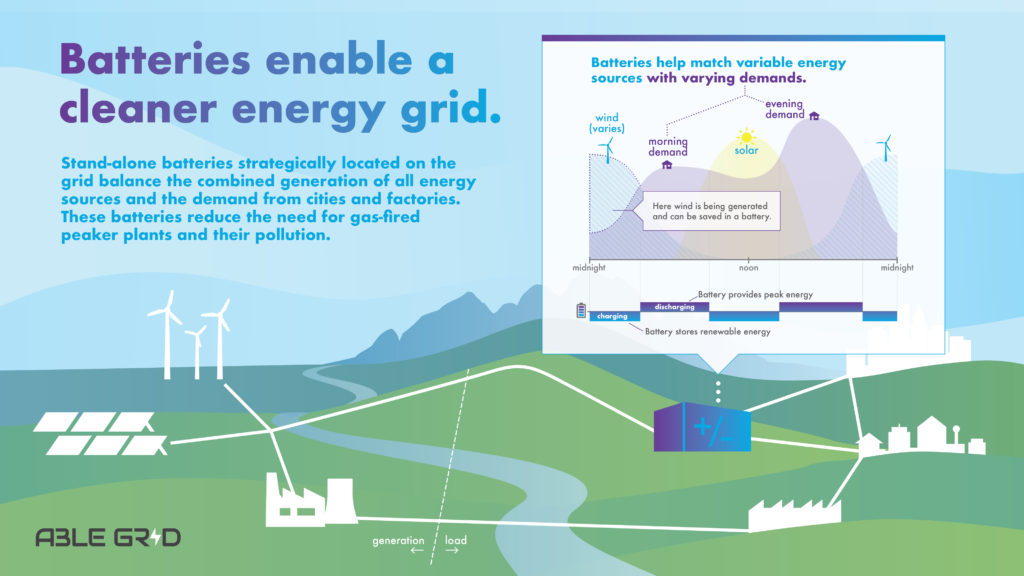
Sketches that show Scenario

Process vs. Scenario Visuals

Beginning any infographic project, a big question is 'How do I make this information visual?’ Lucky for us, clues exist within the information itself. Once we determine what message we’re aiming to communicate to a specific audience, the form of the infographic begins to emerge.

Designers from all disciplines talk about ‘form follows function’. For infographics, visual form follows the content.

When working with narrative information (where we’re trying to explain something to the audience) there are two high-level visual structures that consistently re-occur: Processes and scenarios.

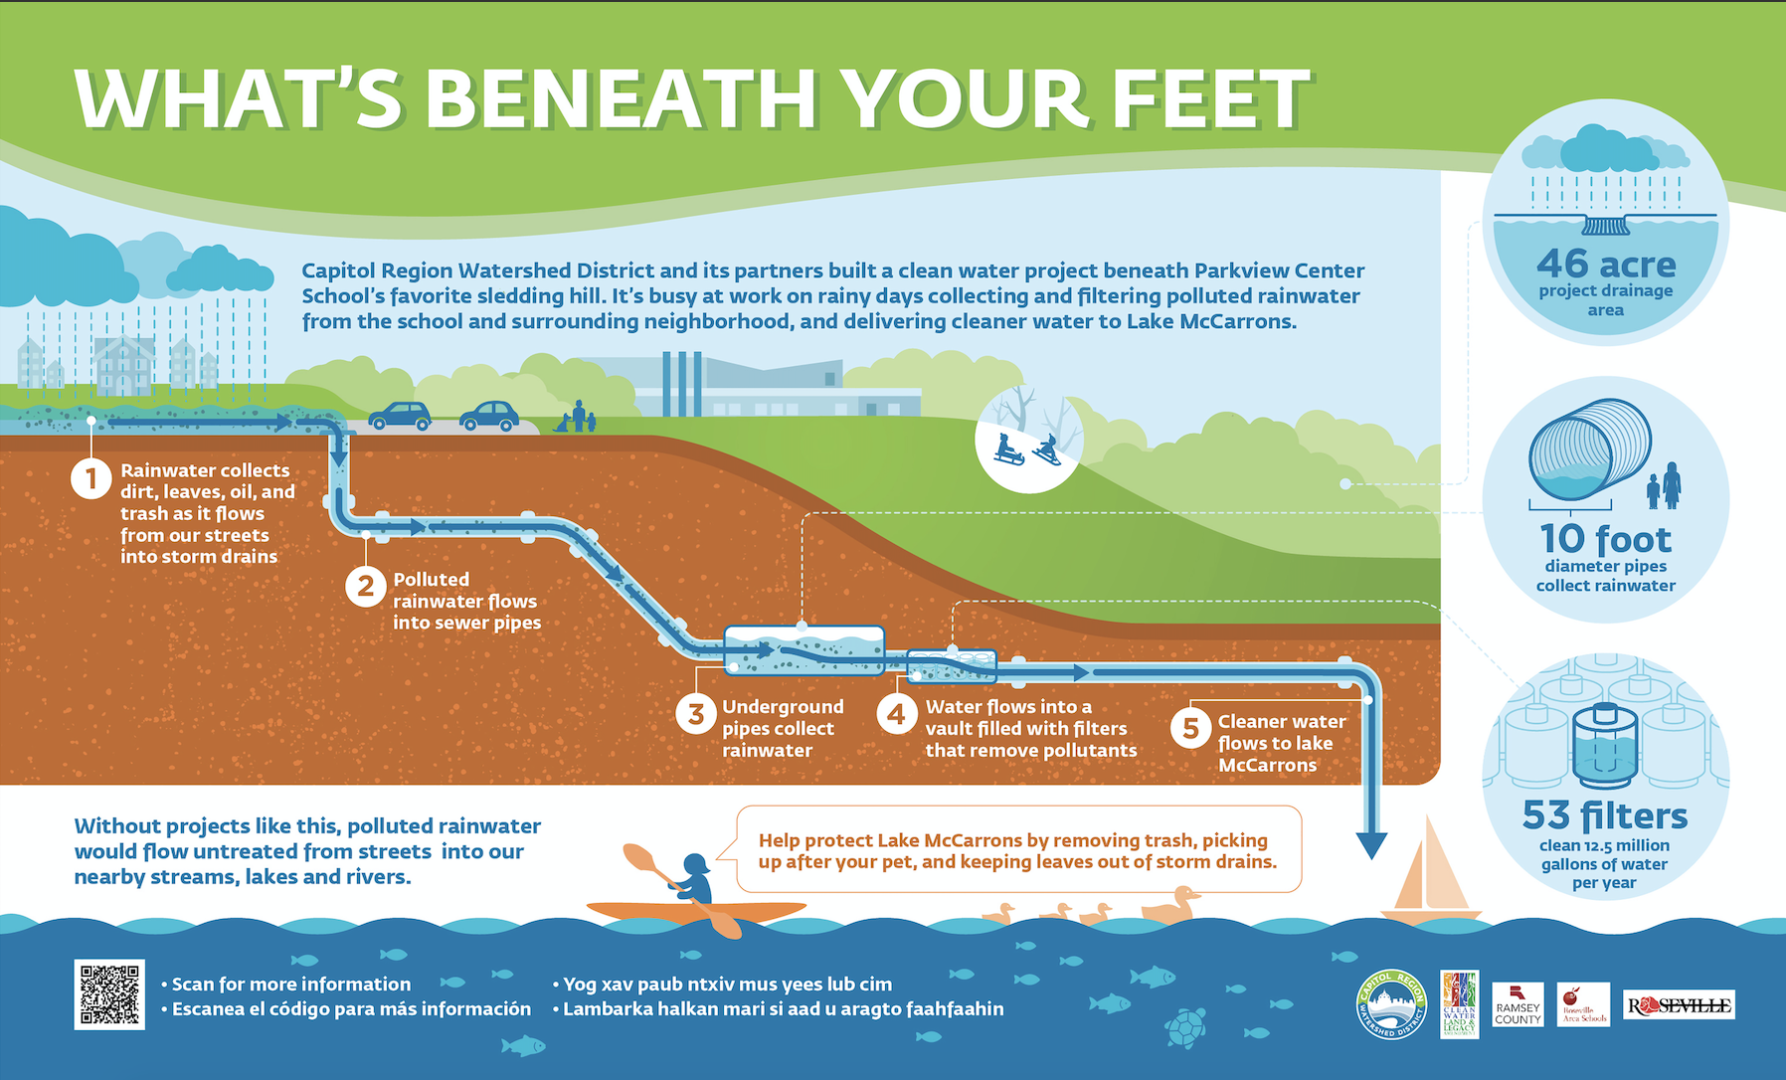
PROCESSES:


Sketches that show process

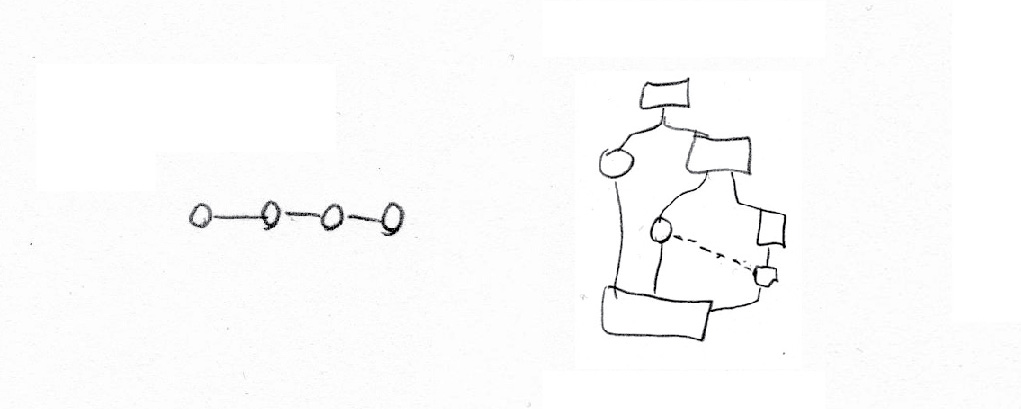
Processes include timelines and step-by-step flows of information. These can be visualized through any of the following sketches. A process has an entry/exit point (or points) and an order to the steps (at least some of them).

Examine your content and ask yourself:

  • Are we guiding the viewer through a series of steps?
  • Is the order of the elements important to the message we’re trying to communicate?

If so, you might have a visual process on your hands.  

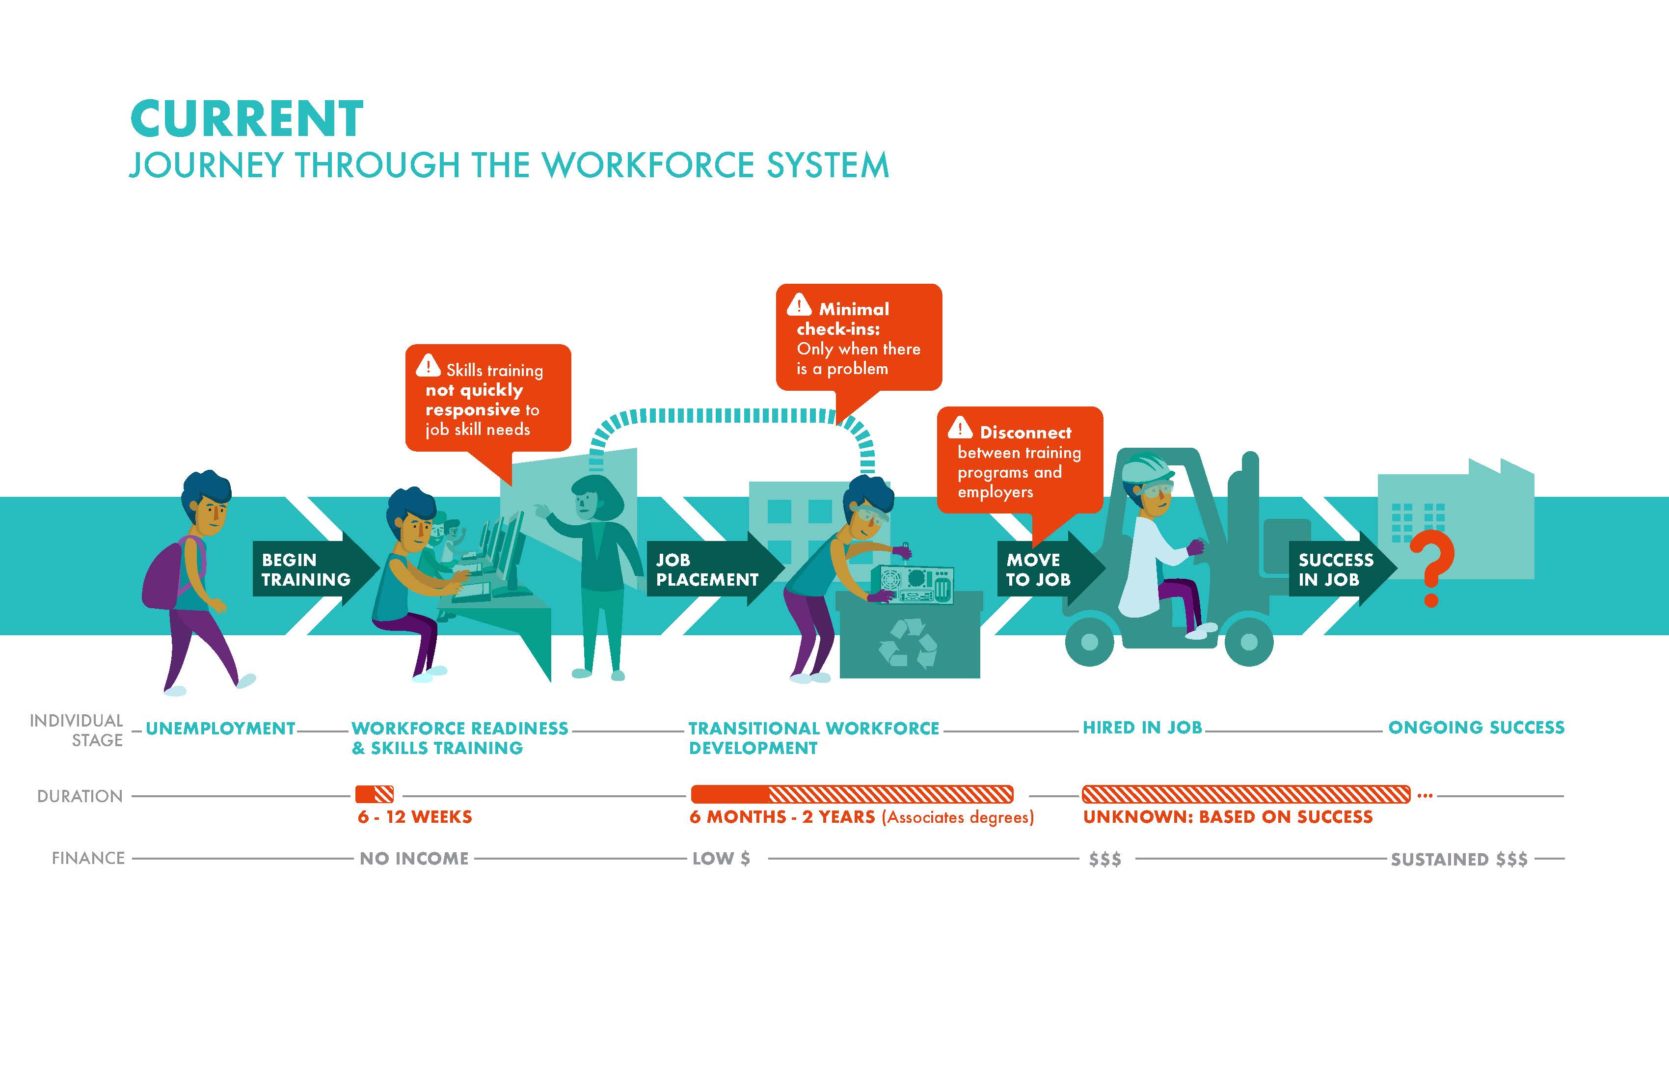
Here's some examples of process-focused infographics:

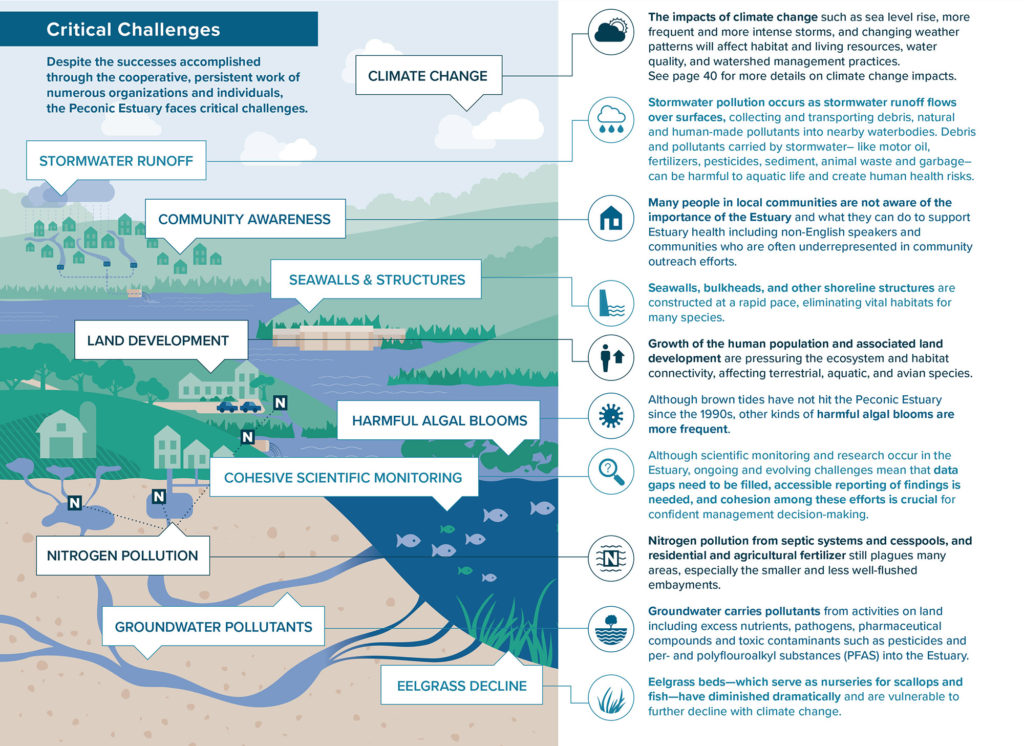
SCENARIOS: 


Sketches that show Scenario

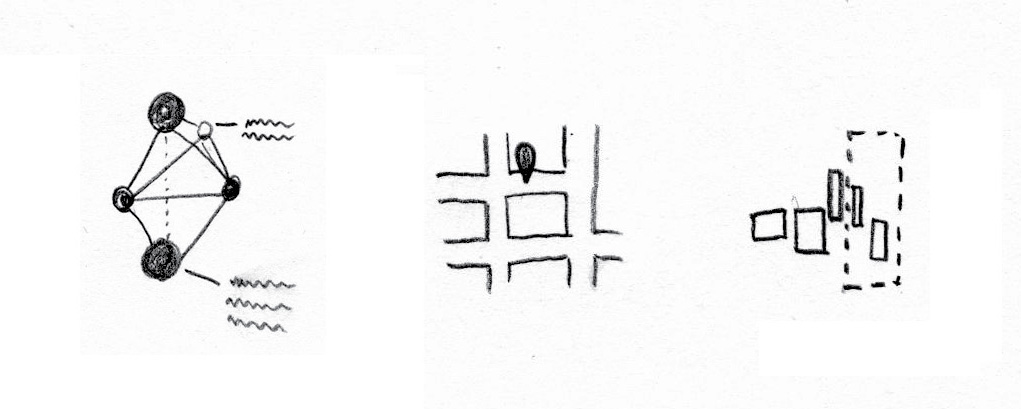
Scenario-based visual structures include maps (both geographic and conceptual), systems, networks, and lay-of-the-lands. These show how pieces of info relate to other pieces, and to whole contexts. Scenarios are often annotated to help viewers understand the components of the visual.

Examine your content and ask yourself:

  • Is it important that viewers understand the big-picture of this message?
  • Is the organization of the pieces of content important?
  • Would a zoom-in or zoom-out of the information be interesting?

If so, a visual that shows the scenario could be useful.

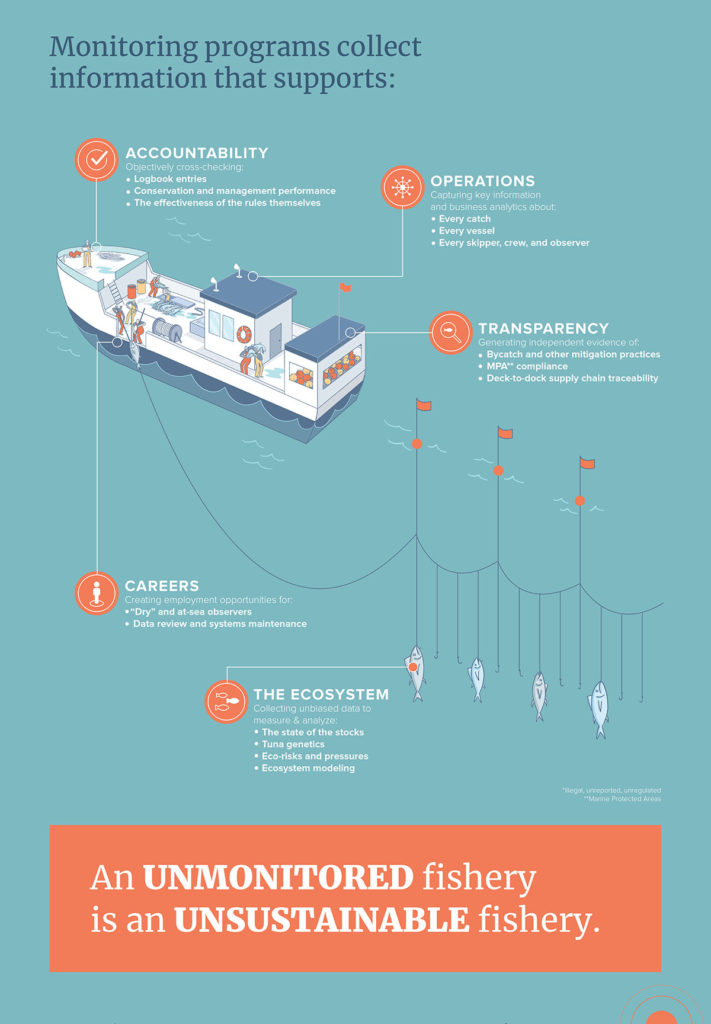
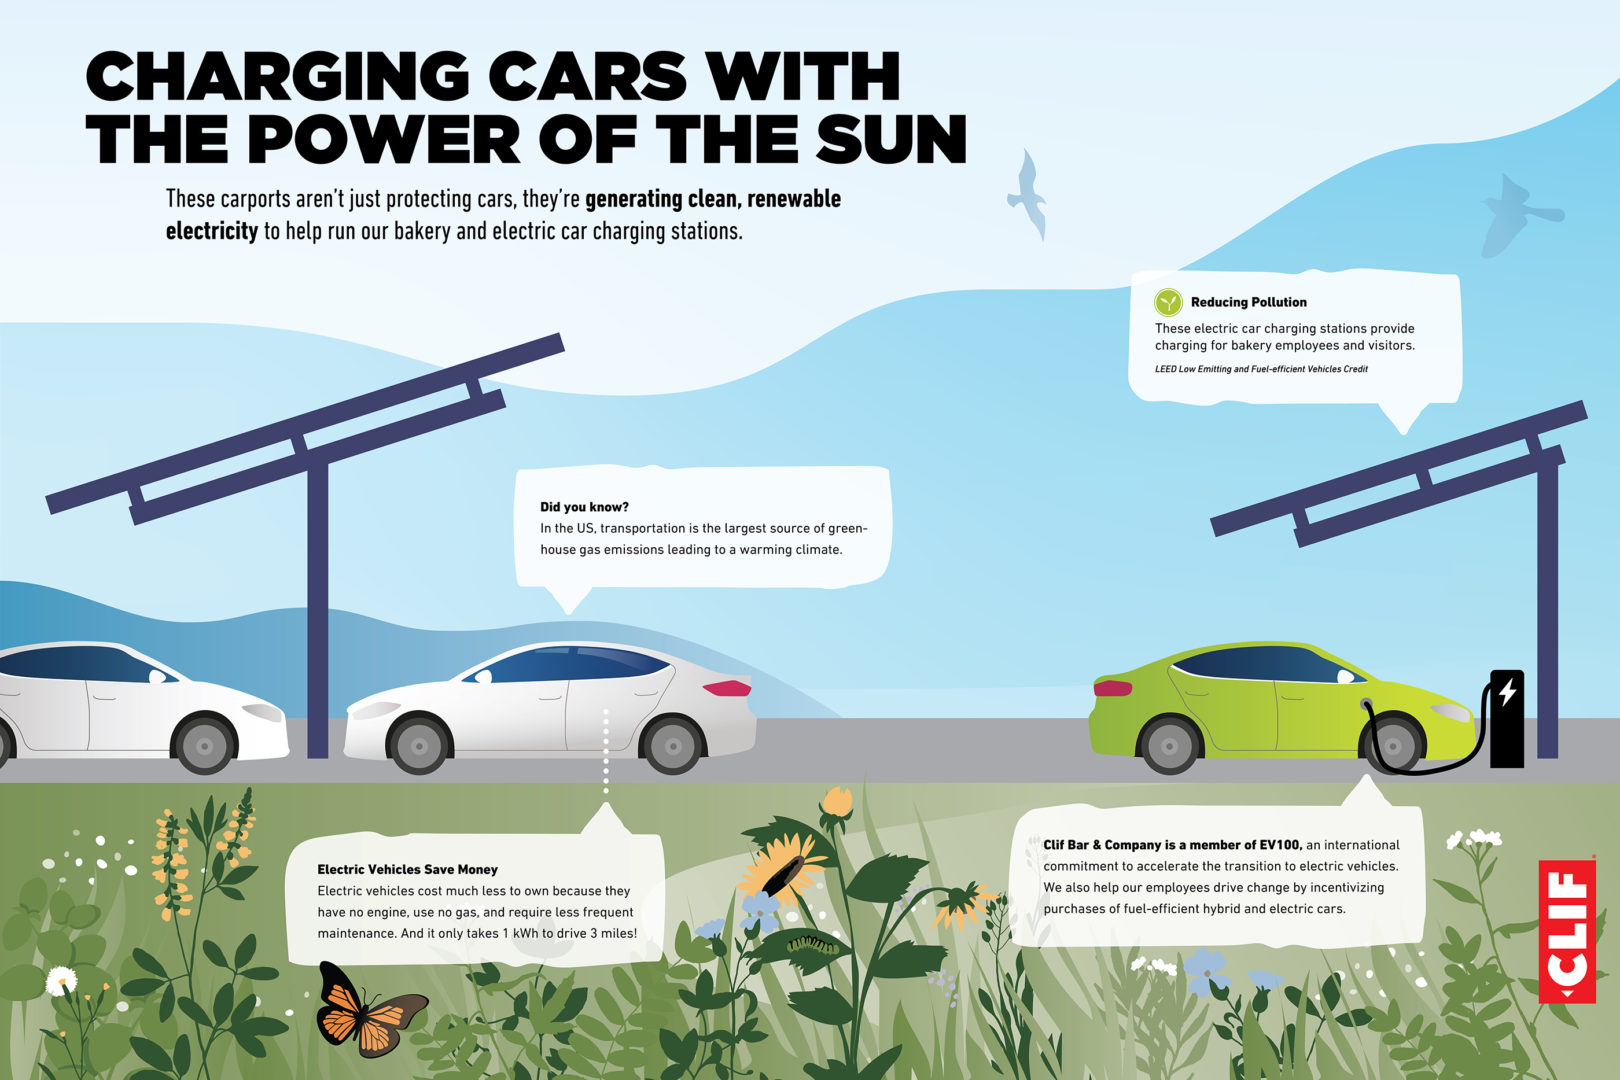
Here's some examples of some scenario-focused infographics:

COMBO:


Sketches that show a combo of process and scenario

Sometimes, a combination of these two approaches leads to the most engaging and educational visual. In these cases, typically one or the other approach becomes the most prominent. 

Keep in mind that the more visual approaches you combine, the more complex your infographic gets: and the more careful you have to be about using the principles of design. And that’s a topic for another time 🙂 

Here are some examples of the combination of Scenarios & Processes used together in infographics:

Finding the Framing for Your Message

Part of the process of creating a visual story is developing the storyline. This determines what to emphasize in a message, how and what to explain, and what to leave out. Some call this the 'framing' of a message. 
There's a group doing evidence-based communication research to help frame some of the most challenging messages in the social and environmental space.

FrameWorks helps mission-driven organizations communicate about social issues in ways that build public will to support change. All of their research is available online. From communicating about Climate Change in the time of Covid-19 to How to Talk About the Ocean so that People Will Listen to Changing the Narrative on Public Education, there's research on a variety of topics.
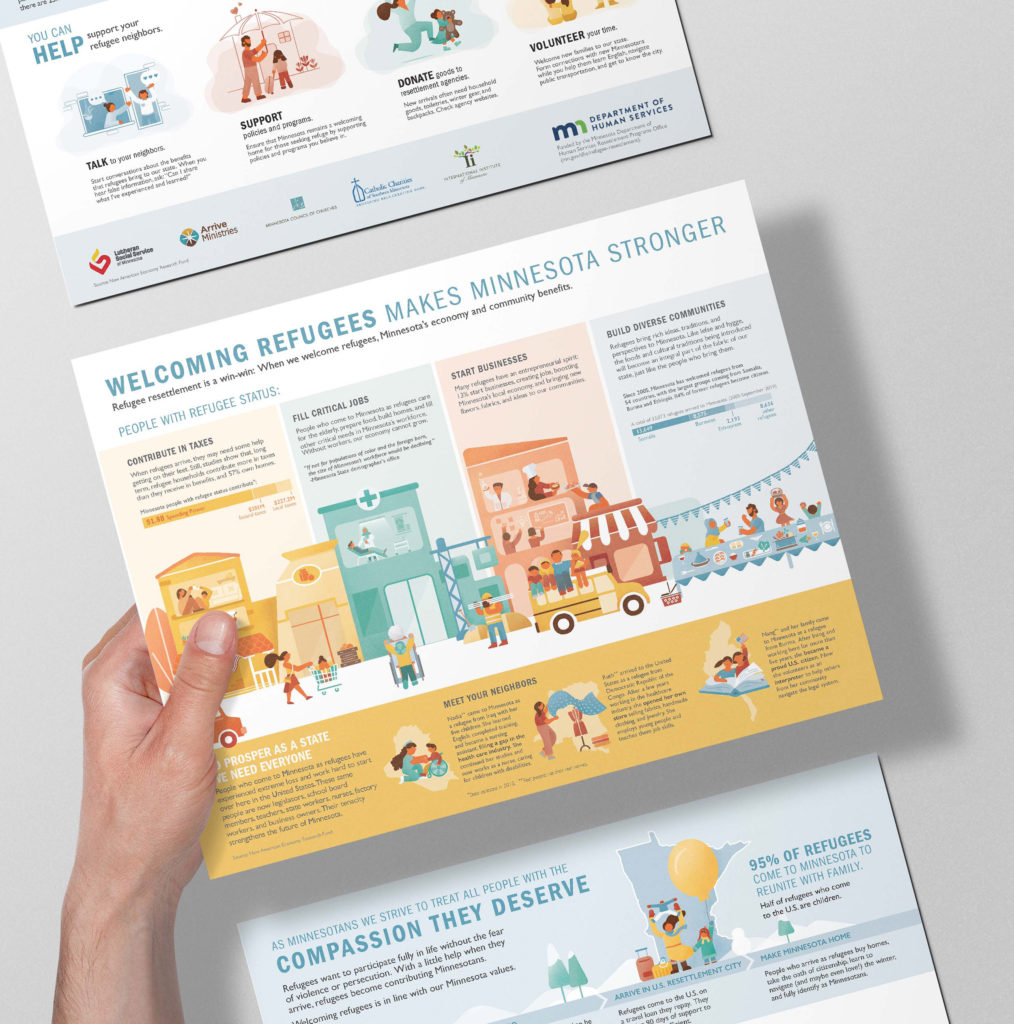
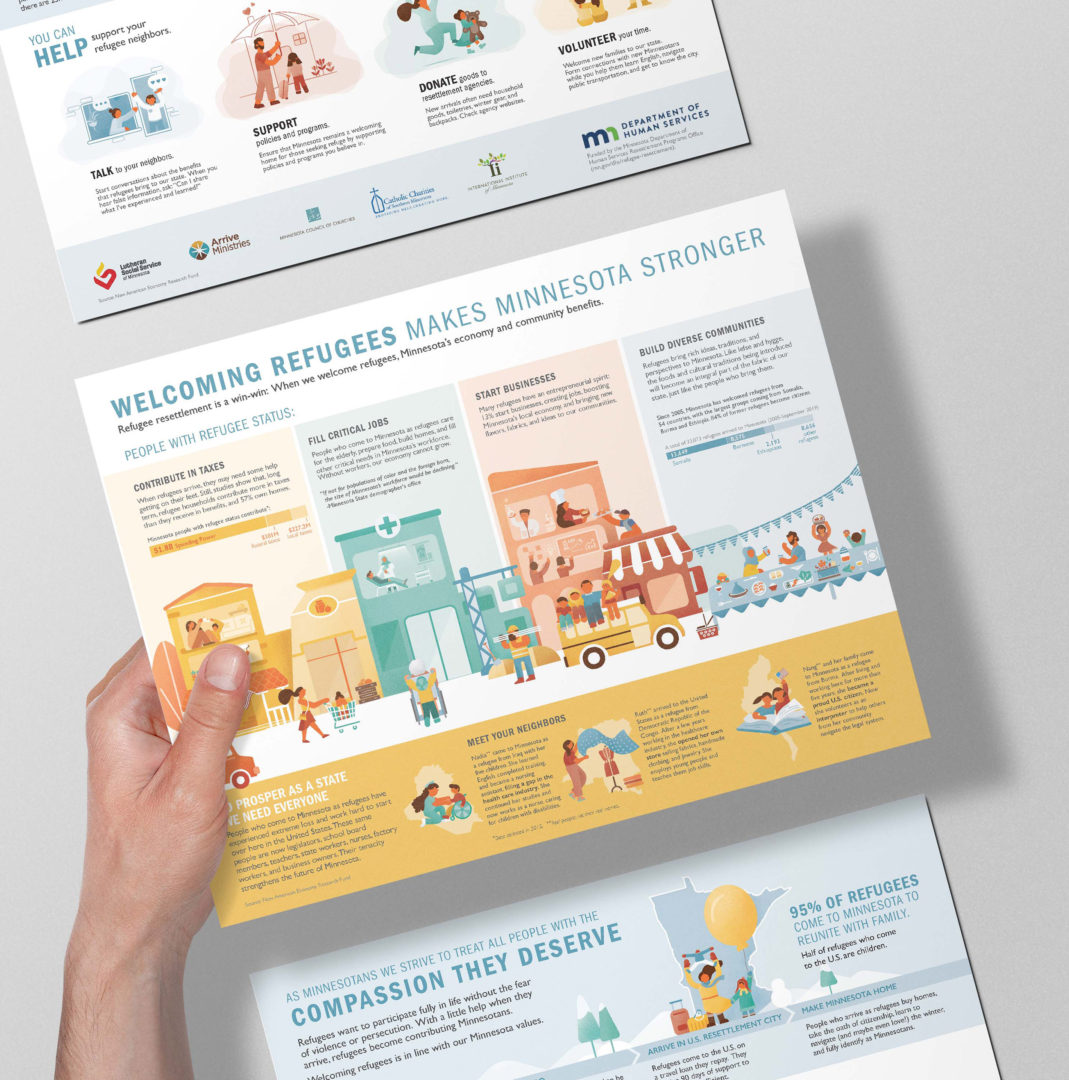
We got to use FrameWork's stellar work in developing recent refugee advocacy infographics. Bookmark this resource for your next communication strategy!

Clear Writing + Clear Visuals = Powerful Visual Stories

As communicators, it's important we use the language of our audience. While Background Stories operates in the world of visuals, we need words + images to create visual stories. (Words and numbers are great for communicating specific details; visuals are great at showing context.)
The words we choose have to meet people where they're at in their understanding of a topic. Non-experts aren't familiar with the jargon that experts use.

One tool that we love is the Hemingway Editor.

The website helps us edit text for clarity and alerts us if we jump from a 6th-grade reading level to a post-graduate reading level, which is easy to do in a scientific report. See what you think -- it could make your written work more concise and impactful. (Btw, we're not affiliated with the site, we just think it's cool -- and it's free!).

Happy writing!