Numbers are a useful way to quantify and understand the world around us. What numbers alone can’t do, however, is provide an emotional connection between the viewer and the data. To do this, we need to tell a story.
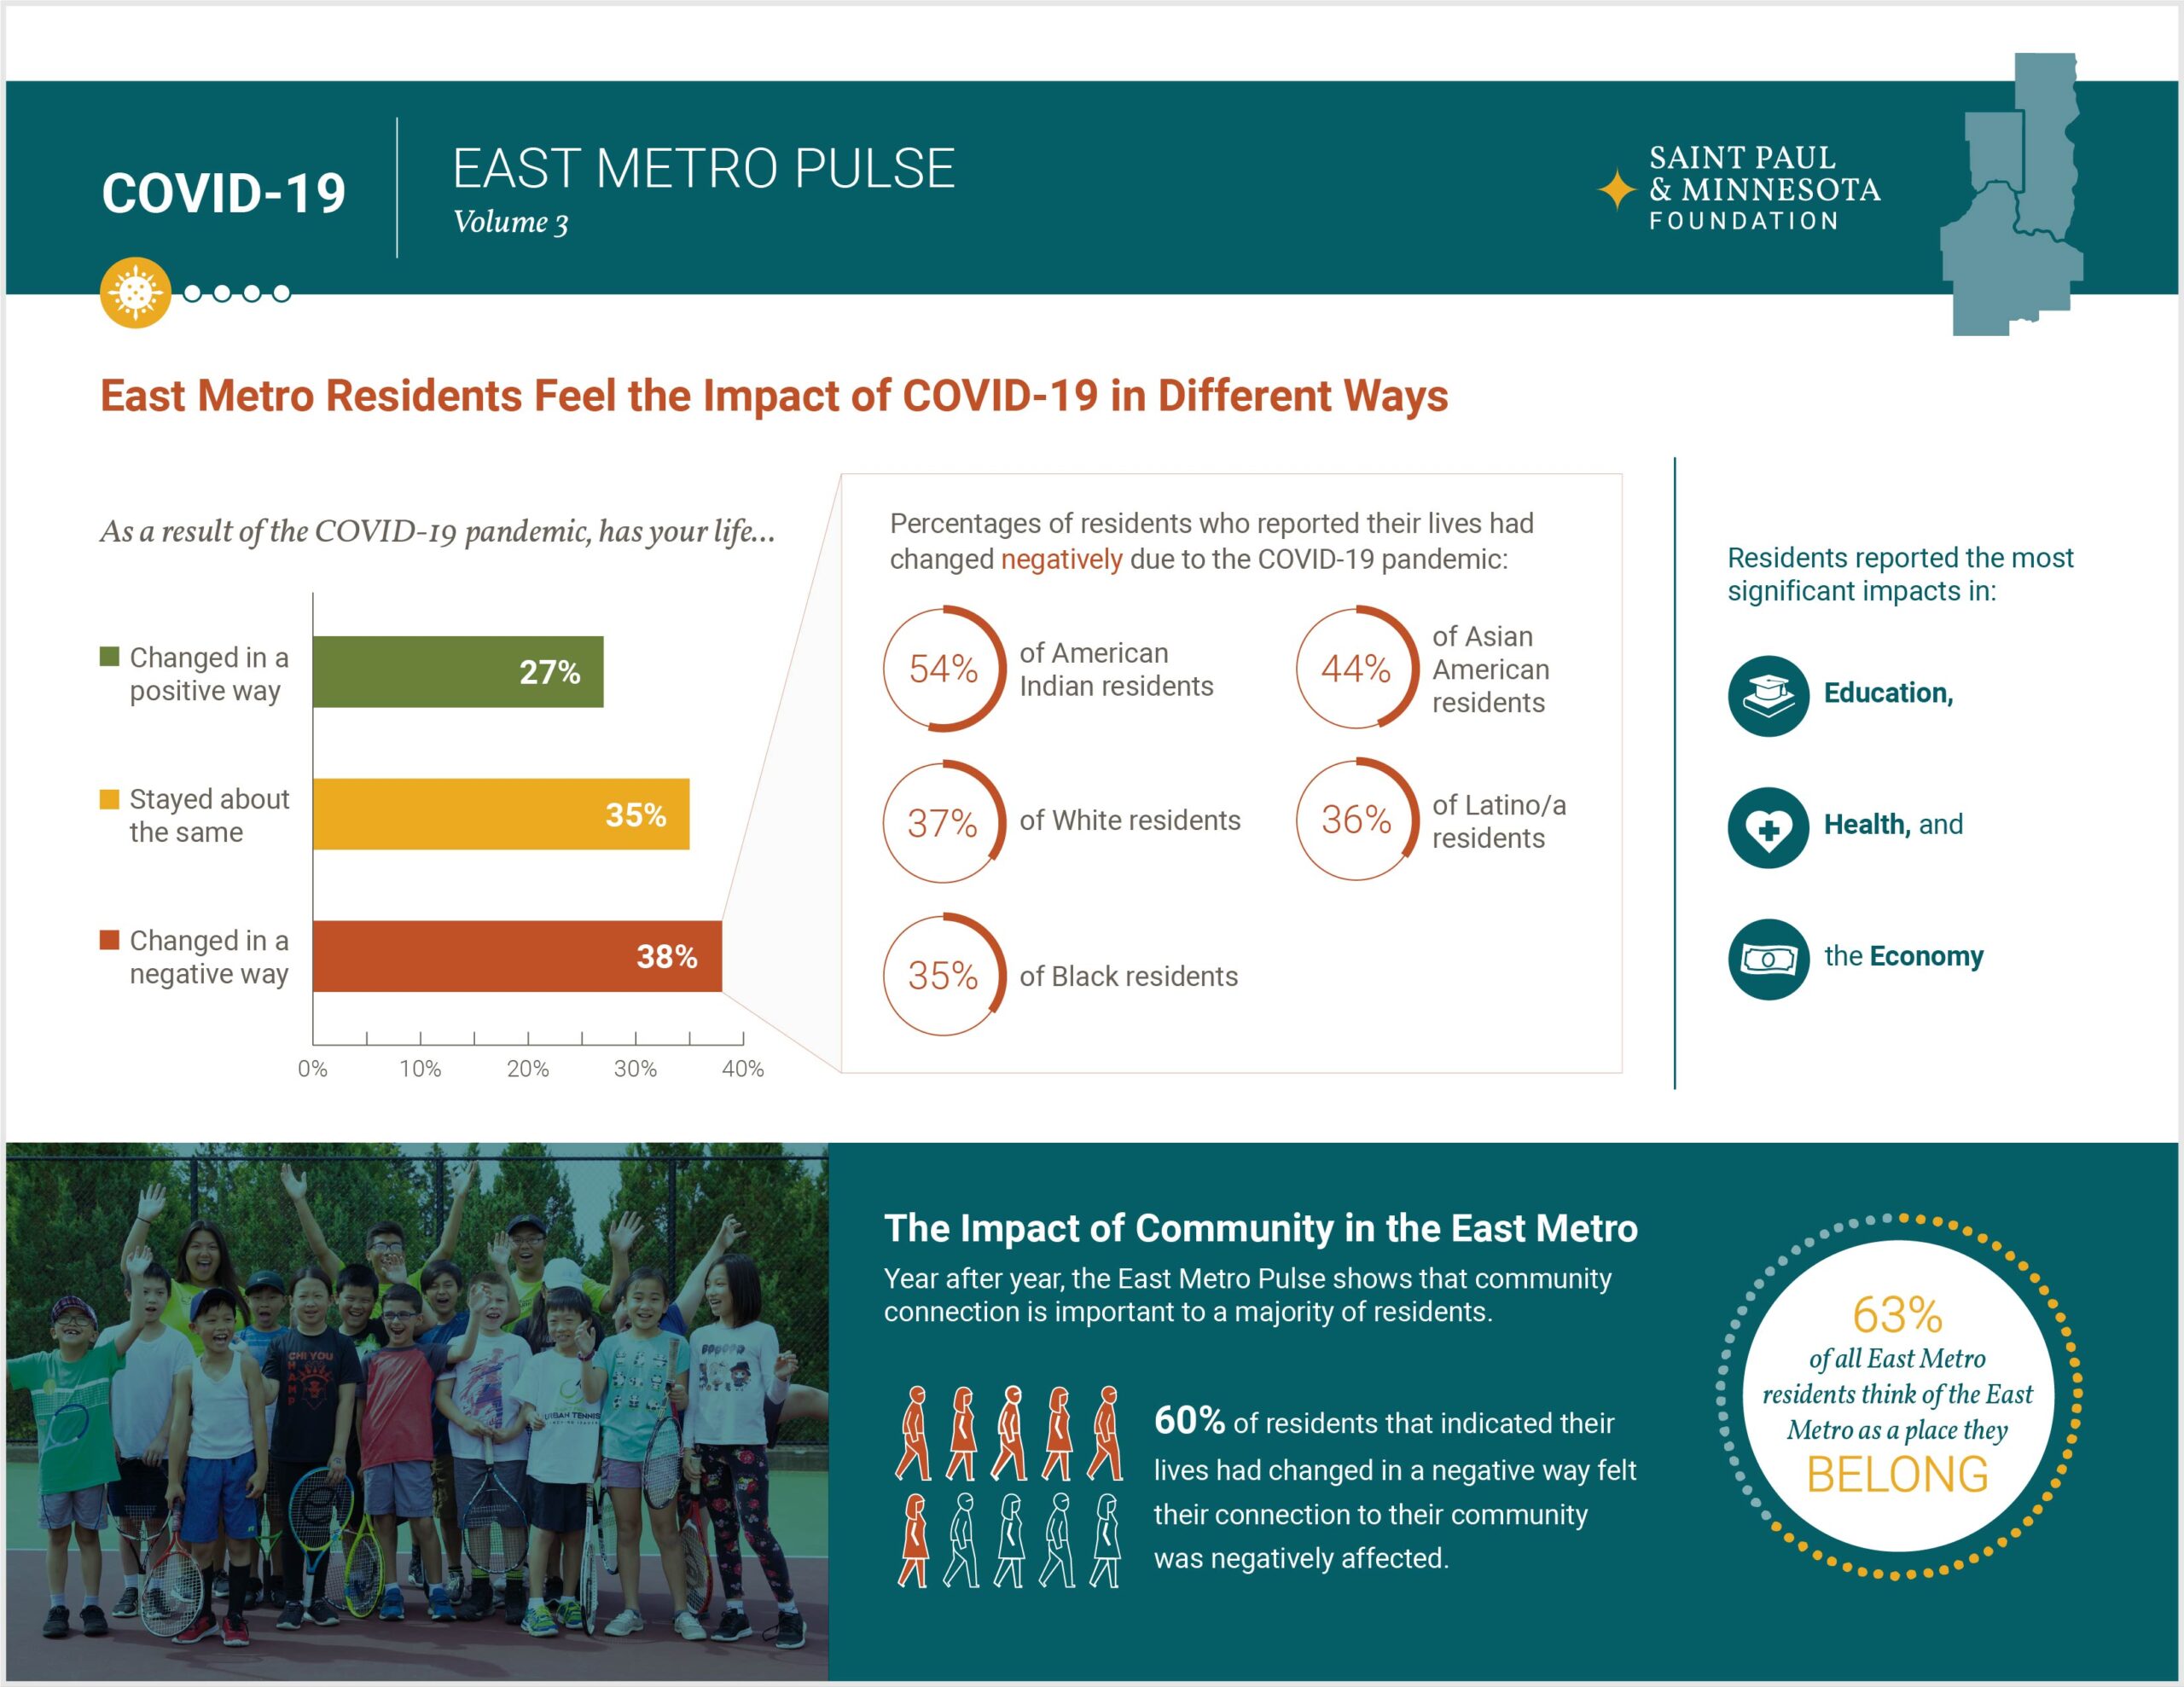
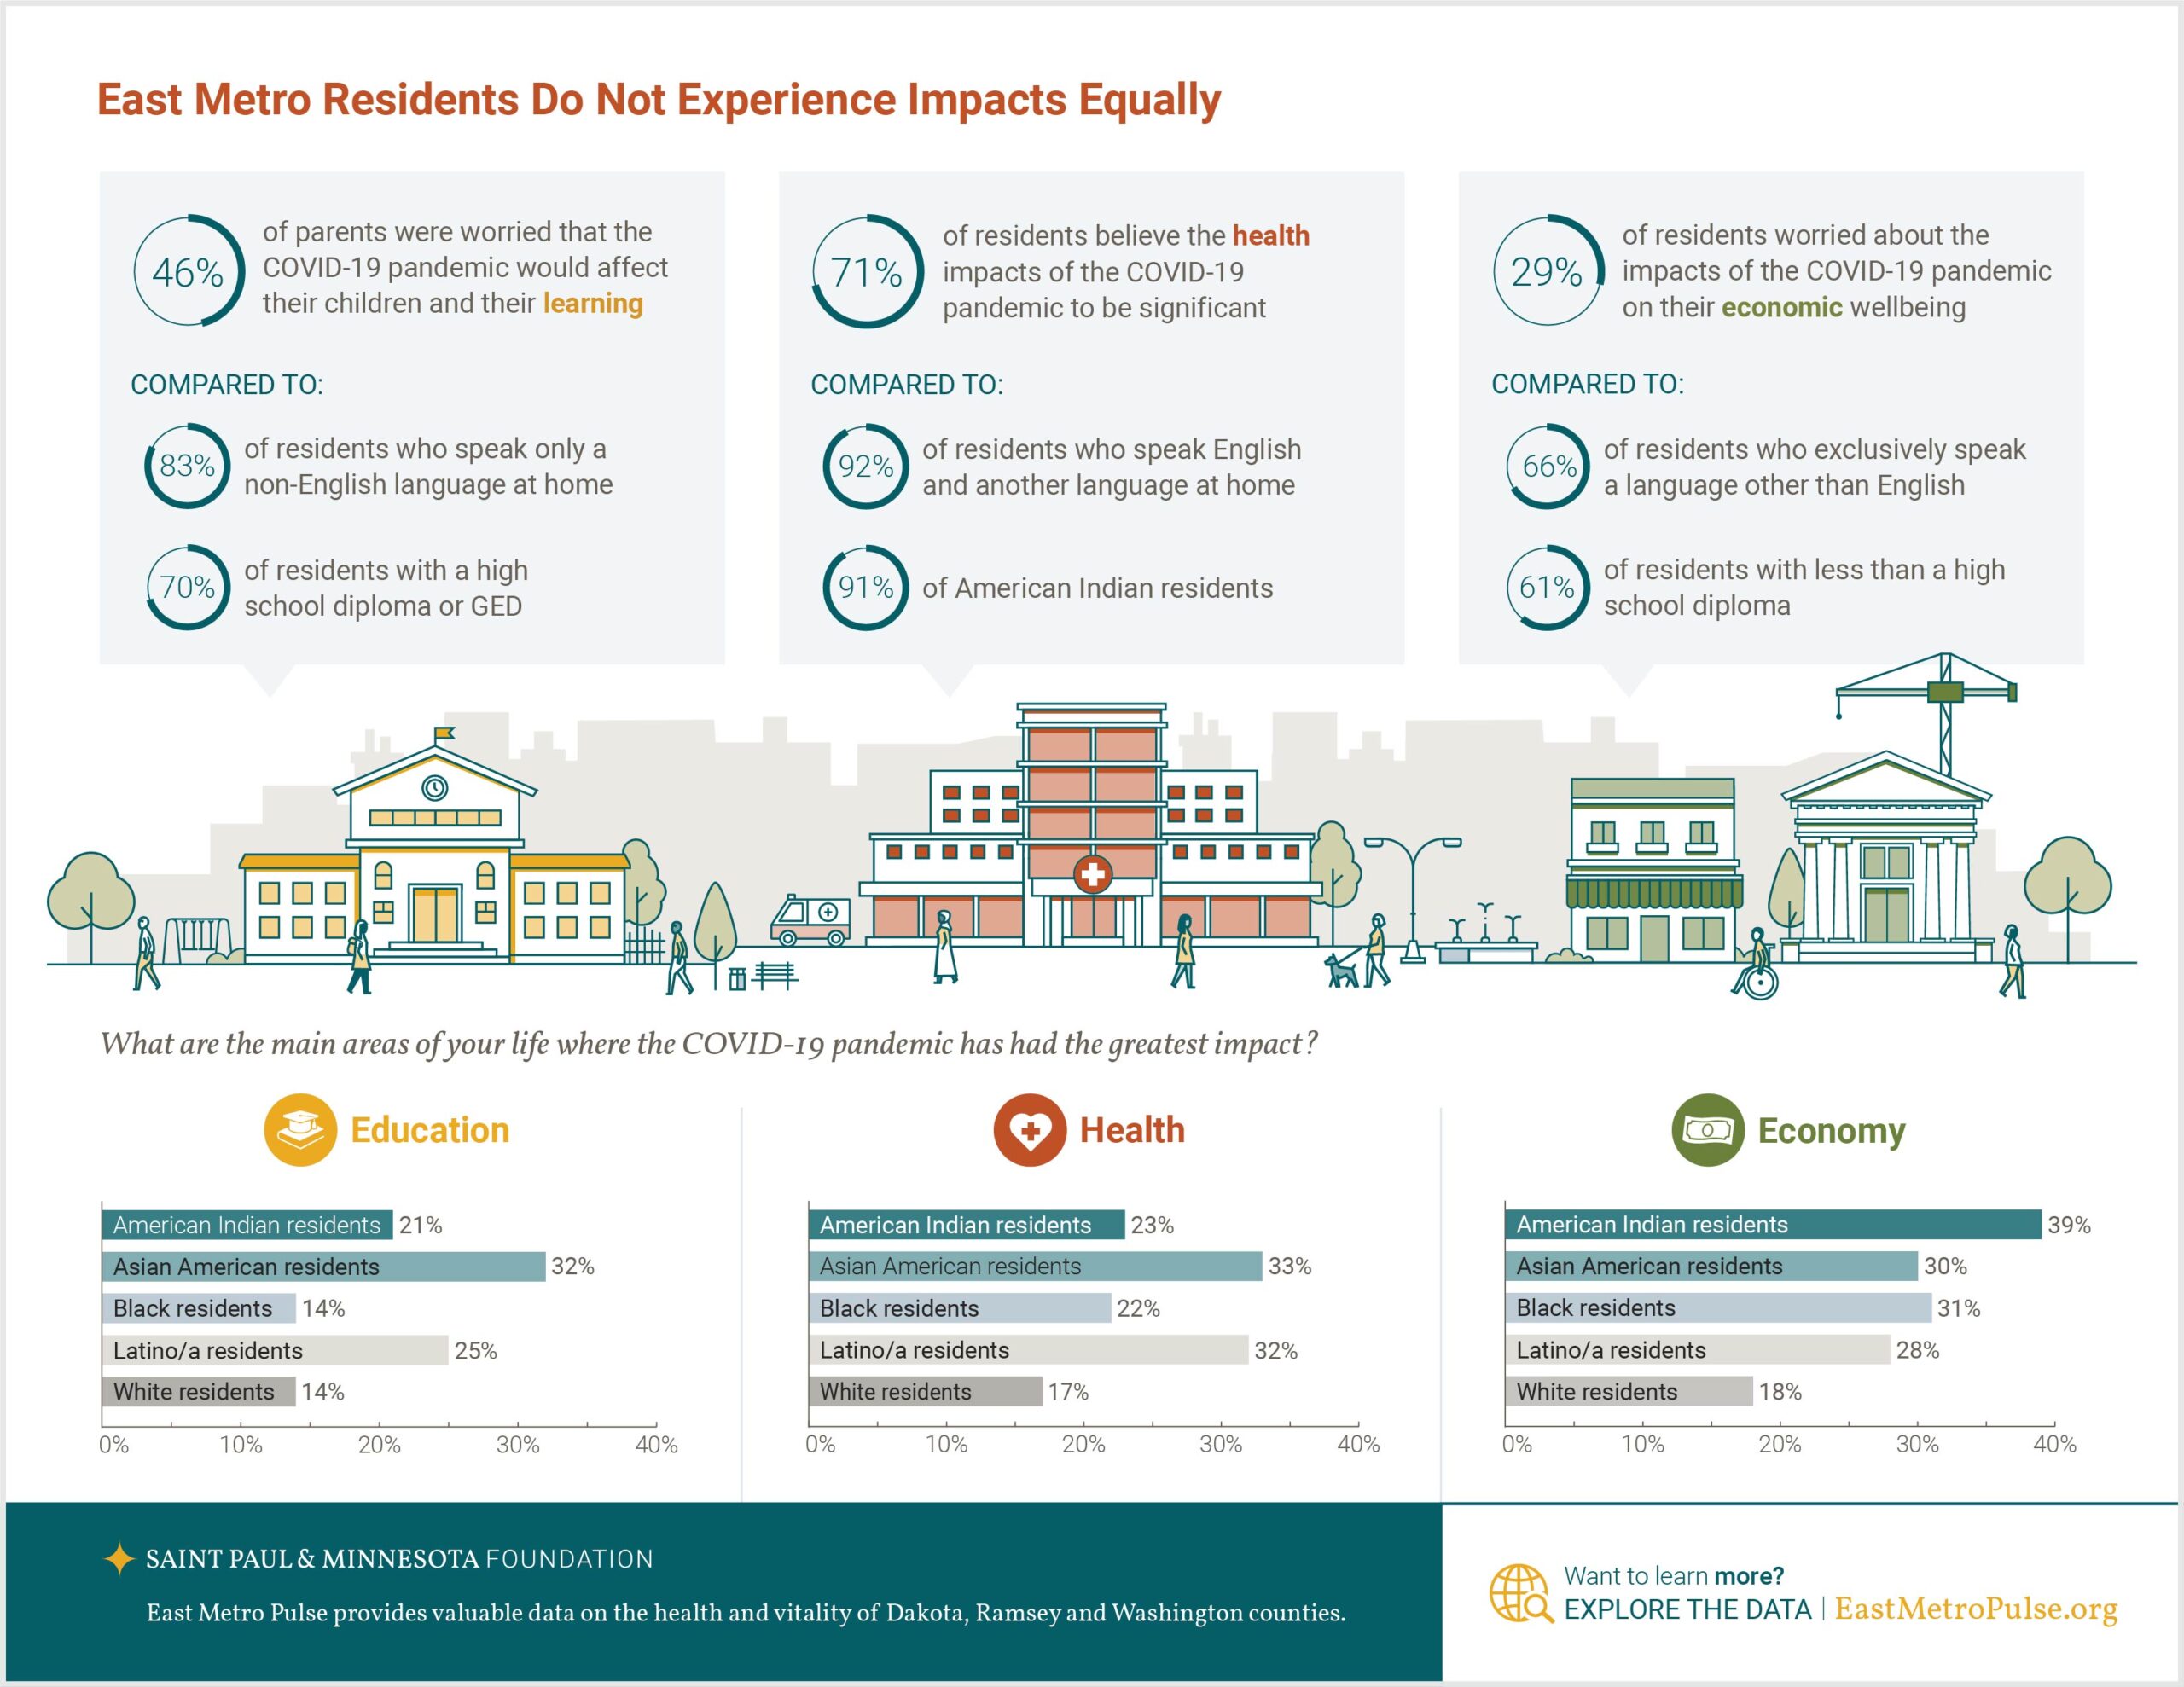
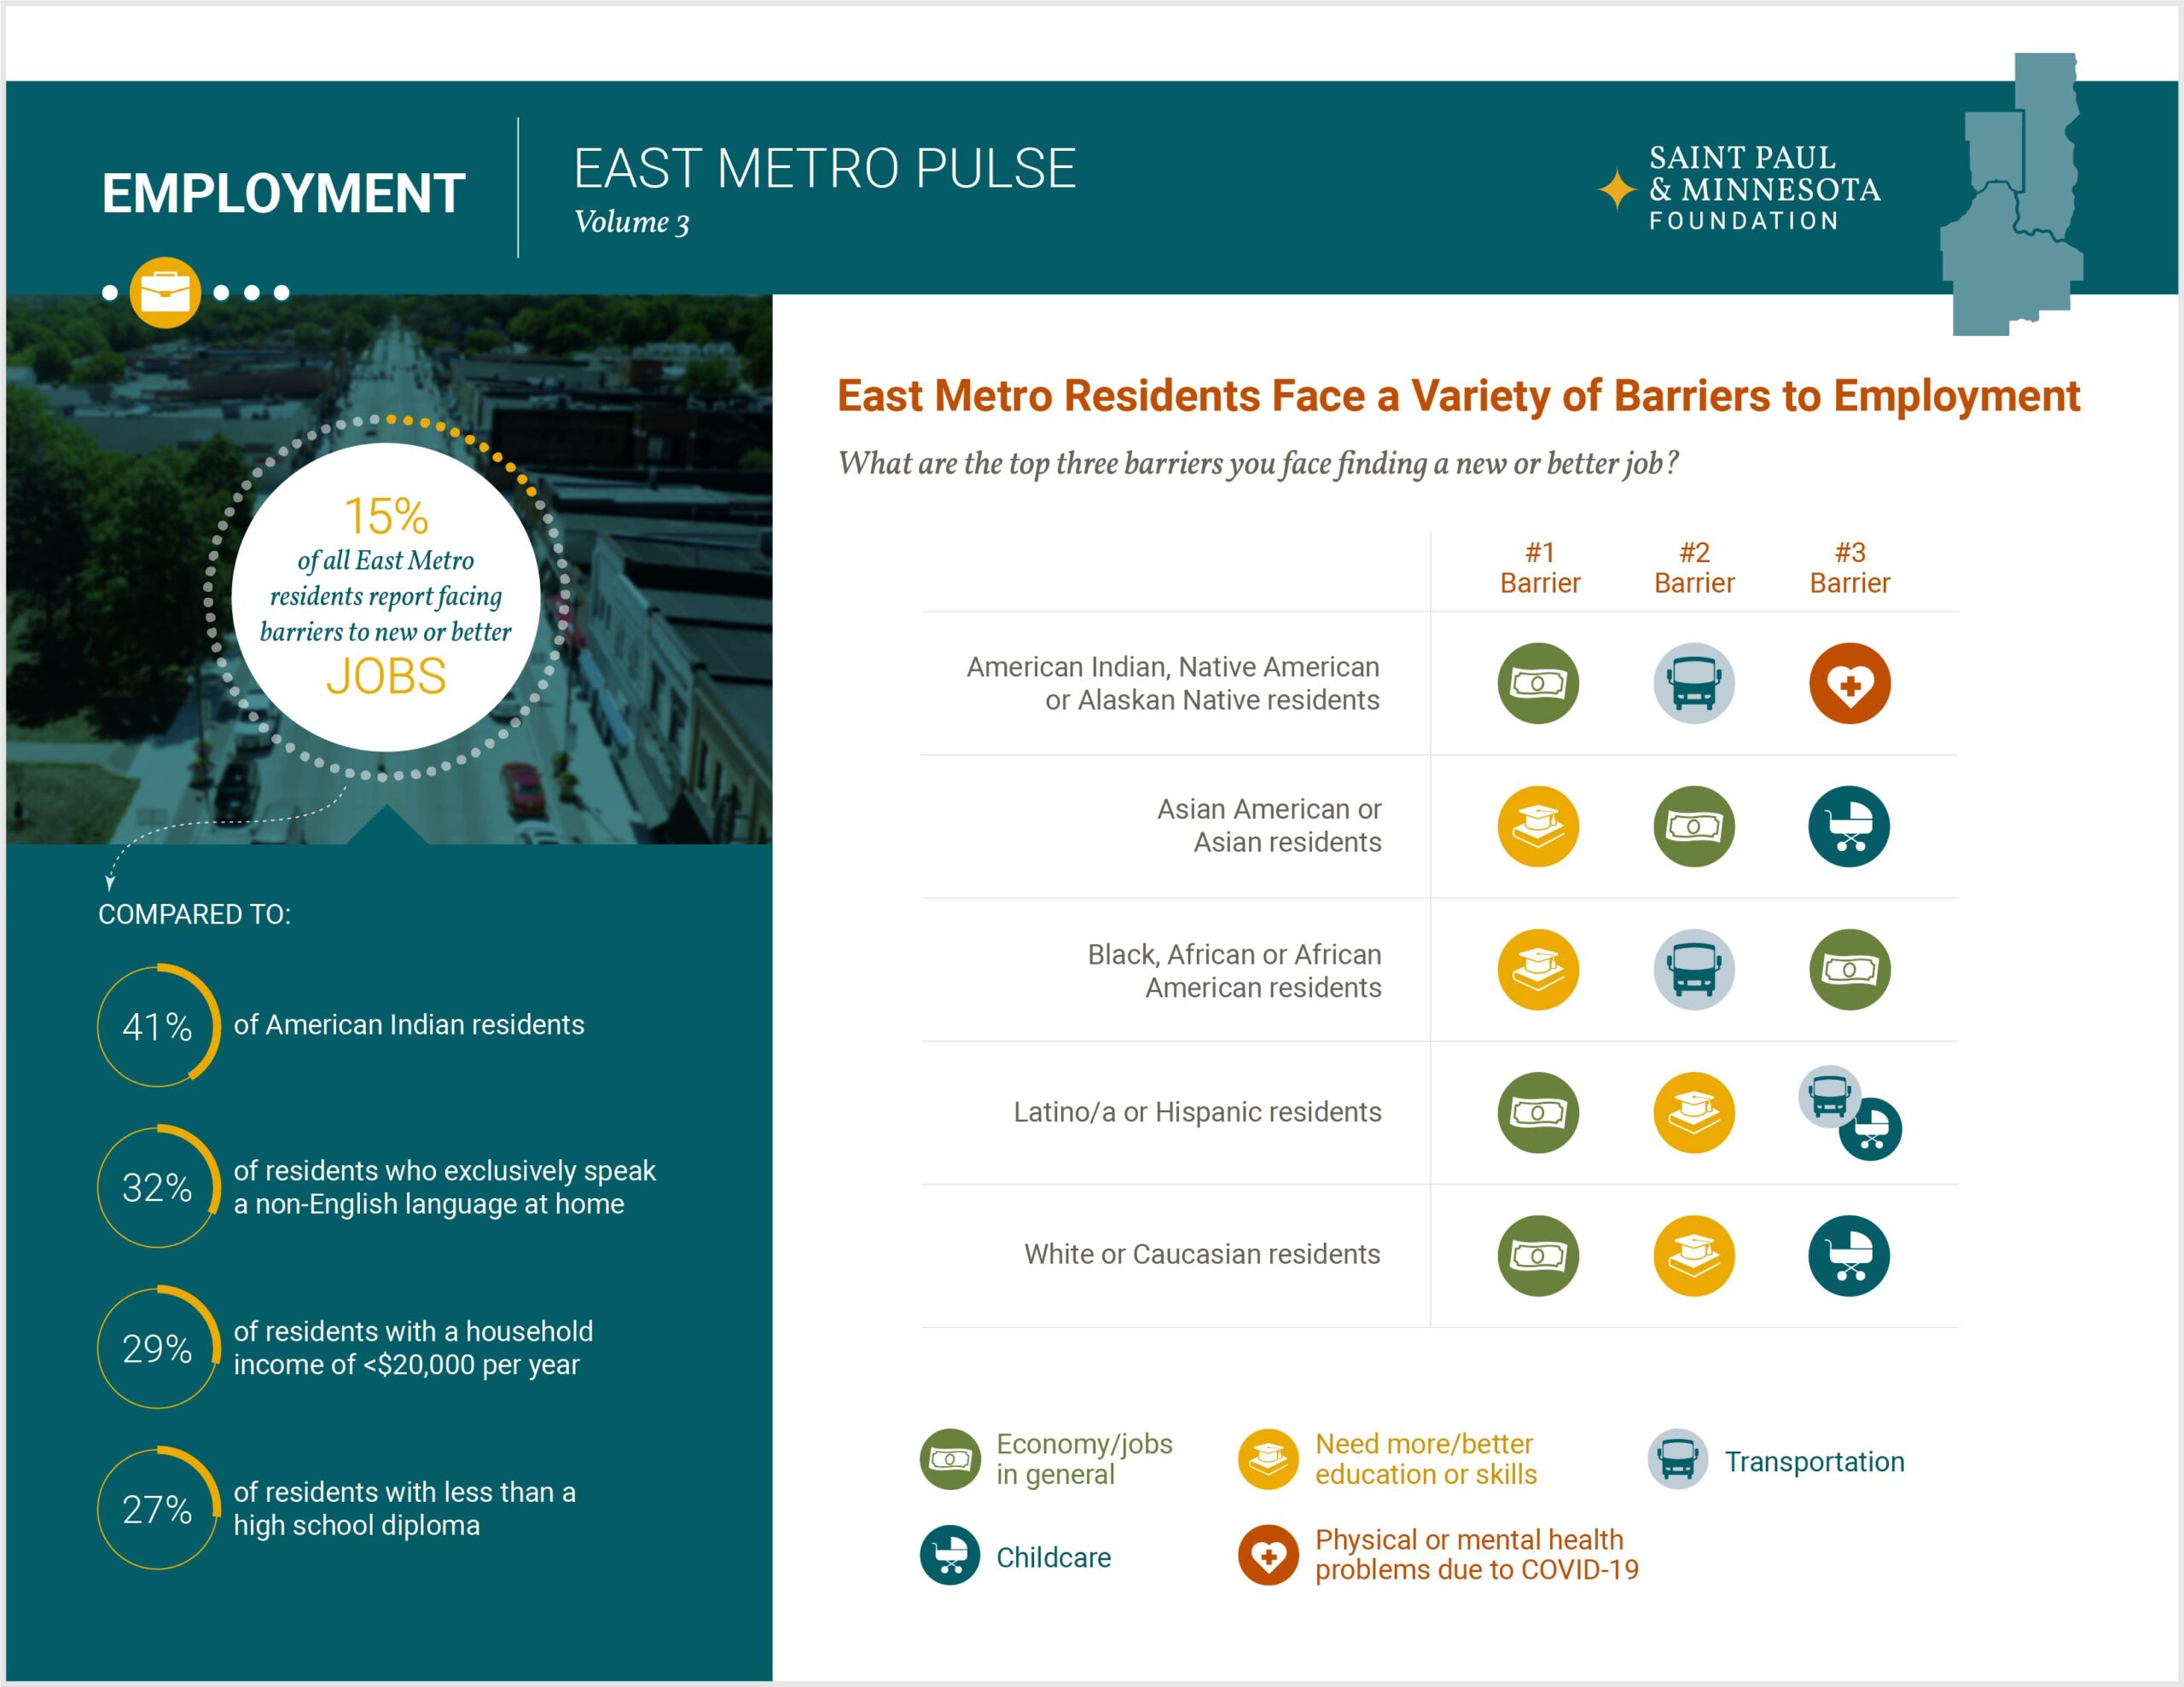
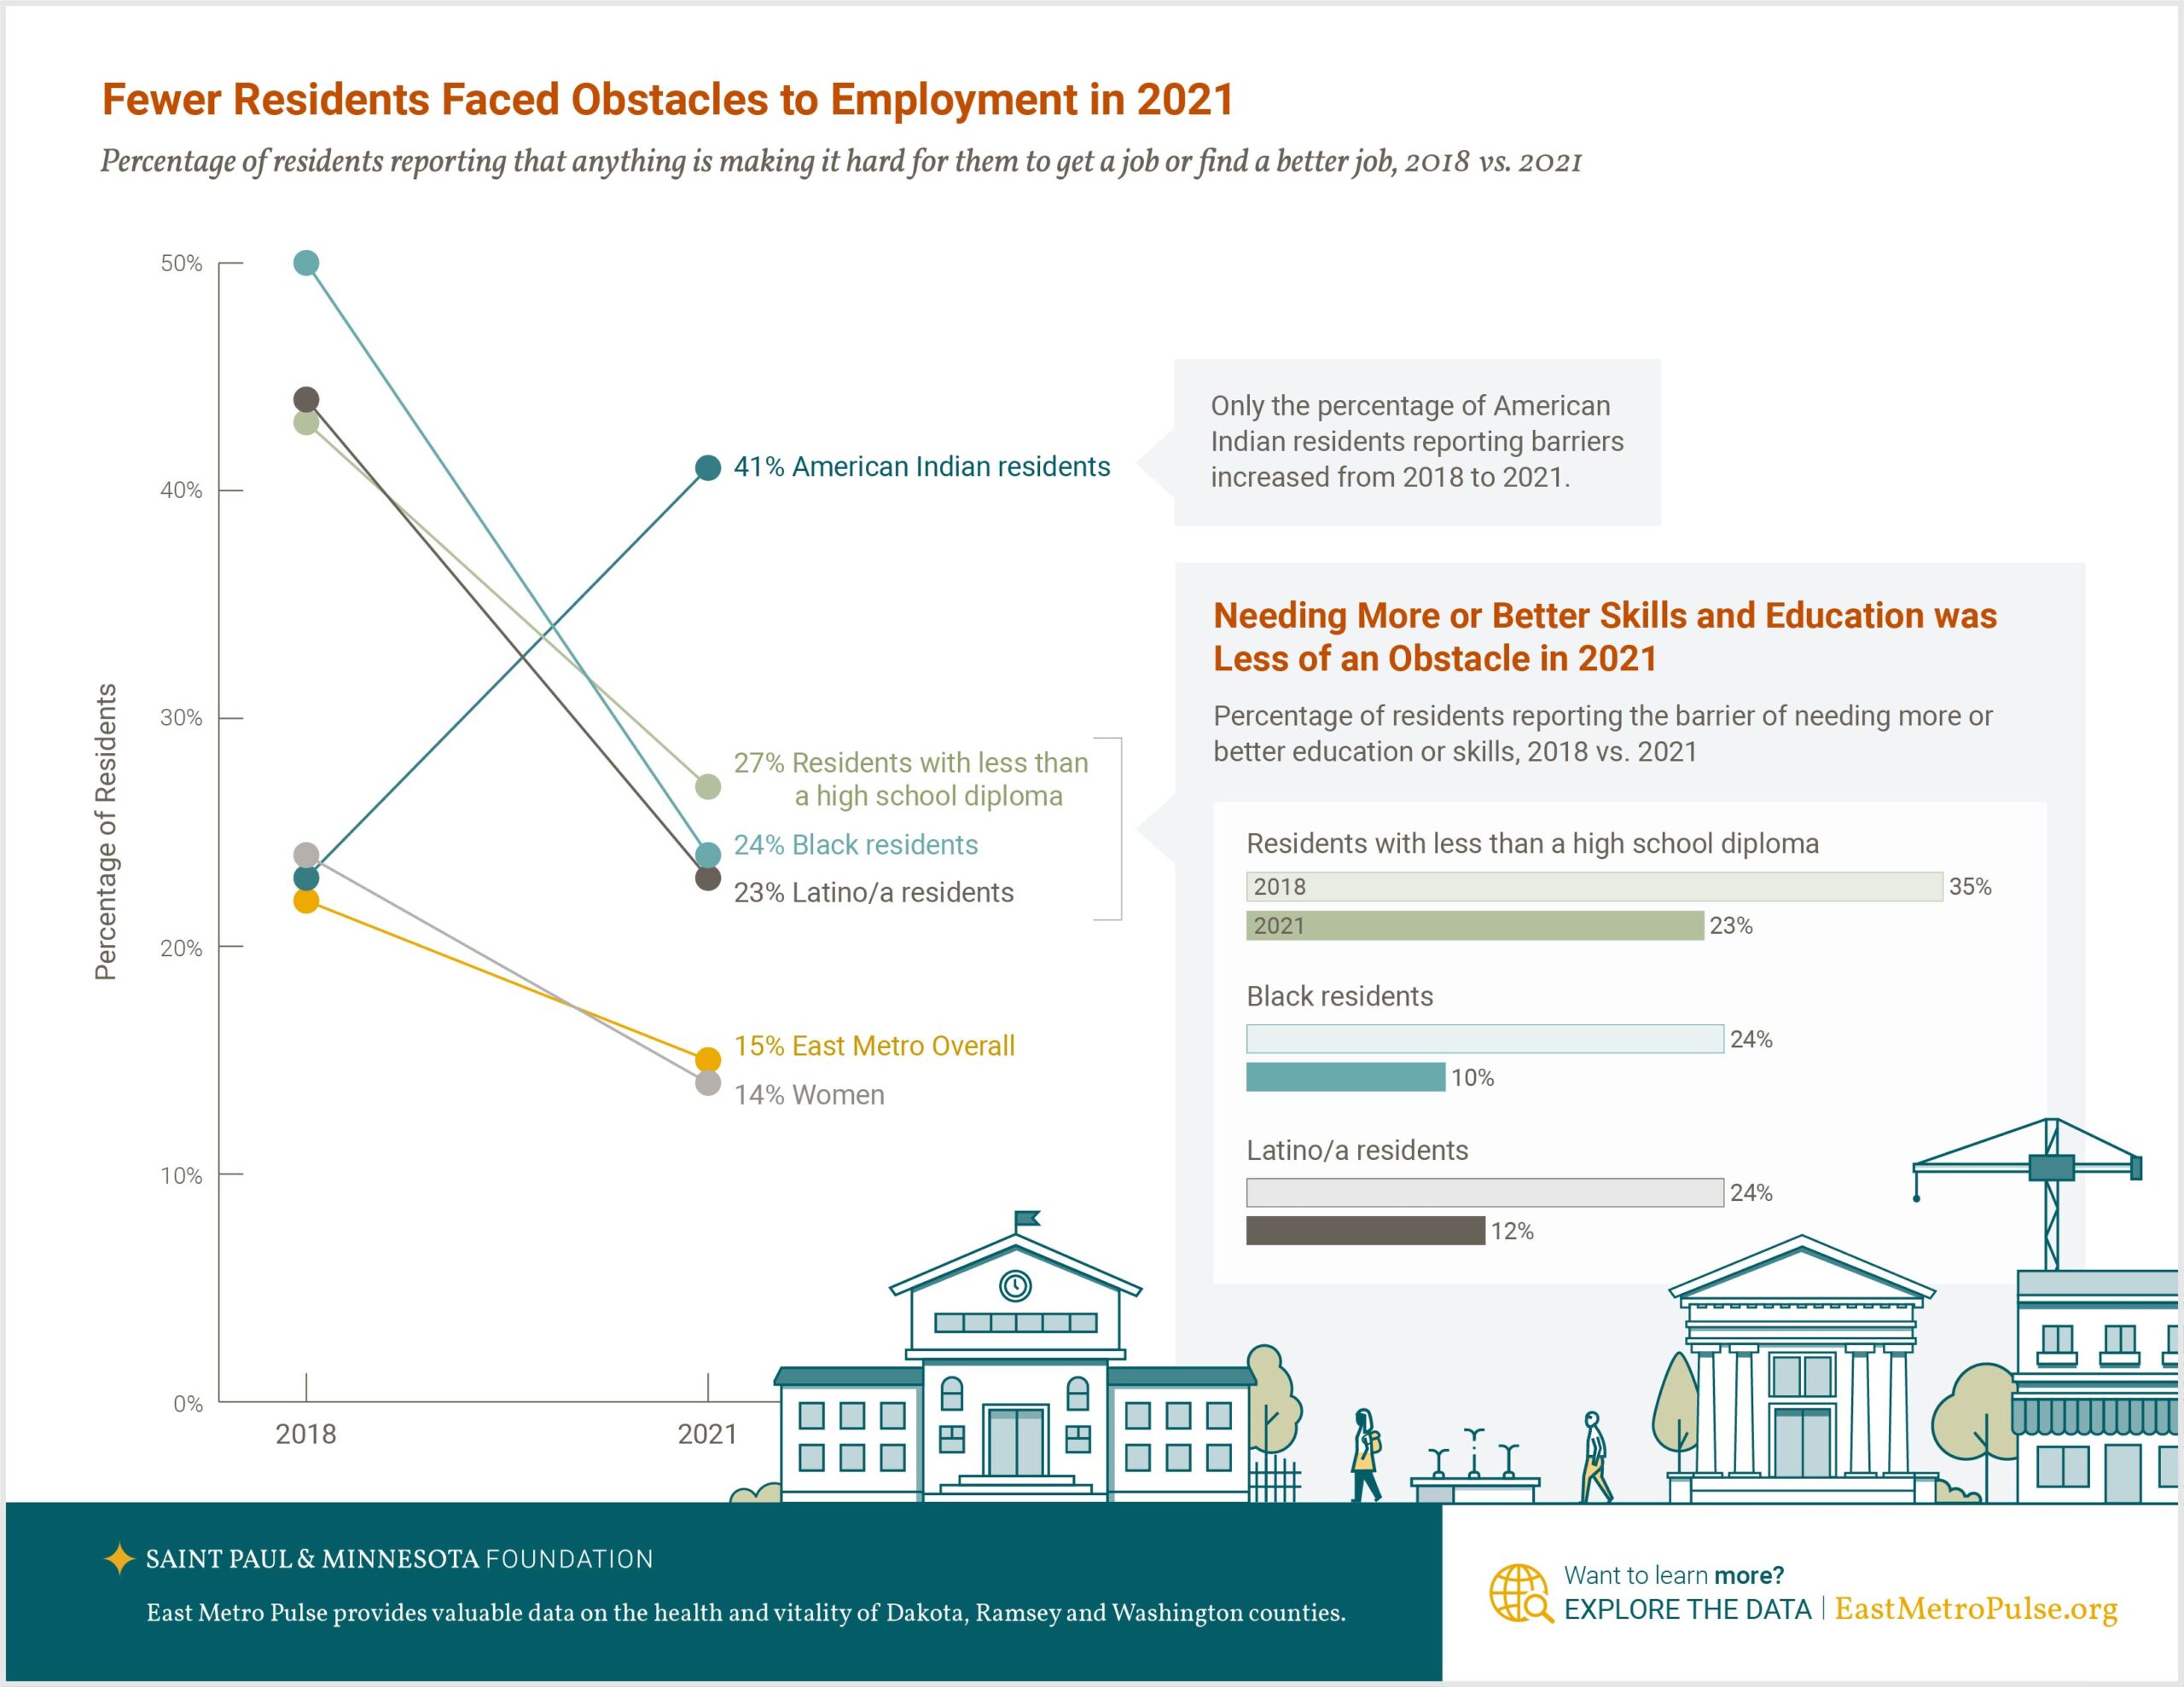
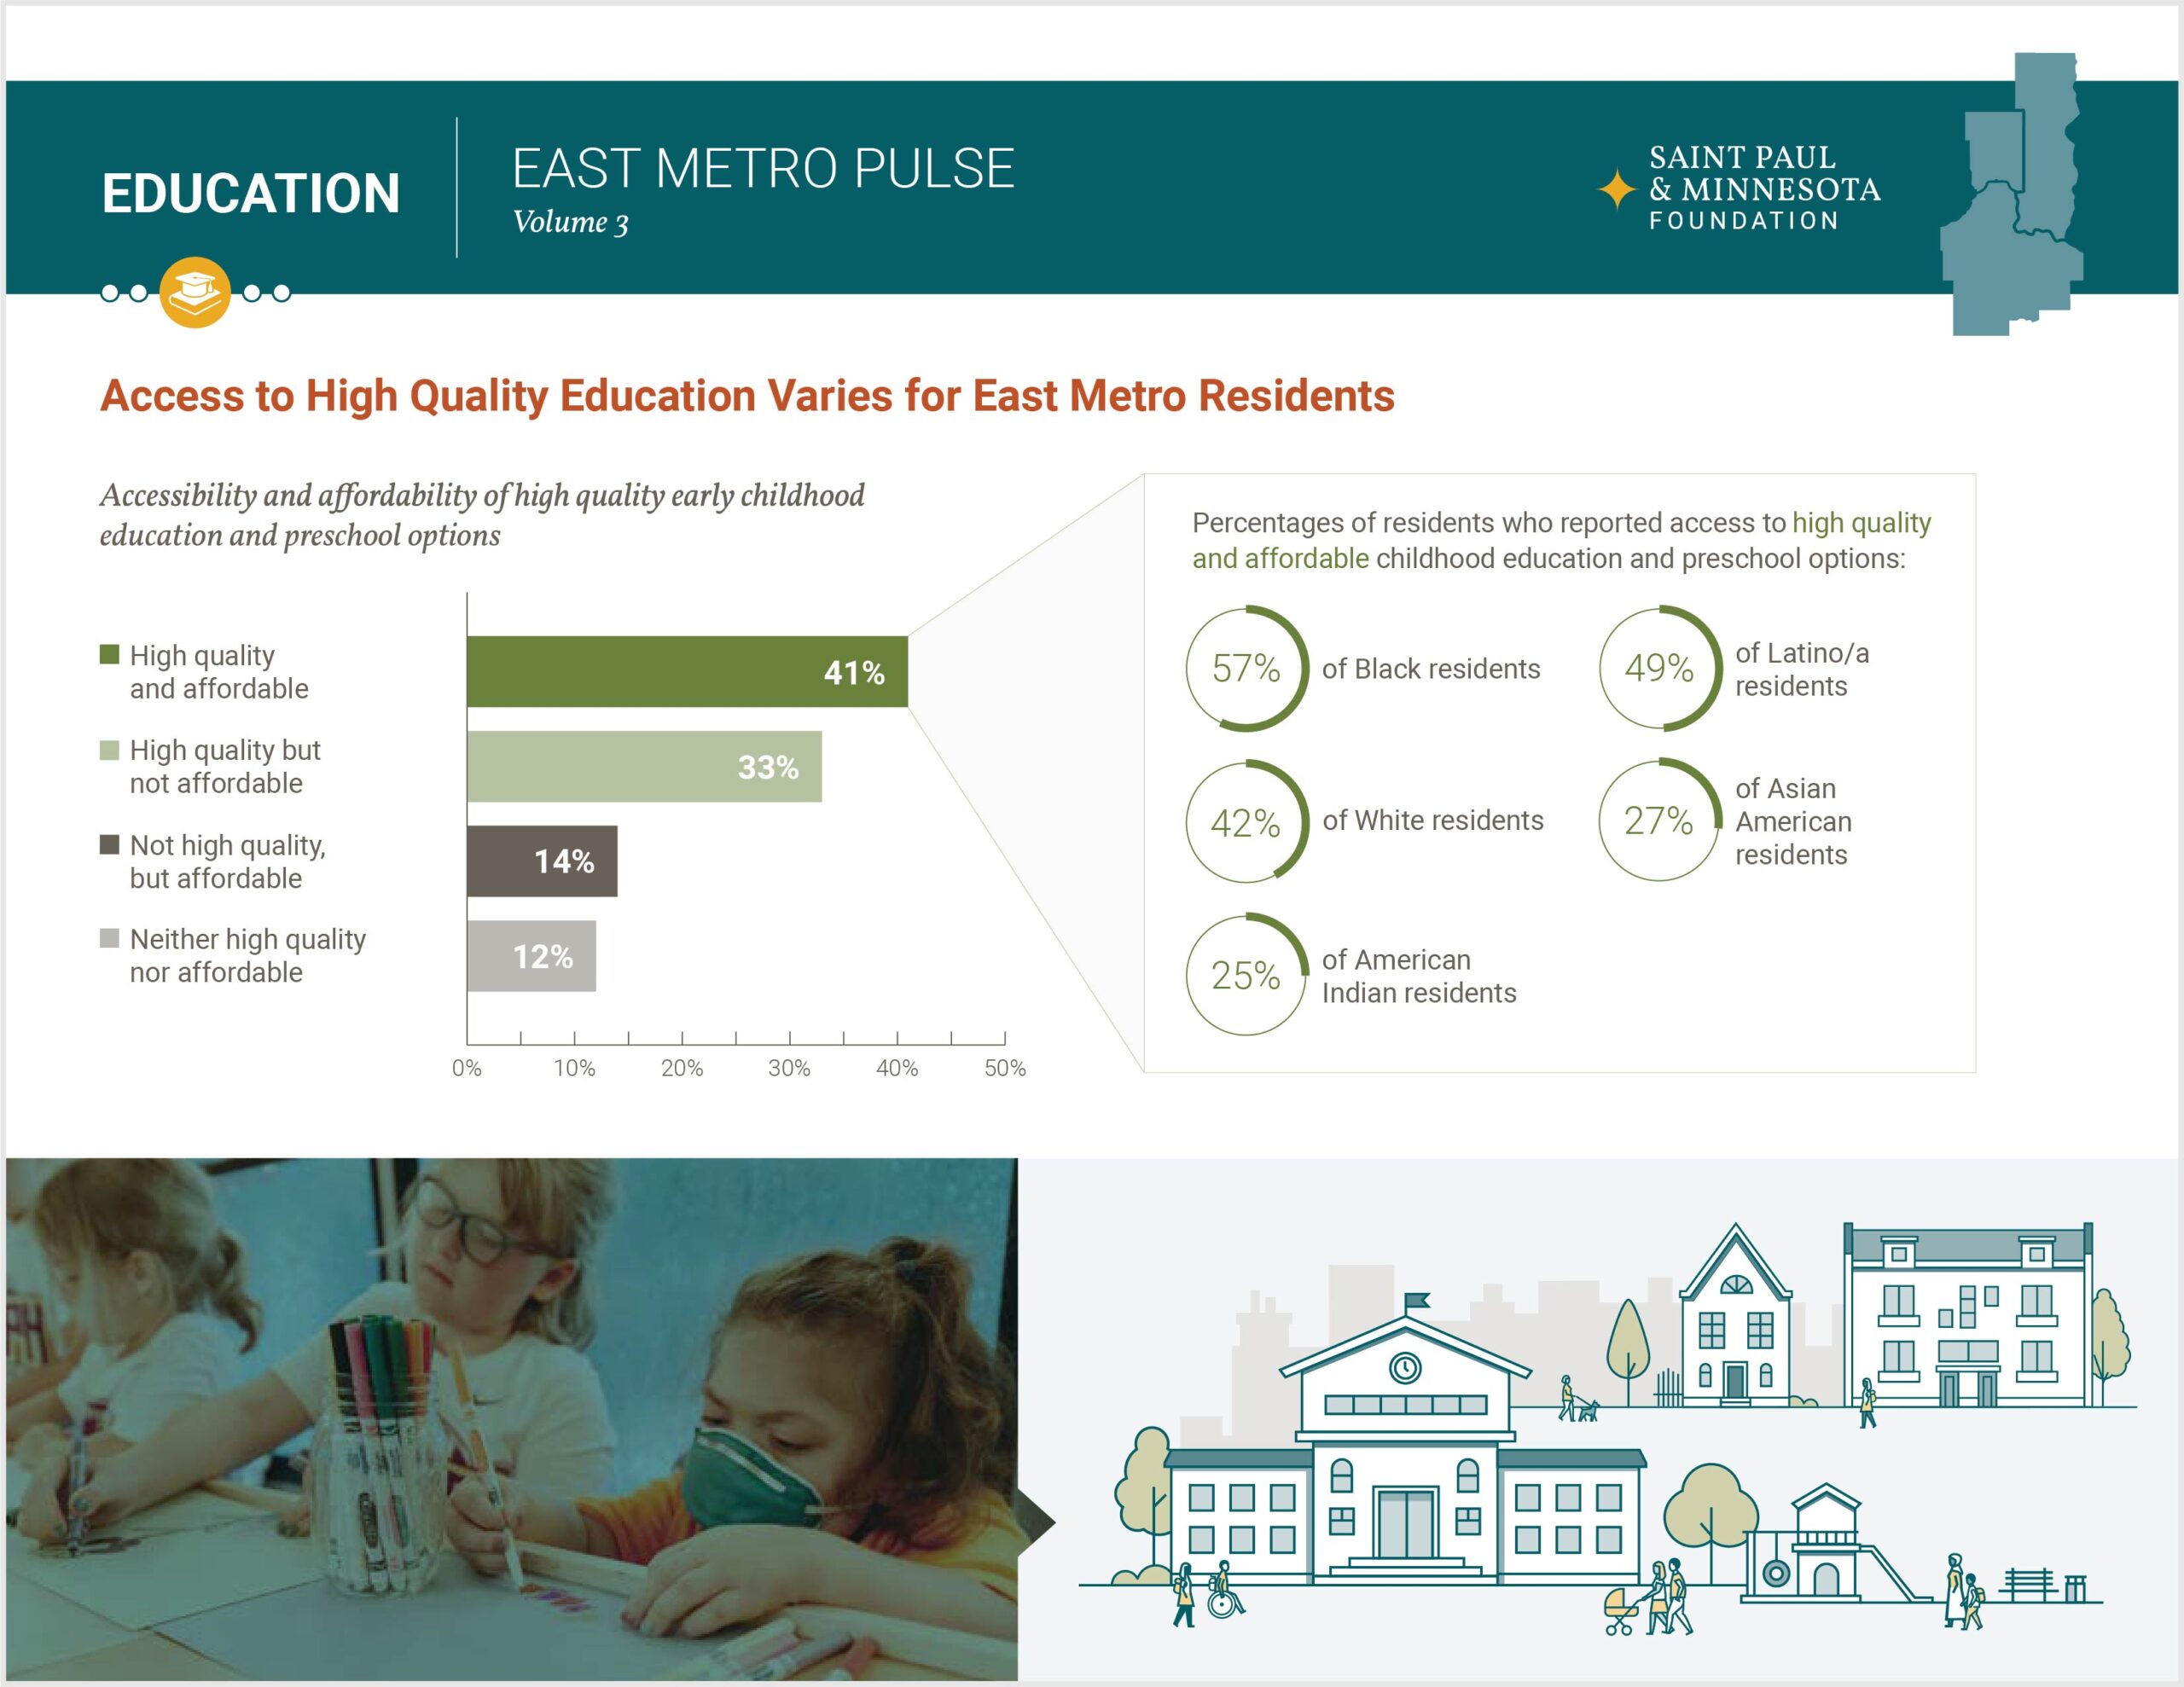
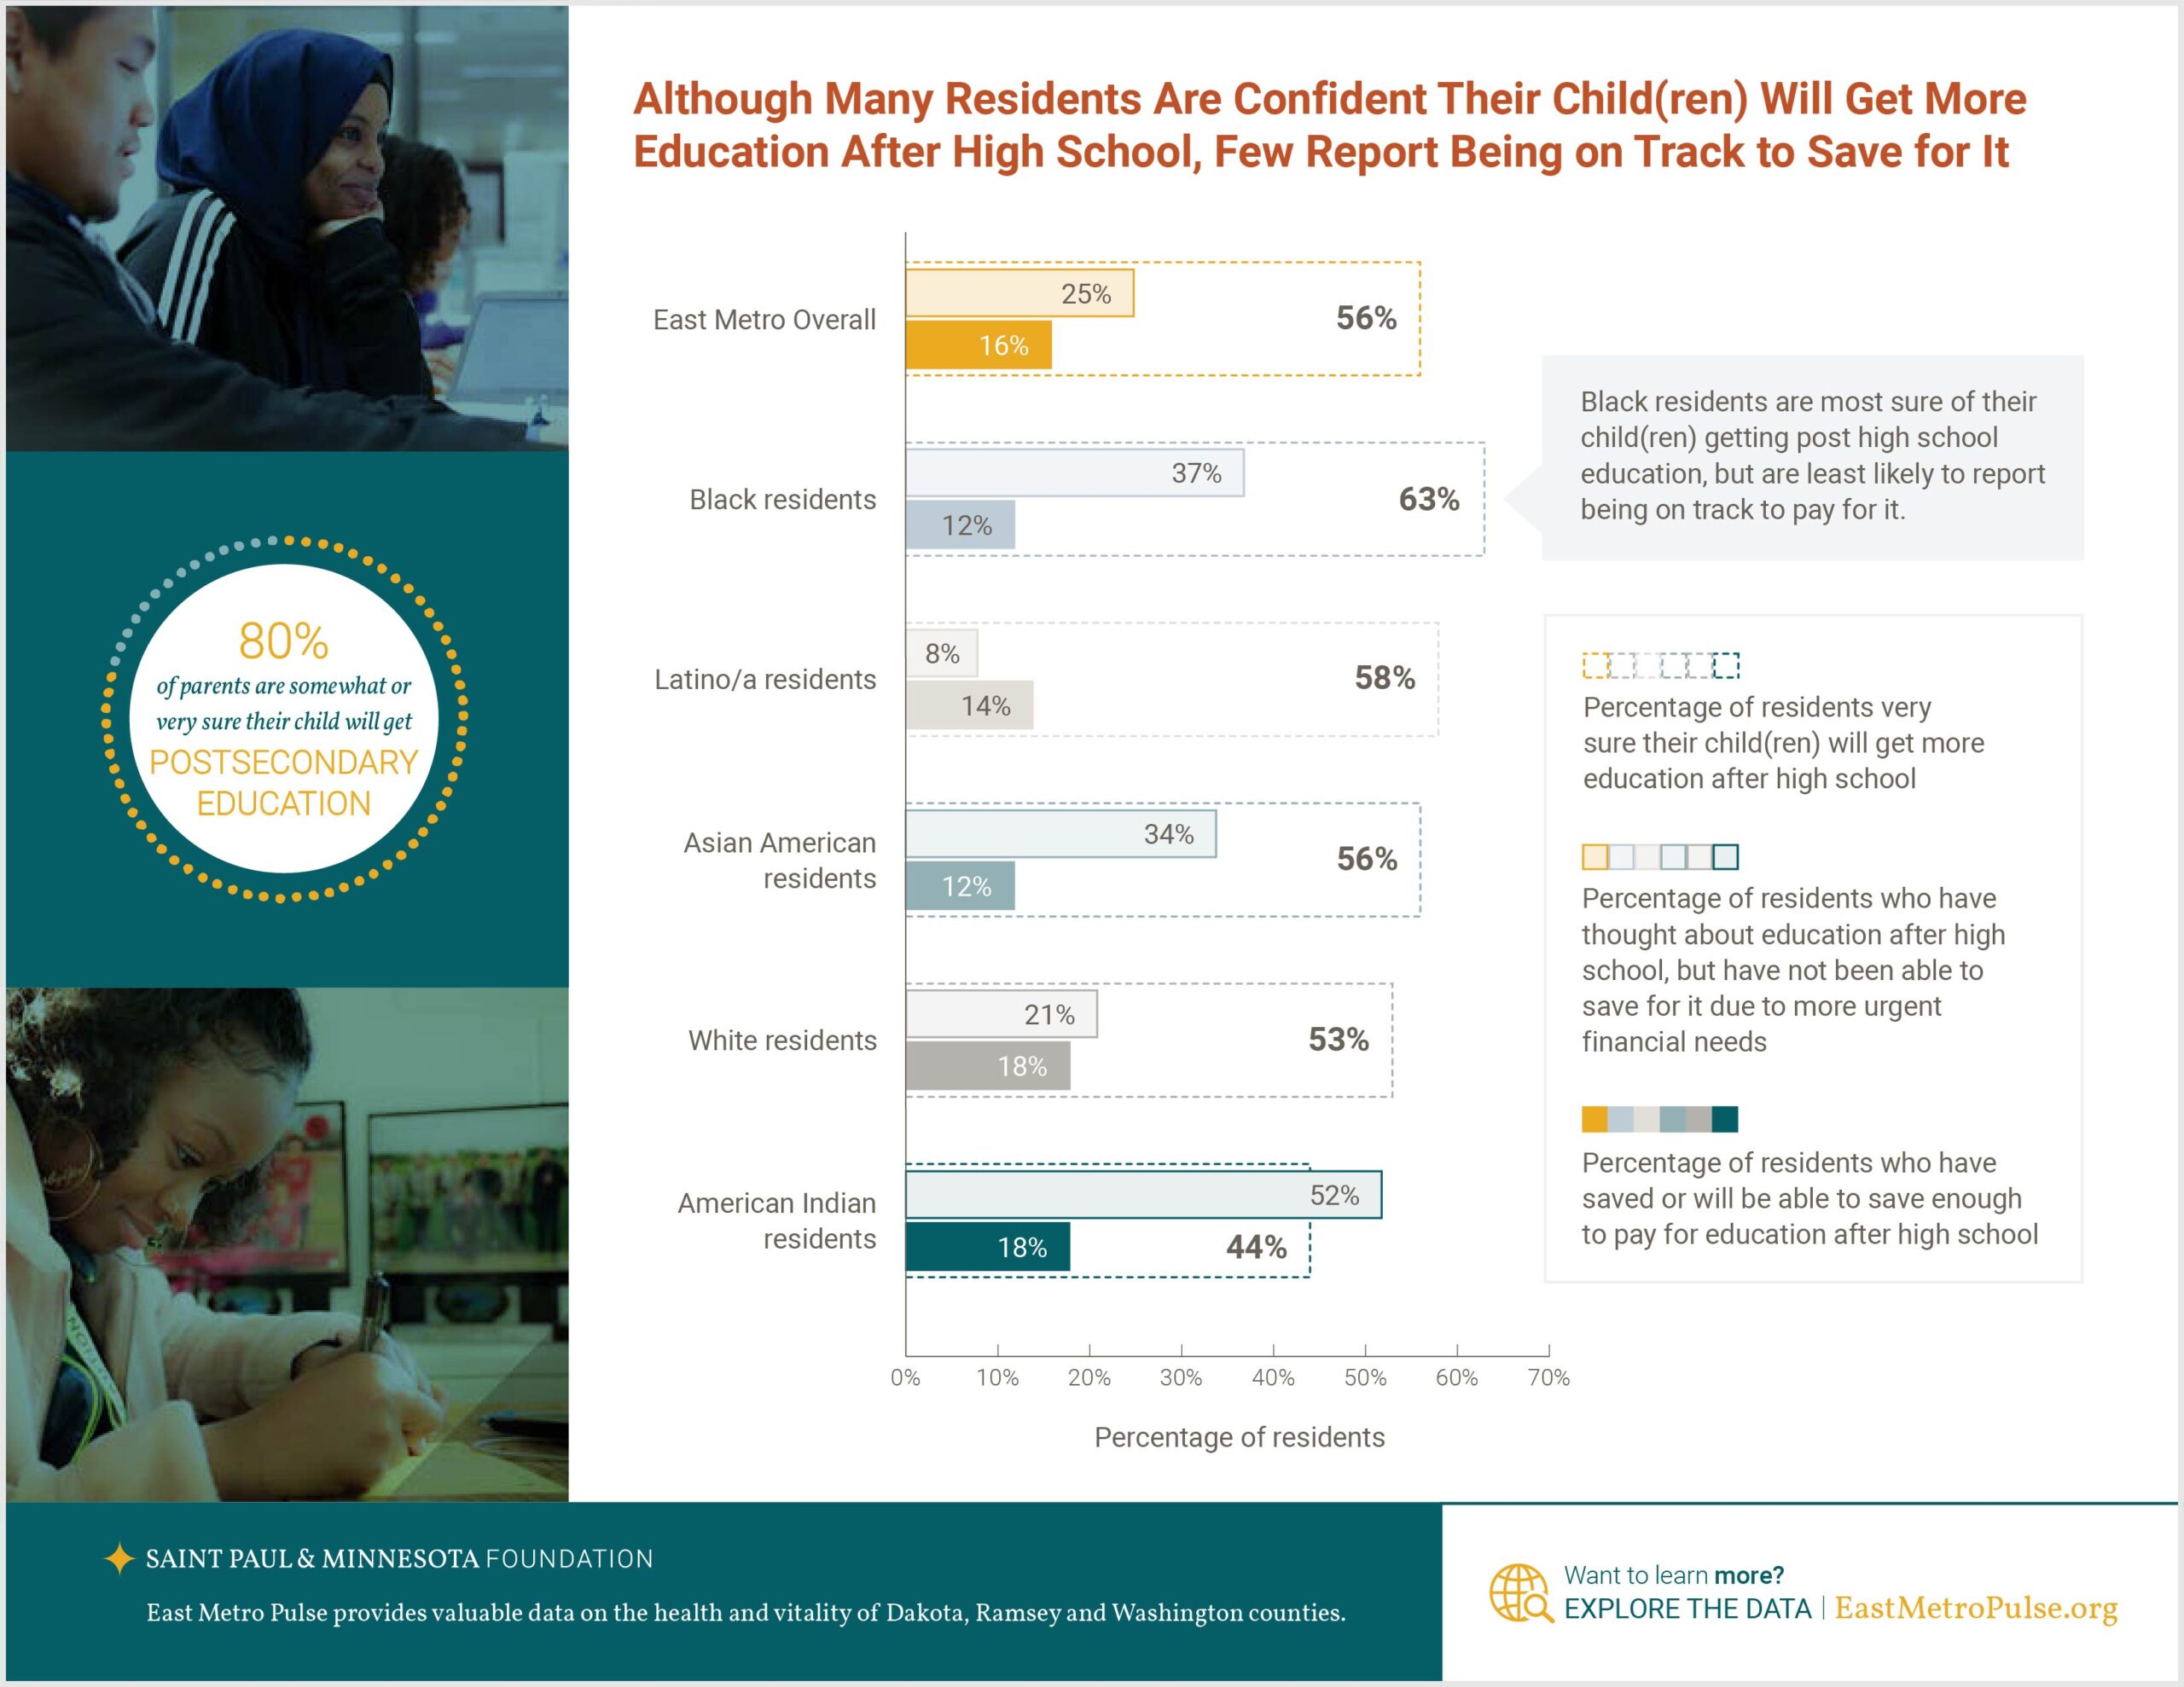
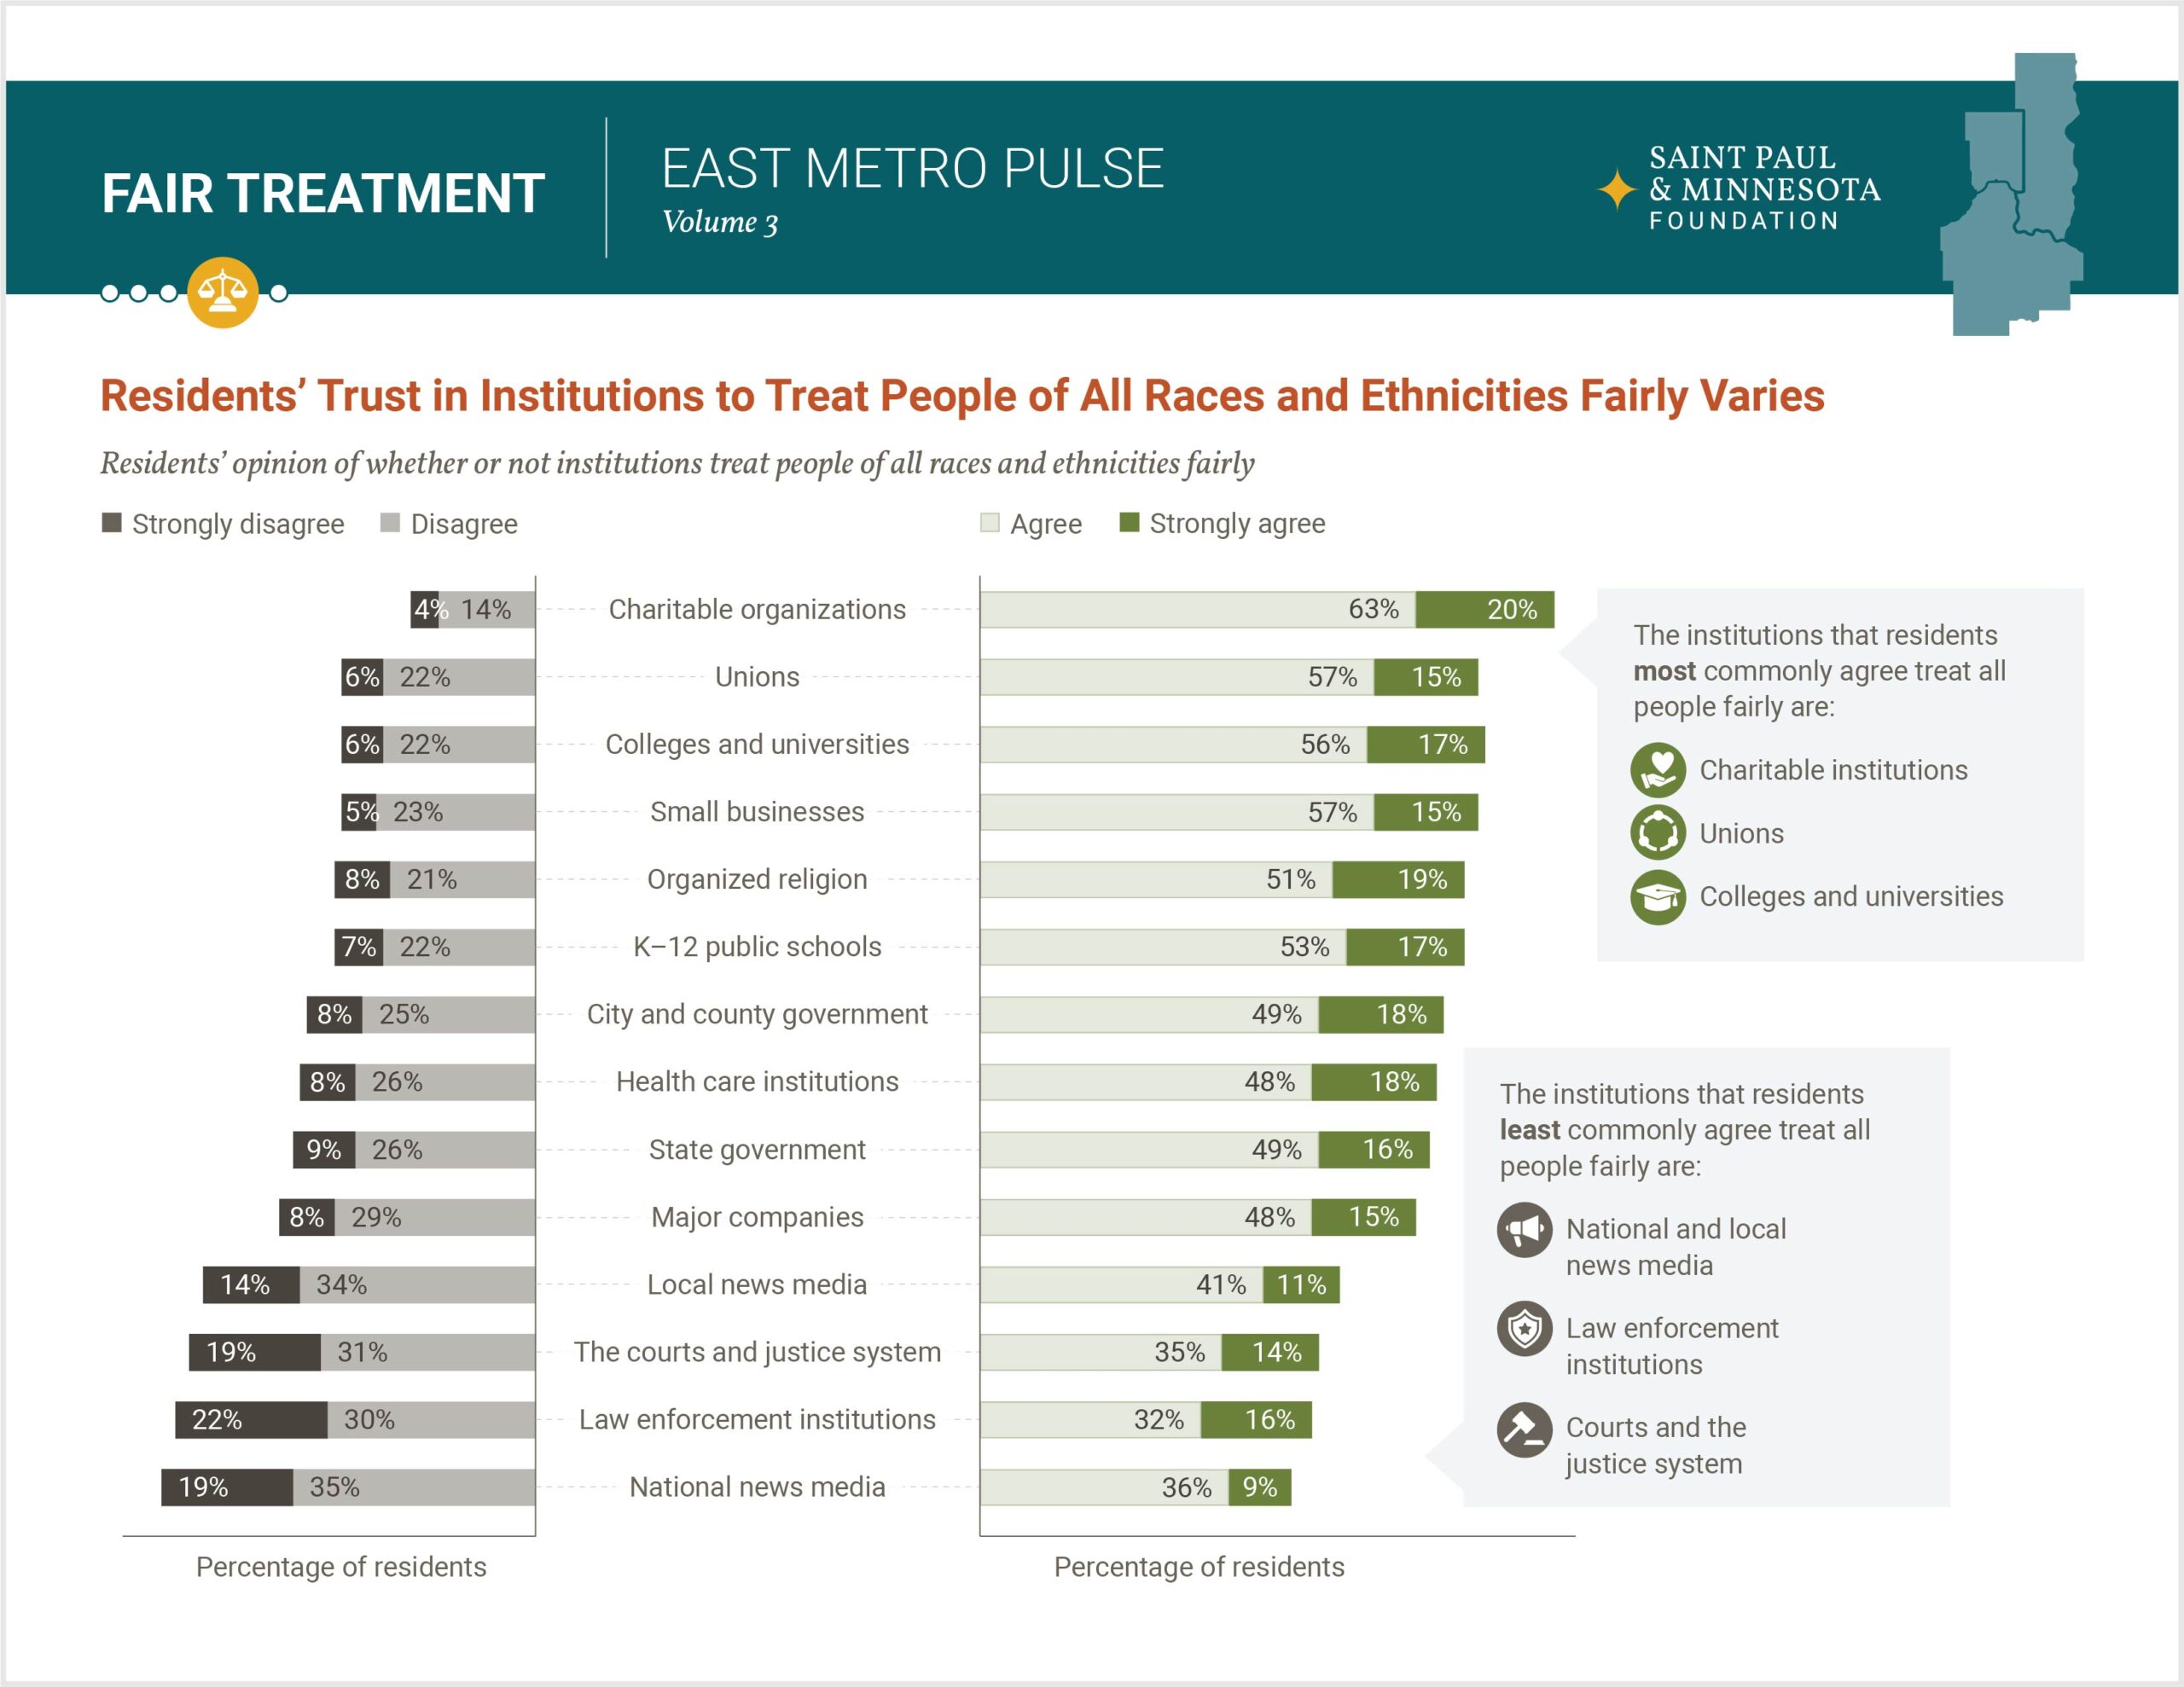
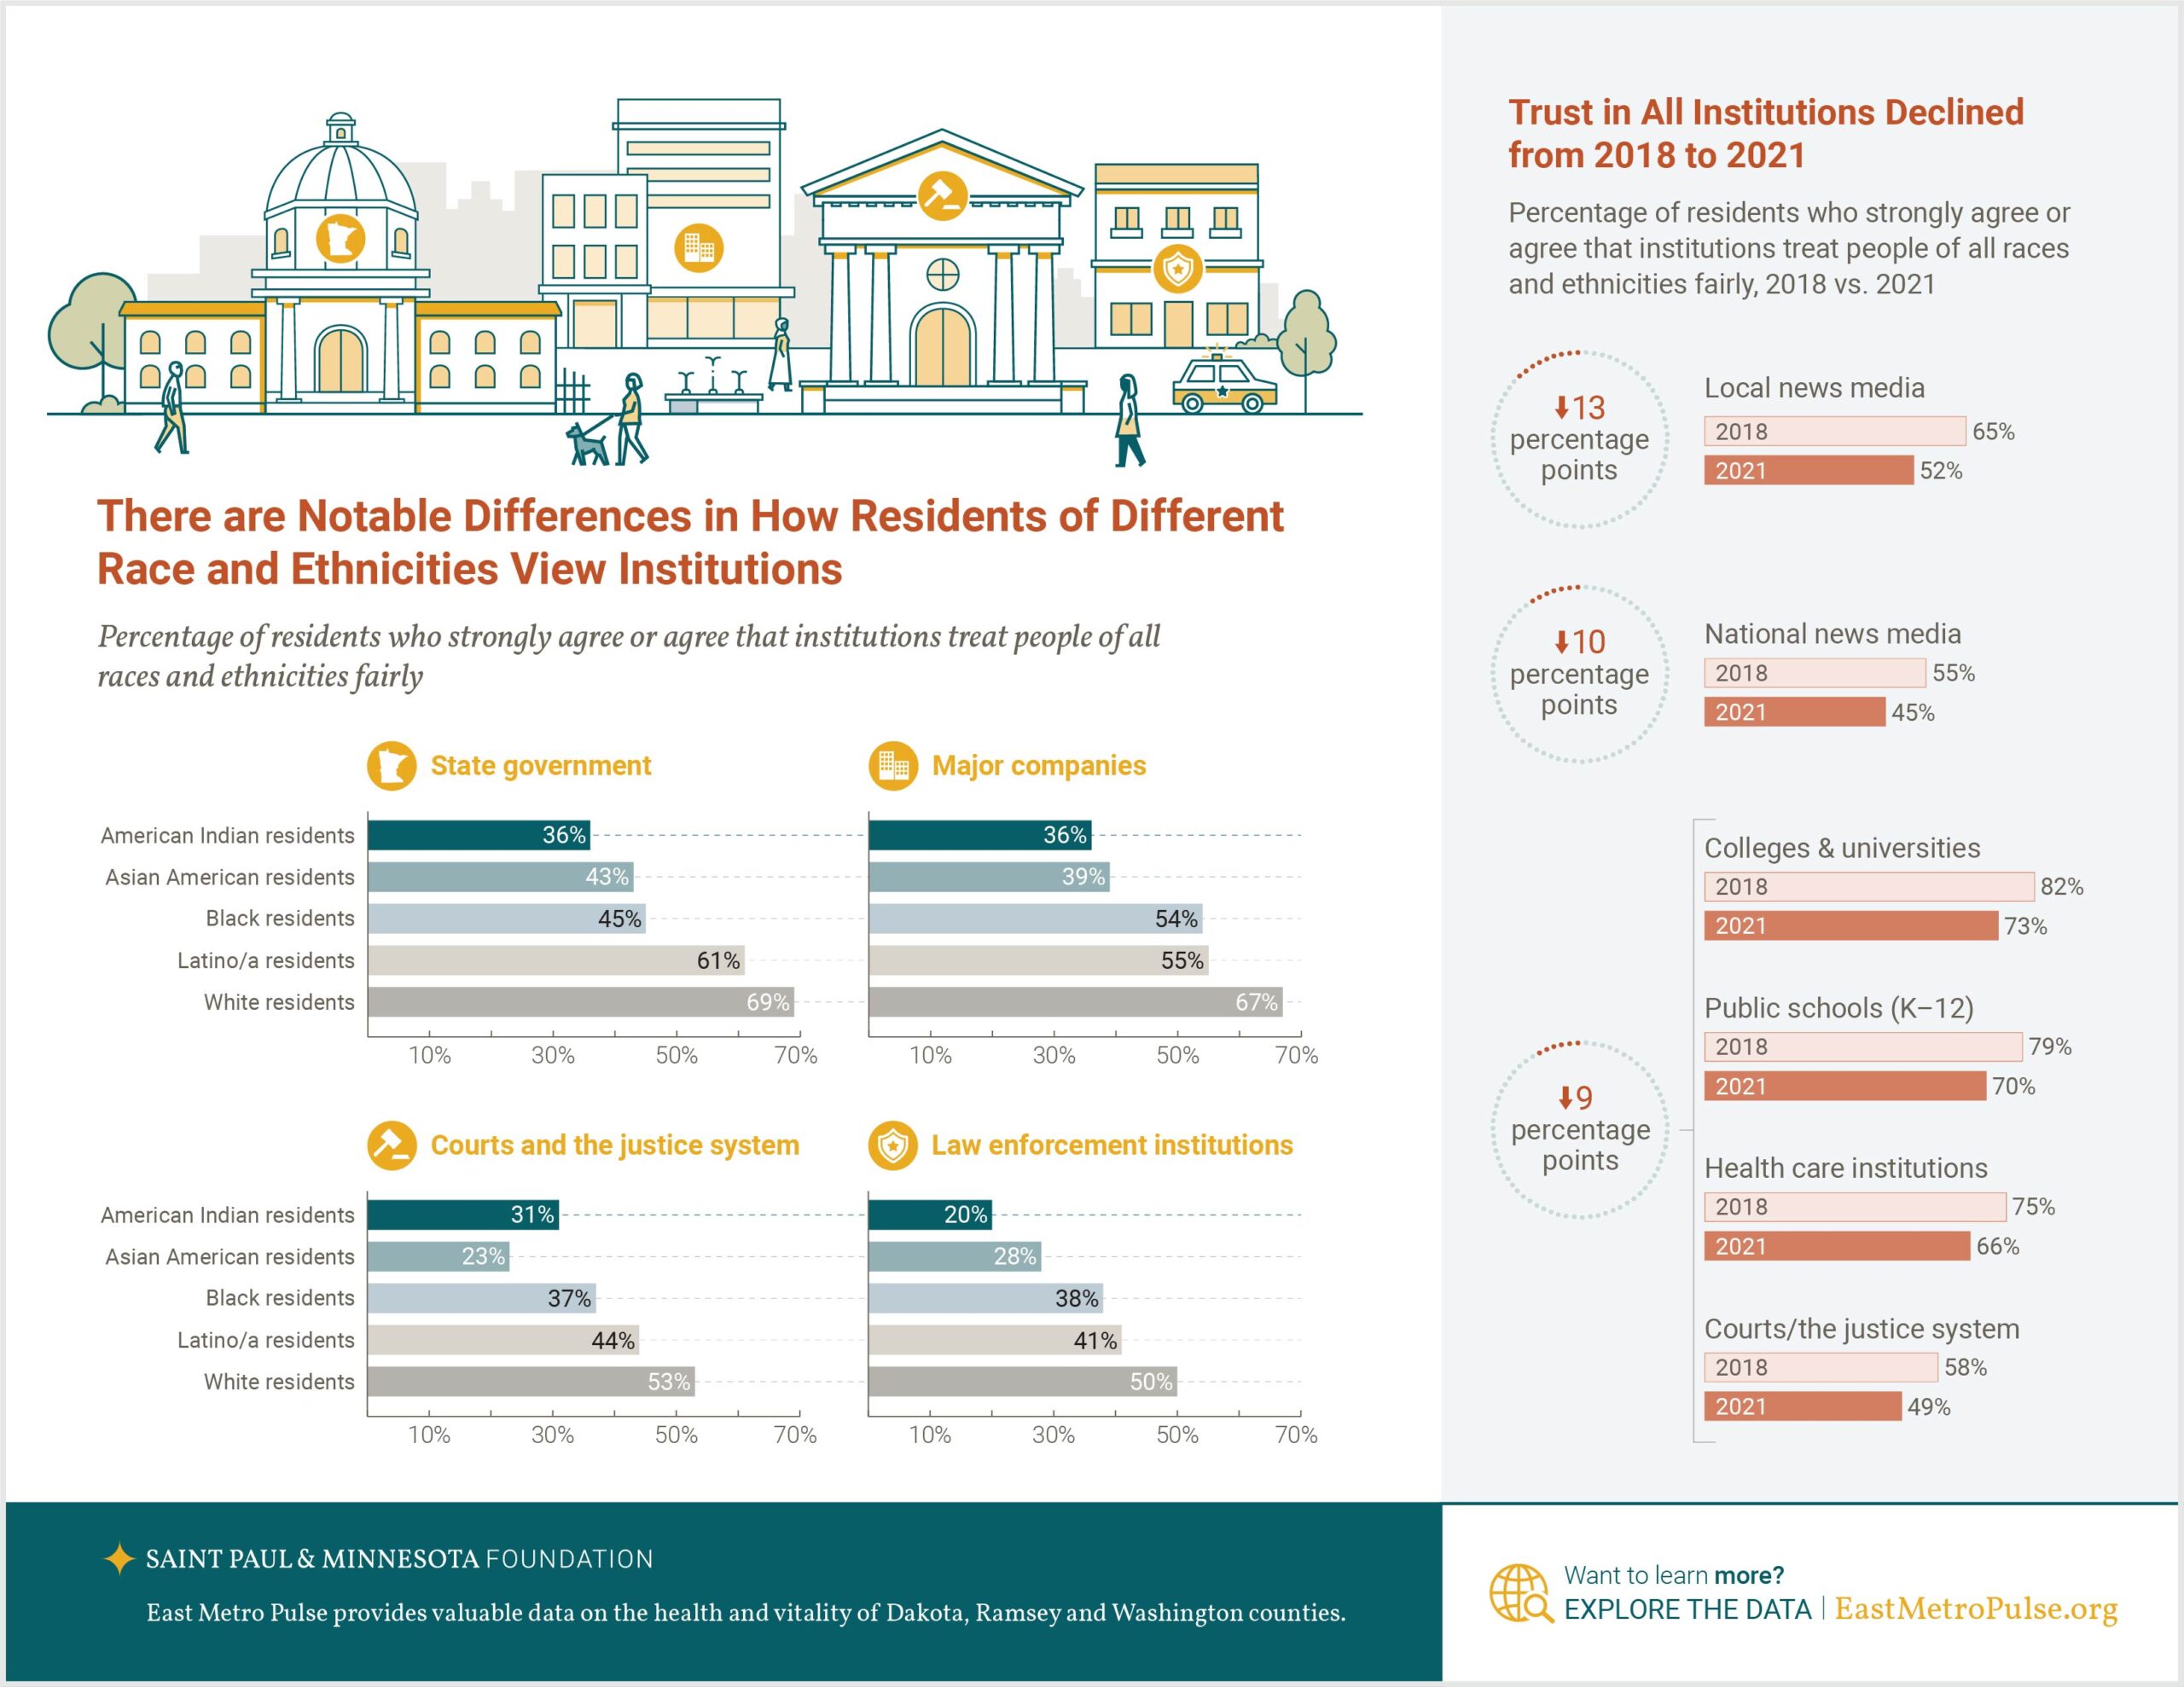
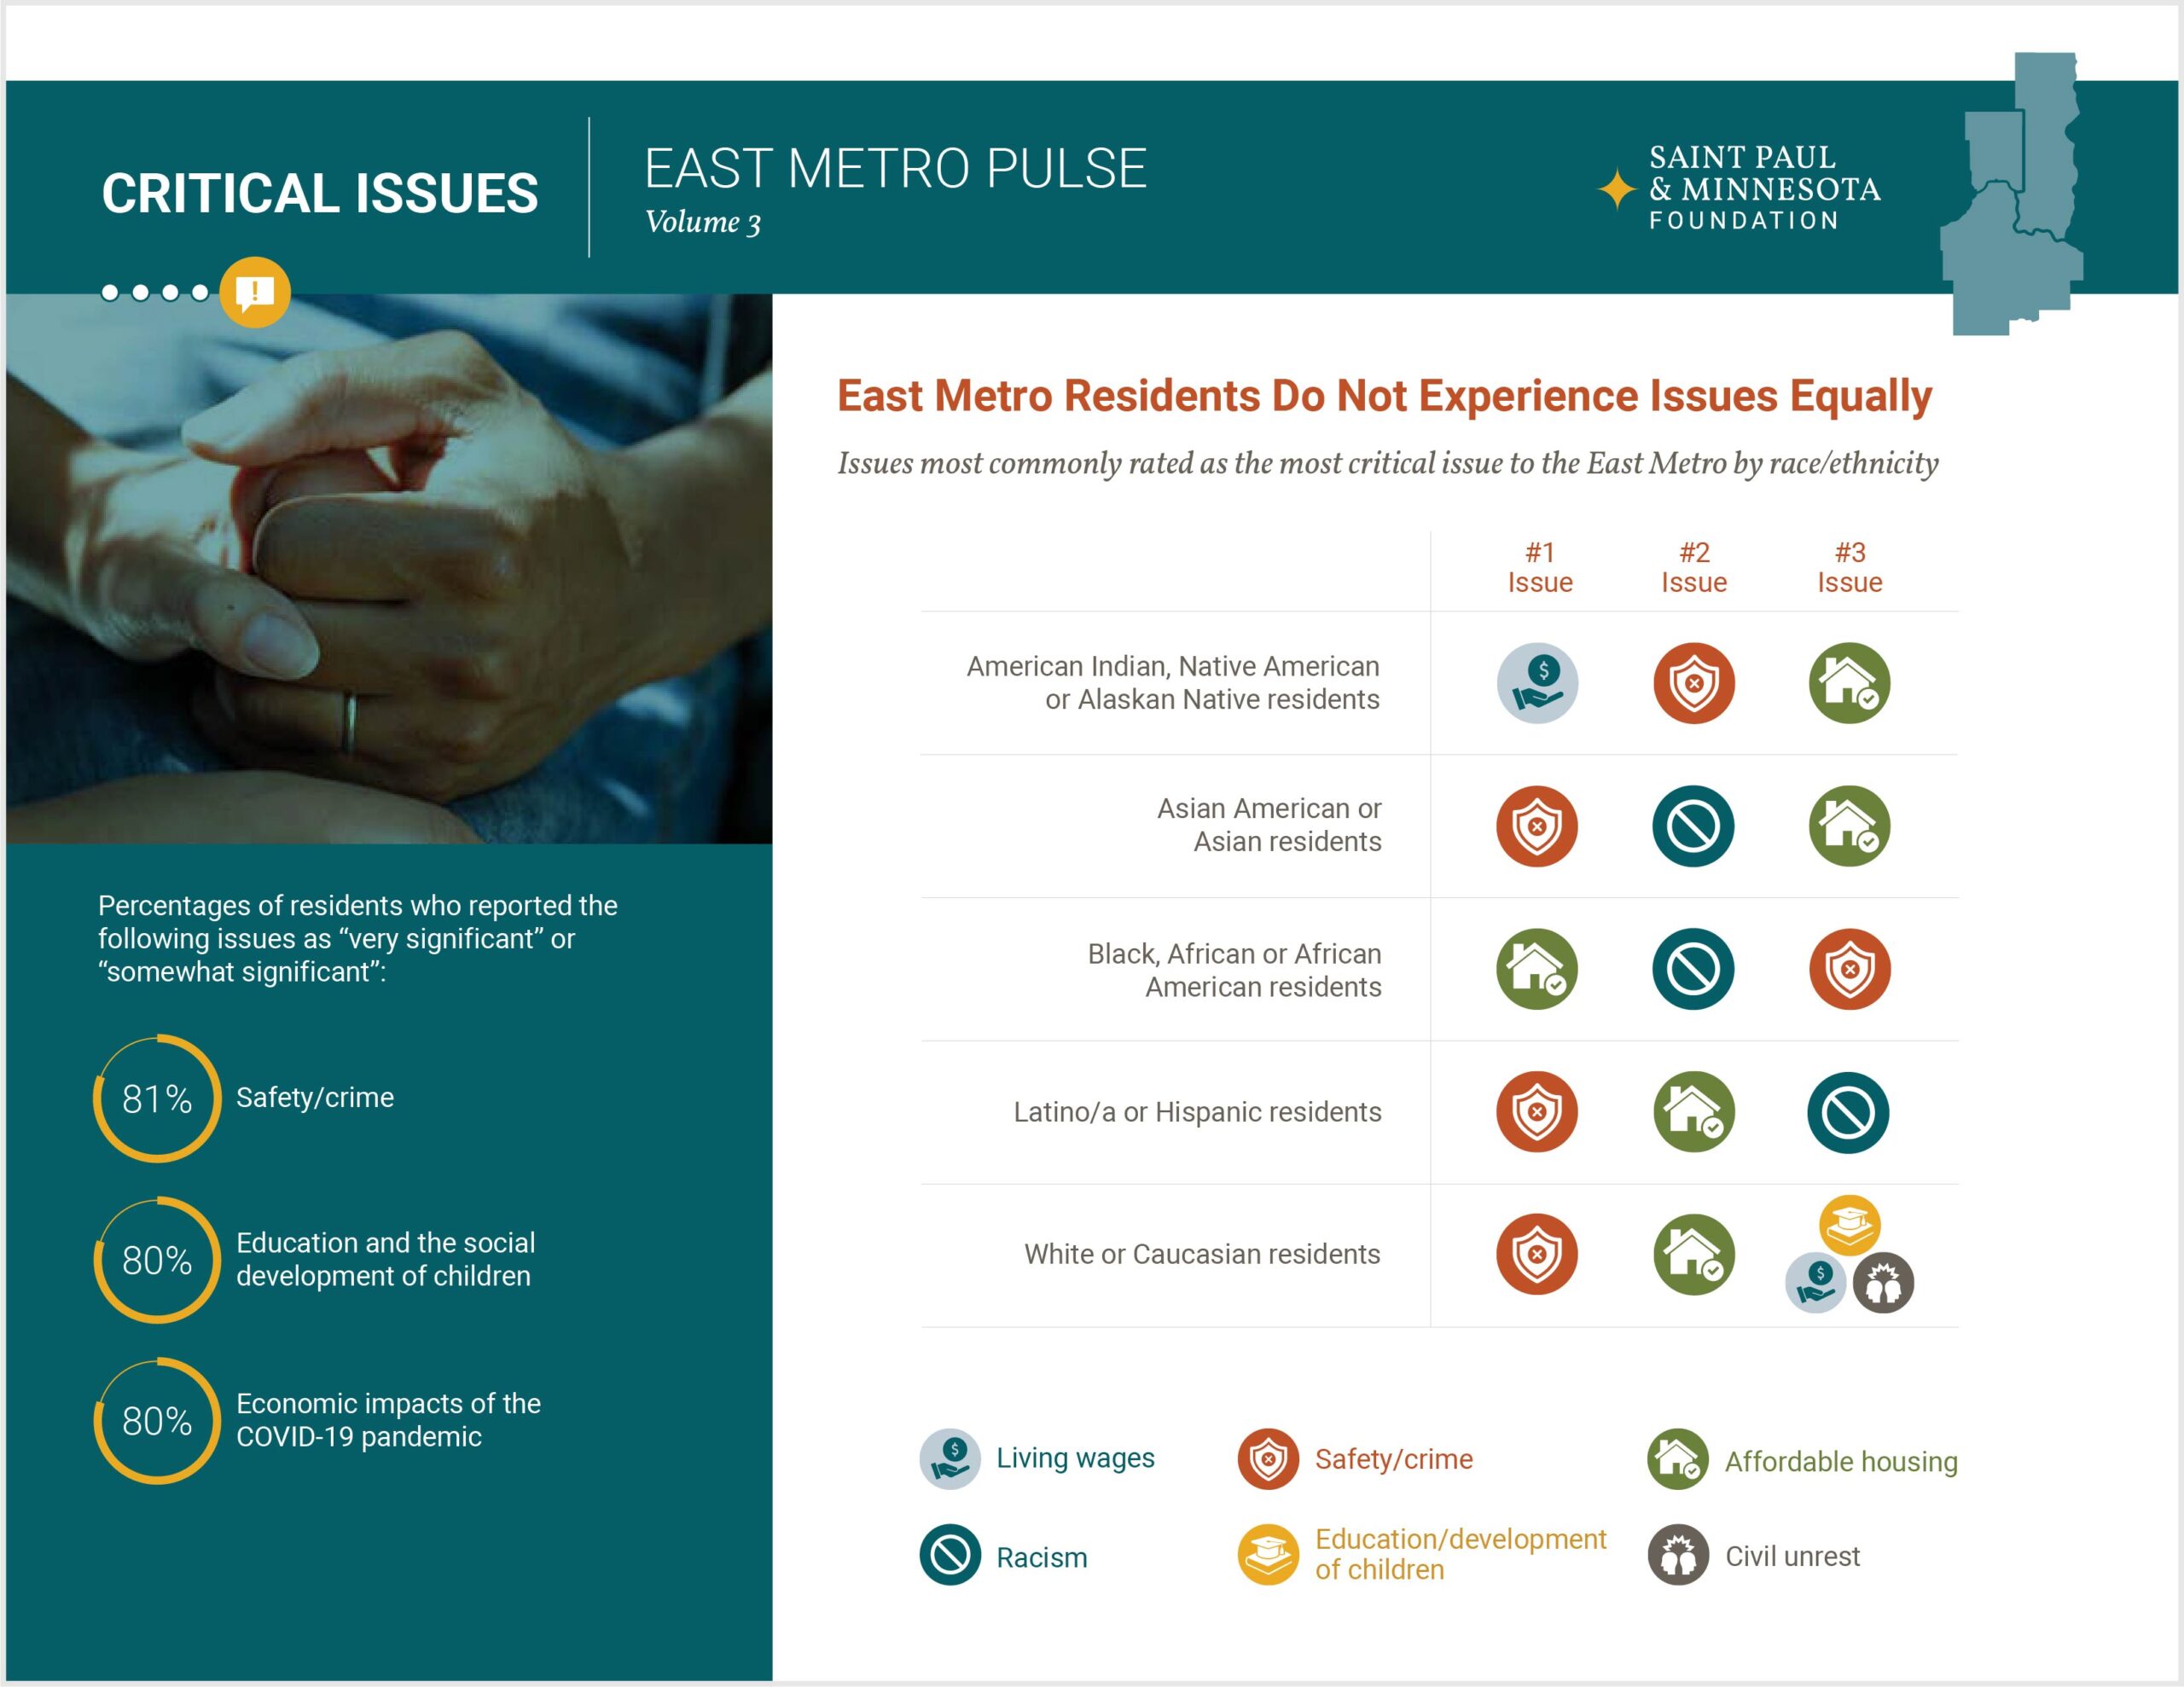
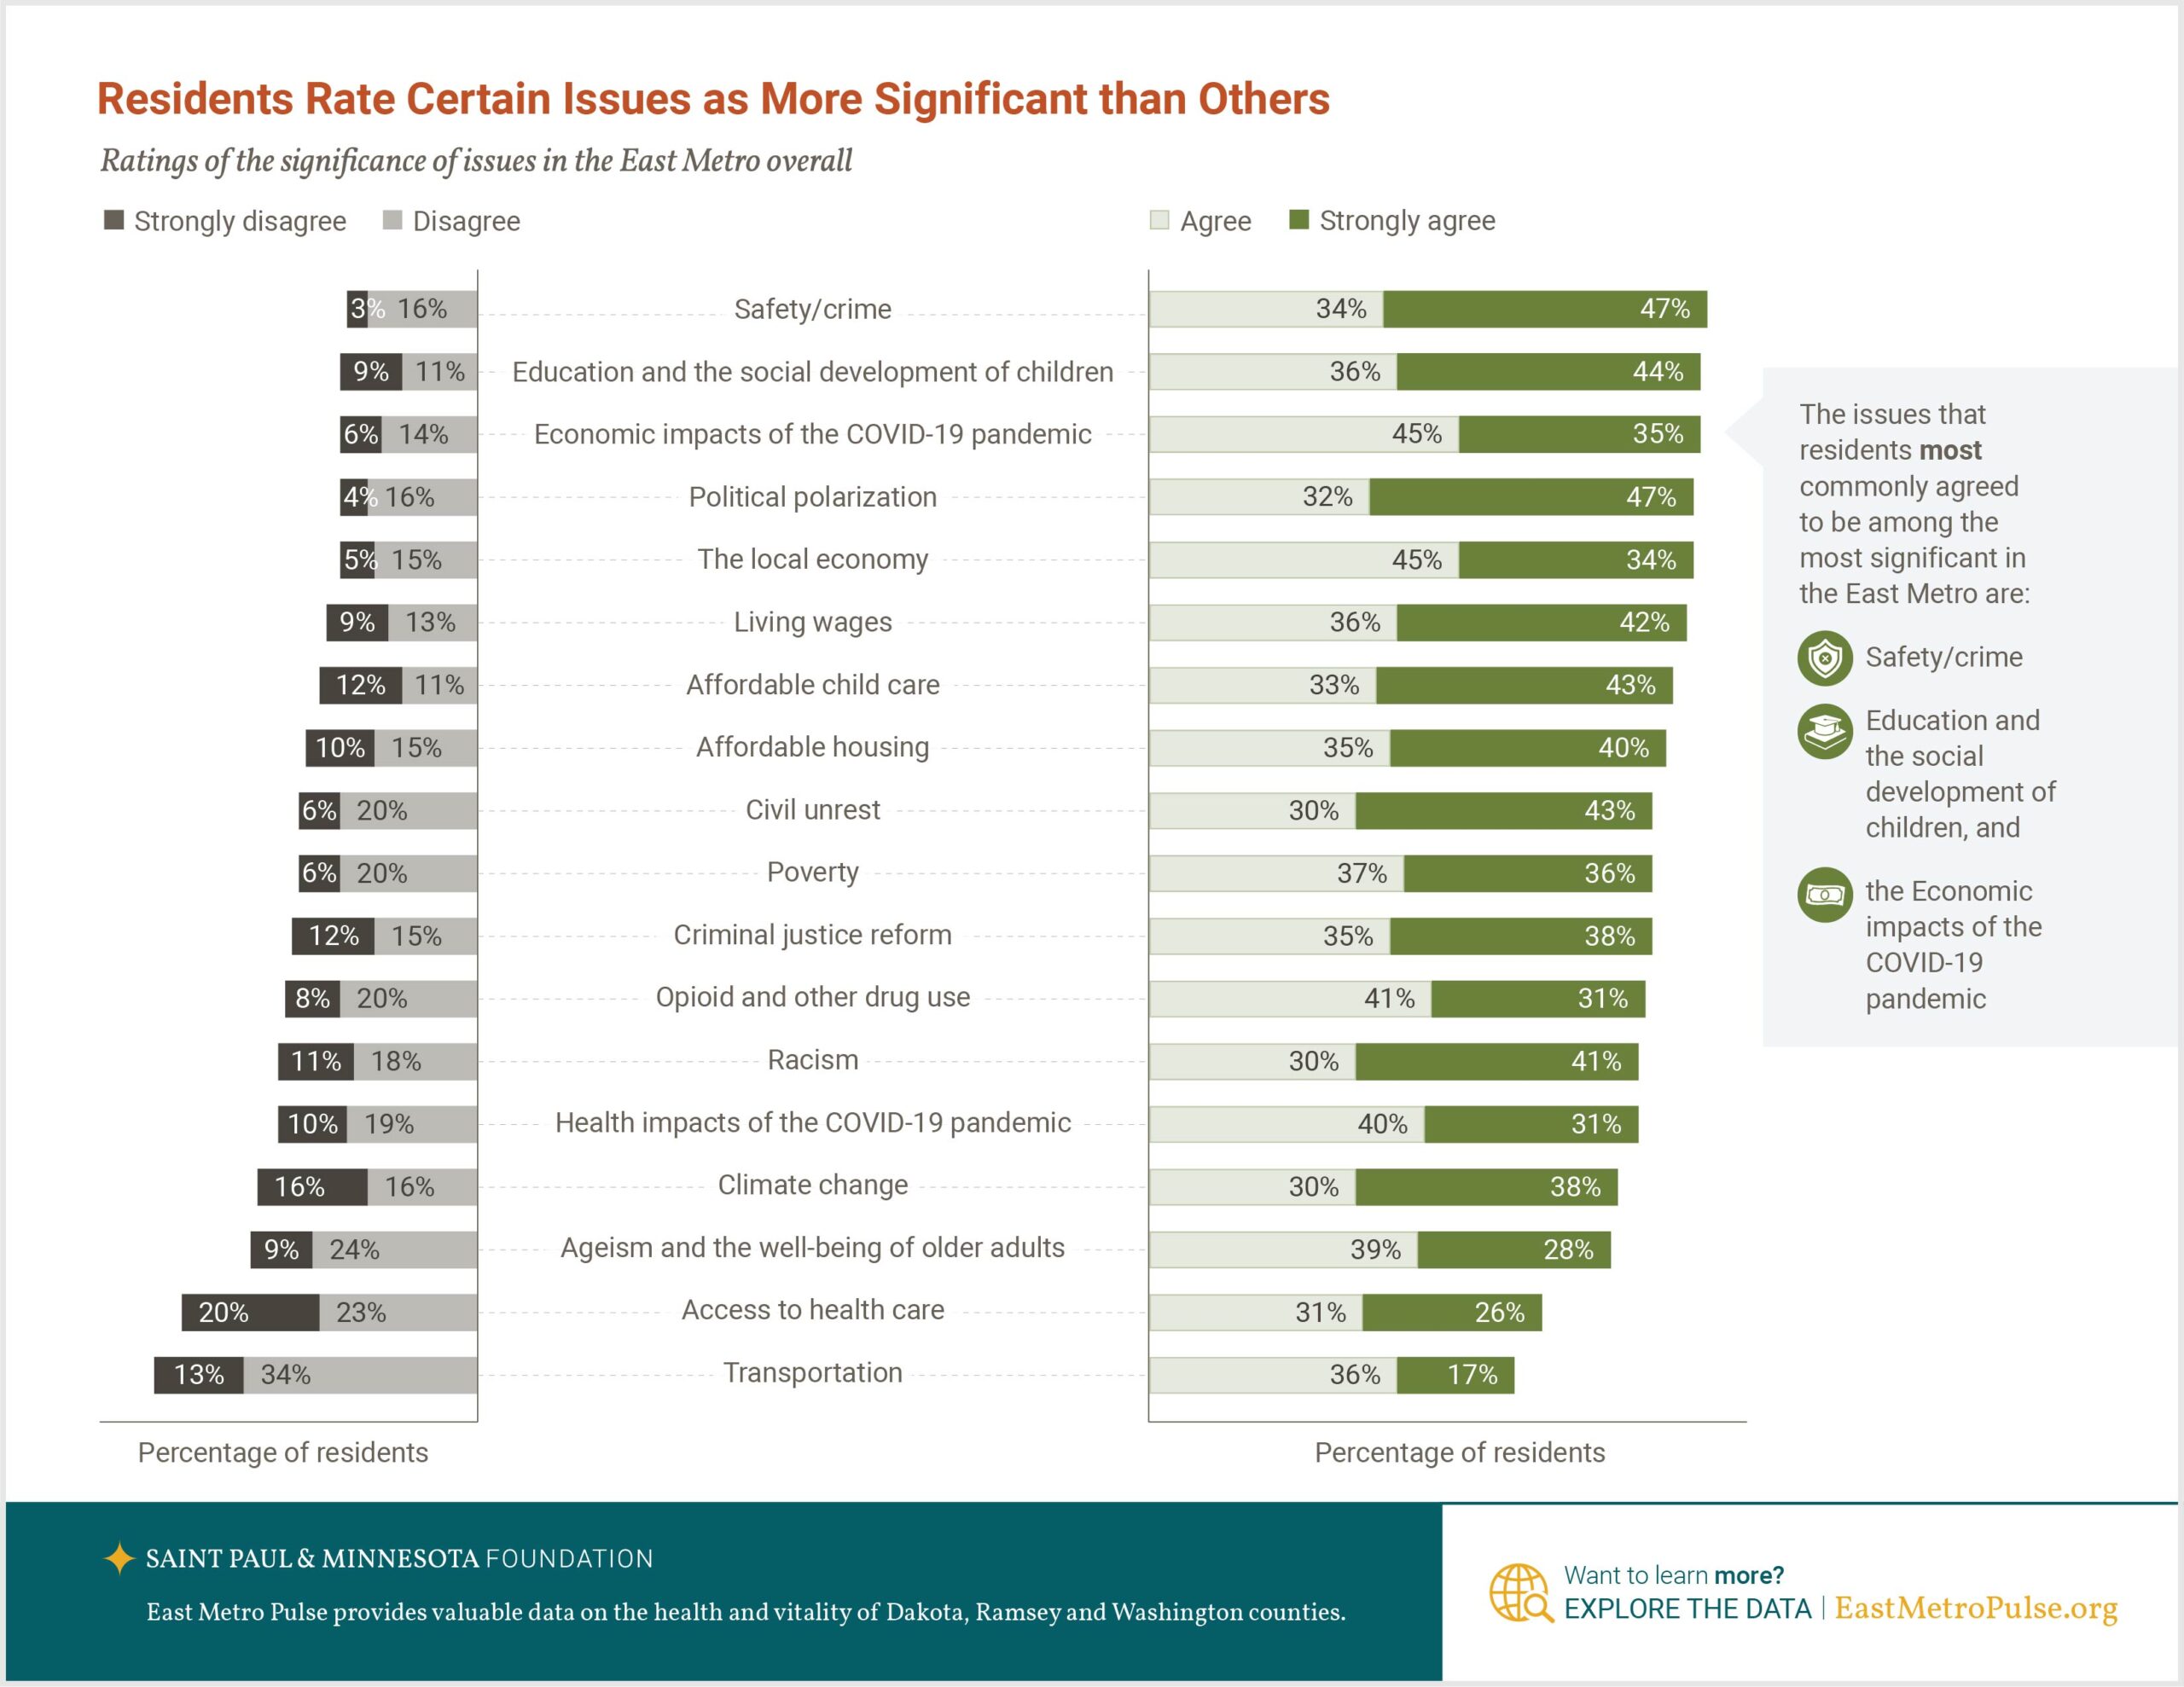
This spring, Background Stories worked with the St. Paul and Minnesota Foundation to create a series of mini-reports that highlight key data from the East Metro Pulse: a survey designed to reveal the strengths and challenges facing the residents in Dakota, Ramsey, and Washington Counties.
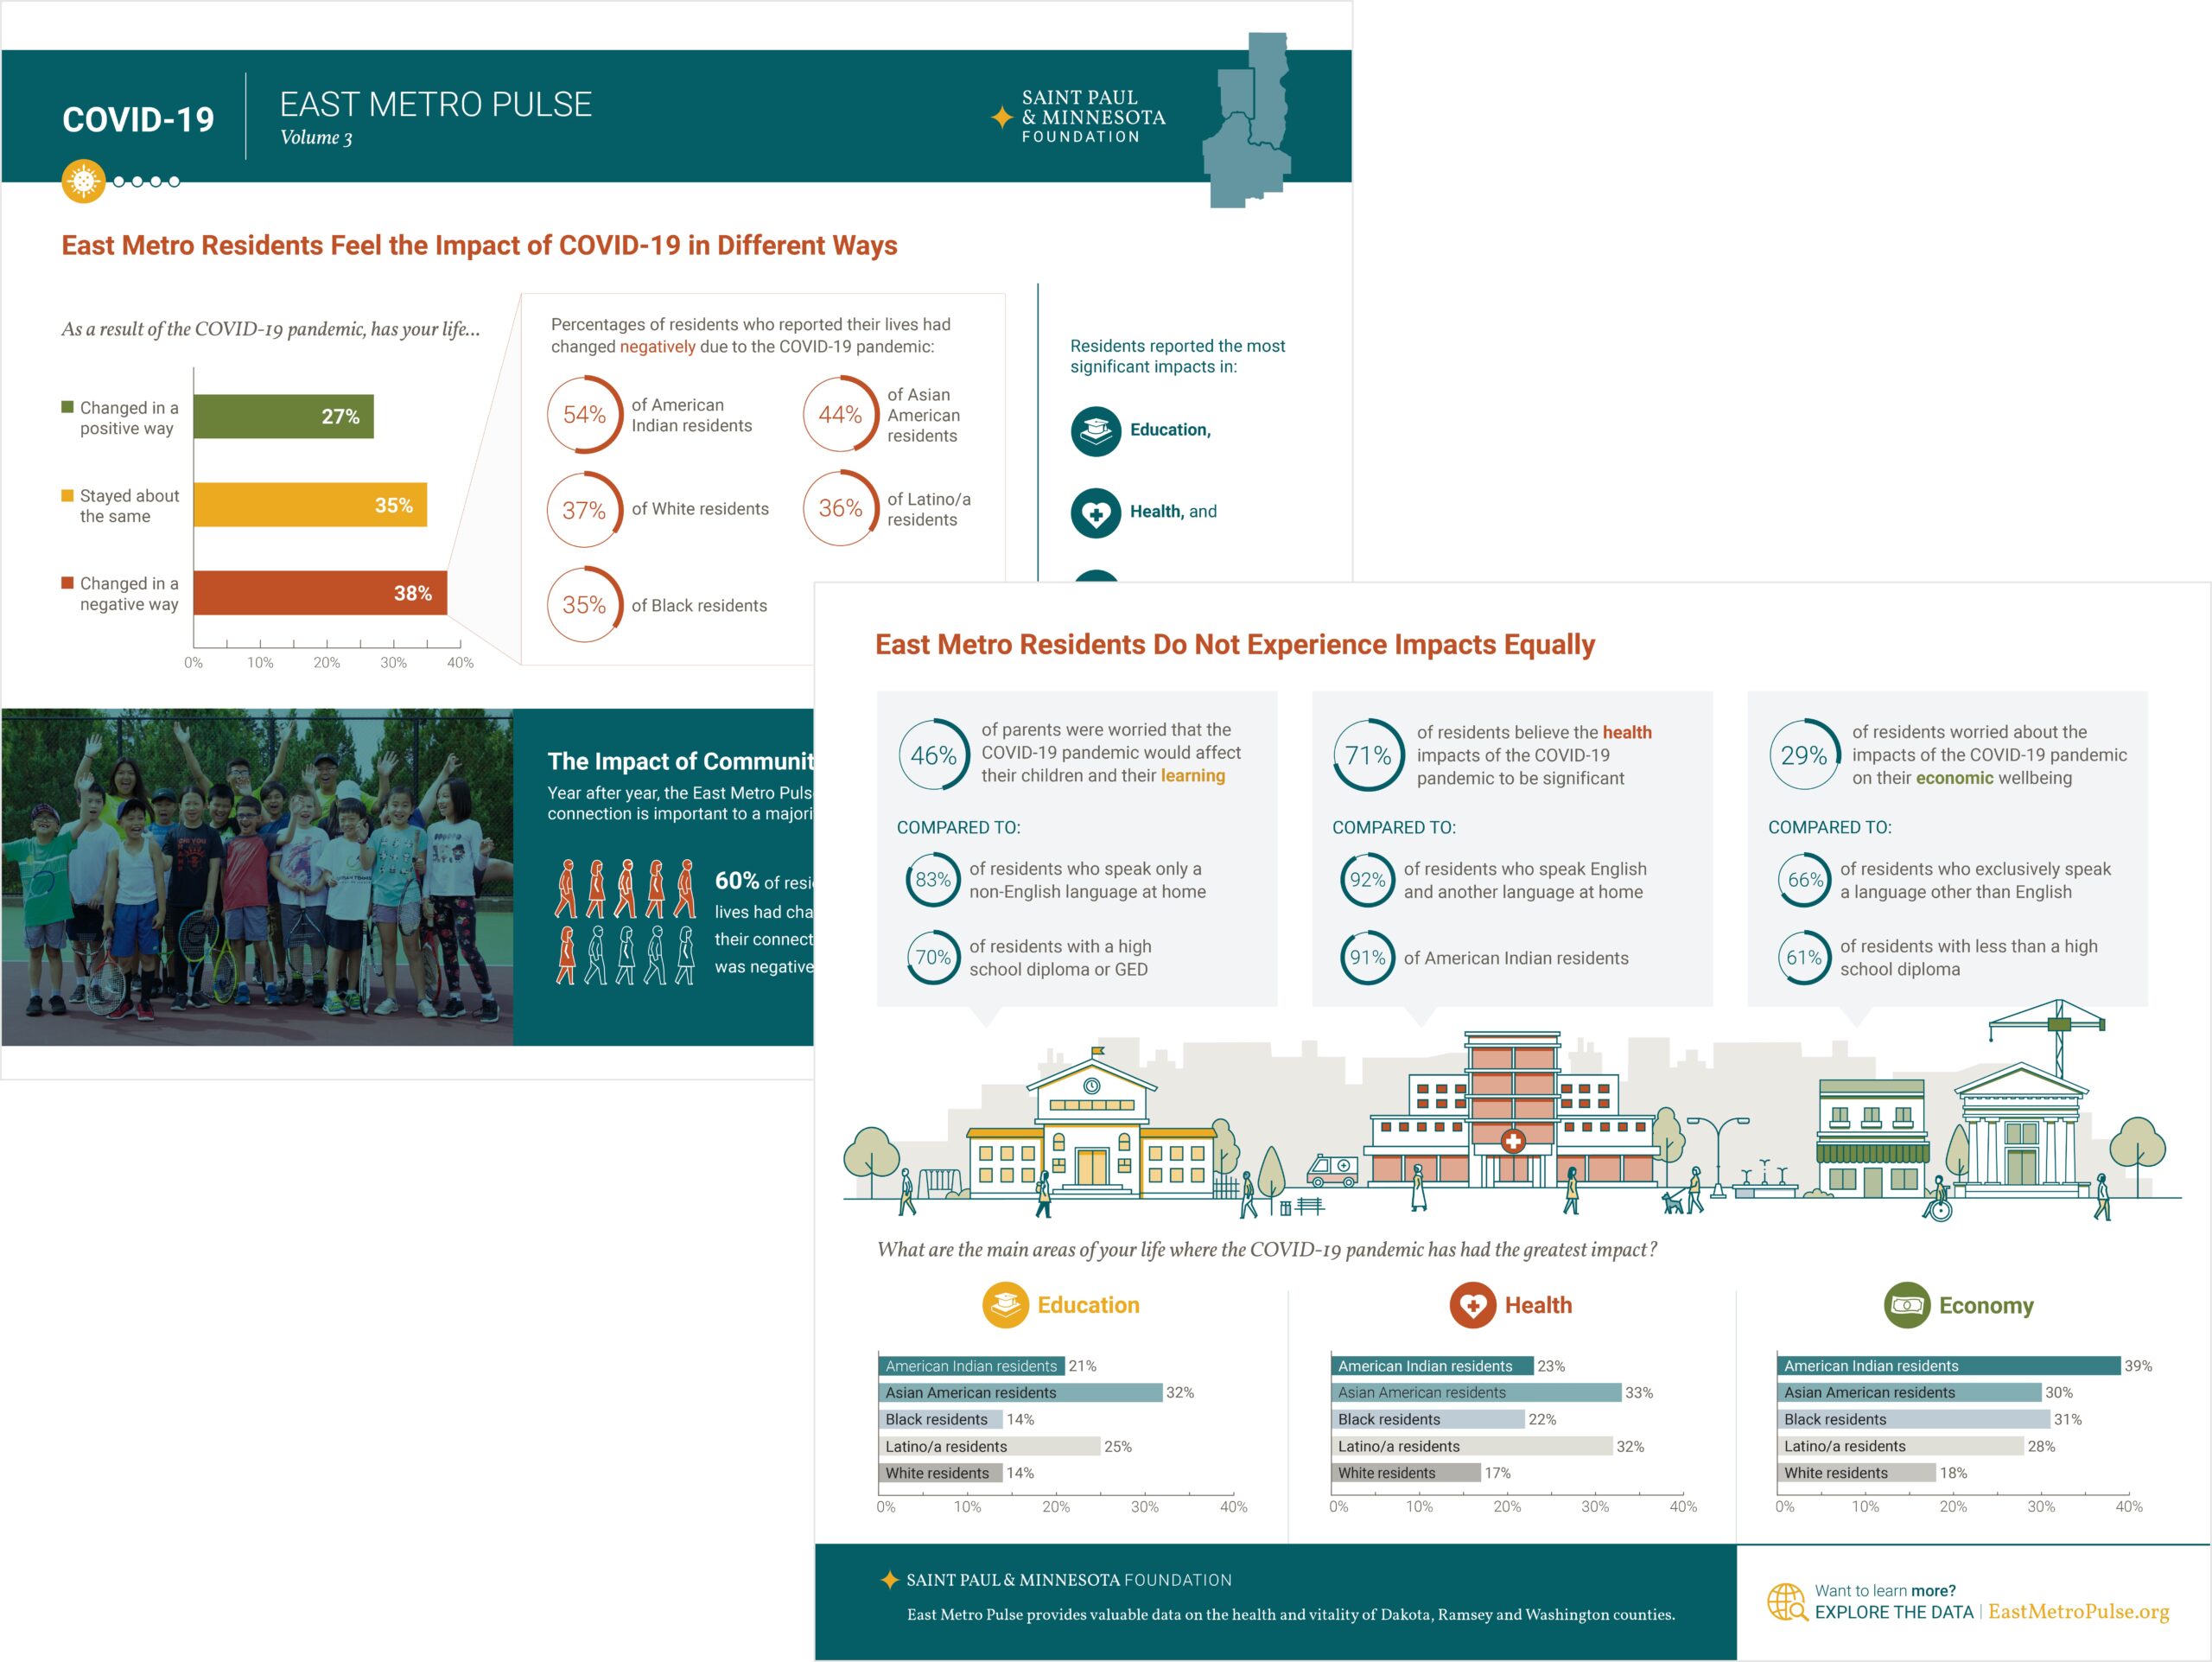
These reports integrated infographics, illustrations, and photographs to visualize not just the numbers of the survey results, but to also illustrate the people who contributed to the data and the places in which they live. Adding a human dimension to data connects viewers emotionally to the impact these numbers have, inspiring them to create change and address the numerically supported challenges that are revealed.
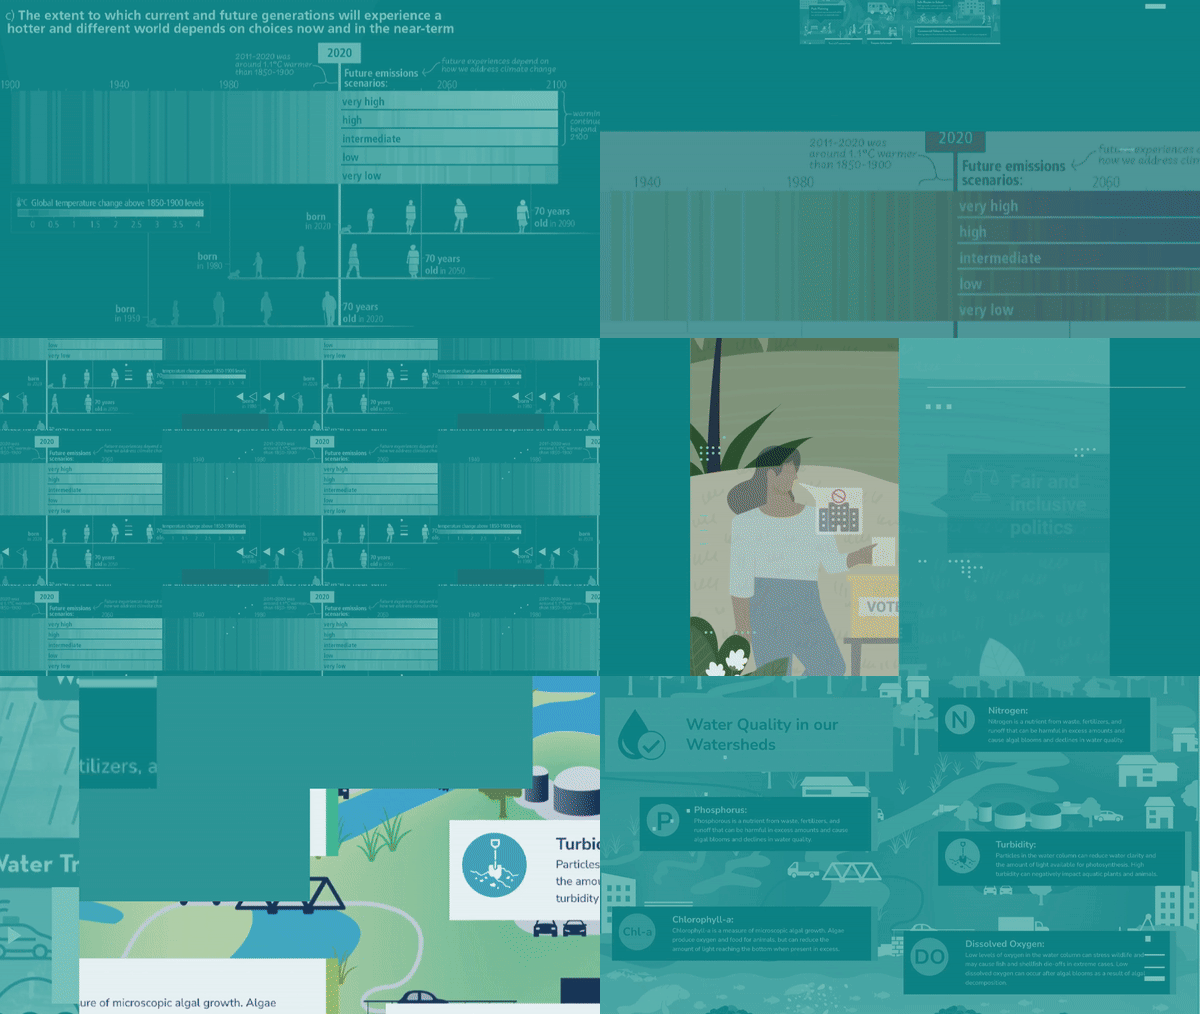
To help the St. Paul and Minnesota Foundation tie this storytelling together, our team created a series of motion graphics for social media use. The motion-based nature caught viewer attention and then encouraged them to visit the full reports online.


